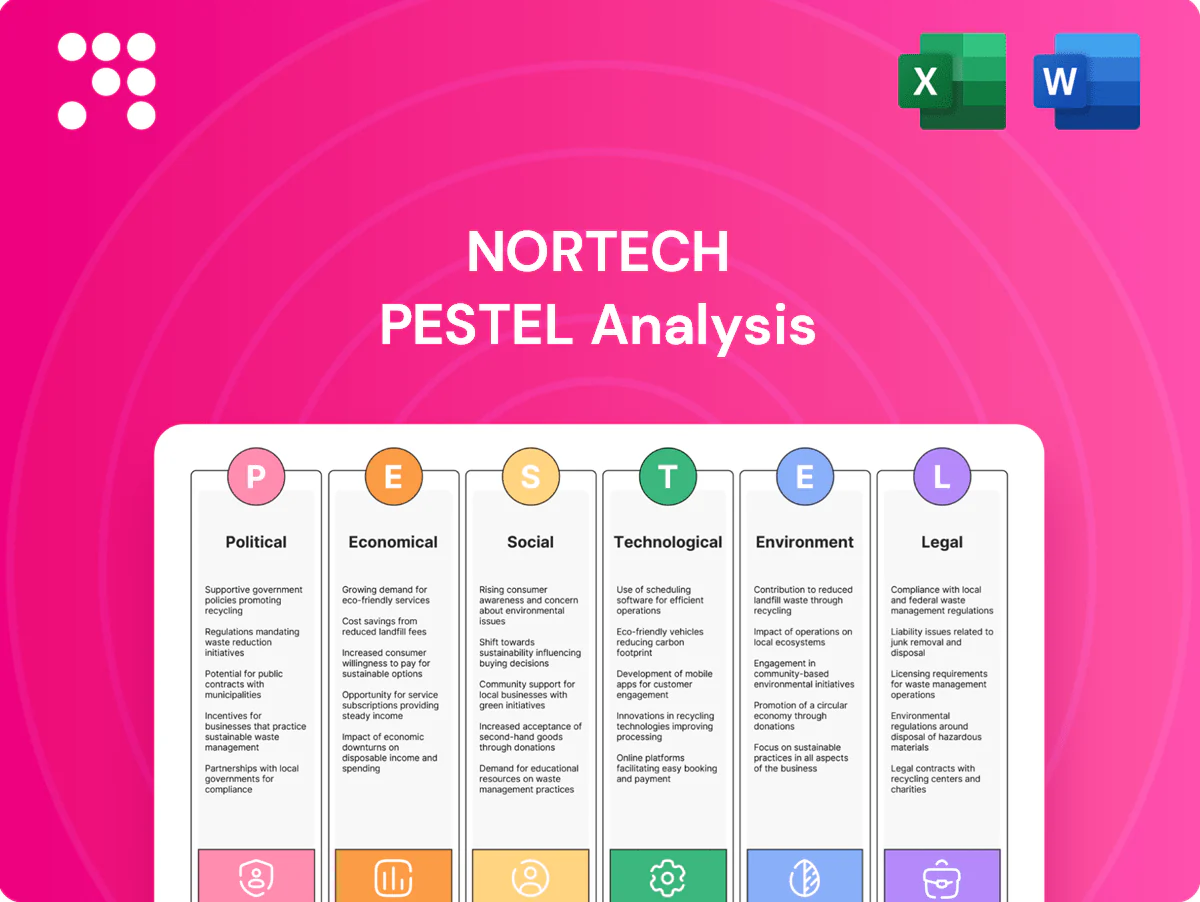
Nortech PESTLE Analysis

Skip the Research. Get the Strategy.
Unlock strategic clarity with our focused PESTLE Analysis of Nortech—three to five expert-level insights into how political, economic, social, technological, legal, and environmental forces will shape its future. Ideal for investors, consultants, and executives, this concise report highlights risks and growth levers you can act on immediately. Purchase the full analysis to access the complete, editable breakdown and make smarter decisions faster.
Political factors

US defense budgets
US defense appropriations — FY2024 defense topline roughly $858 billion — directly drive demand for Nortech’s rugged cable and electromechanical assemblies, with multi‑year DoD funding and multiyear procurement enabling backlog visibility and capacity planning. Funding cuts or continuing resolutions stall orders and cash flow, while the shift to near‑peer readiness increases demand for higher‑spec builds and expanded testing.
Trade policy and tariffs
Tariffs on electronics, wire‑harness inputs and China‑origin parts (Section 301 rates commonly 7.5–25%) have raised BOM costs—industry estimates showed component BOM uplifts of roughly 5–12% in 2022–24. US export controls on advanced semiconductors (expanded 2023–24) constrain sourcing and force redesigns. Preferential deals like USMCA can cut landed costs to near 0% for qualifying parts and shorten lead times. Sudden policy shifts require customer pricing adjustments within 30–90 days to preserve margins.

Industrial policy incentives
CHIPS Act provides $52B to boost domestic semiconductor manufacturing and the Inflation Reduction Act allocates about $369B in clean energy and manufacturing tax incentives, driving reshoring. Grants and tax credits can materially offset automation and testing-lab capex, while customers favor U.S. content to qualify for incentives. Application and compliance overheads require dedicated staffing and budget.

Geopolitical supply risk
Geopolitical shocks in Taiwan, Eastern Europe and Red Sea lanes have a direct impact on PCB and component flows: TSMC held ~92% of global sub‑5nm foundry capacity in 2024, concentrating risk, while Red Sea disruptions in 2023–24 forced reroutes that added roughly 10–14 days and pushed some liner rates up to ~40%.
- Multi‑sourcing: increased adoption across suppliers
- Buffer stocks: common target 4–12 weeks
- Customer preference: resilience premiums evident in RFQ awards
- Freight rerouting: higher cost and longer lead times
Public health preparedness
Government stockpiles and pandemic-era funding (eg CARES Act $2.2T, Operation Warp Speed ~$18B) can produce sudden spikes in device demand; EUA pathways accelerate design‑to‑build timelines but still require full compliance and documentation; post‑surge normalization risks whipsawing volumes and margin pressure.
- Stockpile funding: demand spikes
- EUA: faster timelines, same compliance
- Documentation: audit risk
- Normalization: volume volatility
FY24 US defense $858B fuels reshoring; CHIPS $52B, IRA $369B tighten supply resilience
FY2024 US defense topline ~$858B underpins demand for Nortech rugged assemblies; DoD multiyear buys improve backlog visibility but CRs/cuts risk order stalls. Tariffs (7.5–25%) and BOM uplifts (~5–12% in 2022–24) raise costs; CHIPS $52B and IRA ~$369B drive reshoring and domestic sourcing. Geopolitical shocks (TSMC ~92% sub‑5nm, Red Sea delays +10–14d, liner rates +~40%) increase lead times and resilience premiums.
| Metric | Value |
|---|---|
| US defense FY2024 | $858B |
| CHIPS | $52B |
| IRA | $369B |
| Tariff rates | 7.5–25% |
| BOM uplift | 5–12% |
What is included in the product
 Detailed Word Document
Explores how external macro-environmental factors uniquely affect the Nortech across Political, Economic, Social, Technological, Environmental and Legal dimensions, with each section backed by current data and industry-specific trends. Designed for executives, investors and consultants, it highlights threats and opportunities, offers forward-looking scenarios, and is formatted for direct inclusion in plans, decks, or reports.

 Customizable Excel Spreadsheet
A concise, visually segmented Nortech PESTLE summary that can be dropped into presentations, annotated for regional or business context, and easily shared across teams to streamline risk discussions and strategic planning.
Economic factors

Cycle sensitivity
Industrial capex cycles compress order visibility and shift product mix, leaving short-term book-to-bill swings for component suppliers. Medical demand is steadier — the global medical device market grew about 4–5% in 2024 per industry estimates — helping temper downturns. Defense is counter‑cyclical but tied to budgets; global military spending was about 2.24 trillion USD in 2023 (SIPRI). Diversification across end‑markets smooths revenue volatility.
Input cost inflation
Copper, resins and electronic components track global commodity swings — LME copper averaged about 9,500 USD/ton in 2024 while resin indices fell roughly 12% YoY and semiconductor prices declined ~15% YoY. Input cost inflation compresses Nortech margins unless contracts index pricing. Long‑term supply agreements stabilize unit costs but limit procurement agility. VMI and financial hedging have cut peak-spike exposure in industry cases by ~30%.

Labor availability
Skilled assemblers, IPC-certified technicians and test engineers remain scarce, with industry surveys in 2024 reporting that roughly half of electronics firms cite technician shortages as a top constraint; manufacturing job openings in the US stayed elevated (around 600k range in 2023–24 JOLTS data), driving wage competition that lifted skilled labor costs by mid-single digits year-over-year and pressuring Nortech’s margins and delivery windows.

FX and reshoring
Currency swings materially alter offshore sourcing economics: a roughly 6% strengthening of the US dollar in 2023 made imports relatively cheaper for US buyers but increased FX risk for exporters; McKinsey 2024 found about 70% of manufacturing executives prioritize onshoring or nearshoring to secure capacity and cut lead times. FX moves directly change imported component costs, while localized North American supply allows Nortech to command premiums tied to service SLAs and faster delivery.
- FX volatility: ~6% US dollar move (2023)
- Customer intent: ~70% execs favor onshoring/nearshoring (McKinsey 2024)
- Impact: imported component pricing fluctuates with FX
- Opportunity: localized supply justifies premium pricing via SLA-driven value
Working capital needs
Long-lead components in electronics pushed average industry lead times to about 12–20 weeks in 2024, forcing higher inventory buffers and raising inventory turns pressure; customer consignment and deposit models improved cash conversion by cutting financed inventory and trimming cash conversion cycles toward an industry median of ~50–70 days. Accurate demand forecasts reduced obsolescence rates; credit terms must balance growth and liquidity.
- Lead times: 12–20 weeks (2024)
- Inventory days: 75–90
- CCC: ~50–70 days
- Consignment/deposits: lower financed stock, faster cash conversion
FY24 US defense $858B fuels reshoring; CHIPS $52B, IRA $369B tighten supply resilience
Nortech faces cyclical capex risk with medical (+4–5% global growth in 2024) and defense (global spend ~2.24T USD in 2023) softening volatility; diversification smooths revenue. Input costs (LME copper ~9,500 USD/ton in 2024; resins -12% YoY; semiconductors -15% YoY) and 12–20 week lead times pressure margins and working capital. FX (~6% USD move in 2023) and labor shortages (US mfg openings ~600k) raise costs; VMI/hedging cut peak exposure ~30%.
| Metric | Value |
|---|---|
| Medical growth 2024 | 4–5% |
| Global military spend 2023 | 2.24T USD |
| LME copper 2024 | ~9,500 USD/ton |
| Lead times 2024 | 12–20 wks |
| US mfg openings | ~600k |
Preview the Actual Deliverable
Nortech PESTLE Analysis
The preview shown here is the exact Nortech PESTLE Analysis you’ll receive after purchase—fully formatted, professionally structured, and ready to use. No placeholders or teasers: the layout, content, and structure match the downloadable file. After checkout you’ll instantly own this final document.

Skip the Research. Get the Strategy.
Unlock strategic clarity with our focused PESTLE Analysis of Nortech—three to five expert-level insights into how political, economic, social, technological, legal, and environmental forces will shape its future. Ideal for investors, consultants, and executives, this concise report highlights risks and growth levers you can act on immediately. Purchase the full analysis to access the complete, editable breakdown and make smarter decisions faster.
Political factors
US defense budgets
US defense appropriations — FY2024 defense topline roughly $858 billion — directly drive demand for Nortech’s rugged cable and electromechanical assemblies, with multi‑year DoD funding and multiyear procurement enabling backlog visibility and capacity planning. Funding cuts or continuing resolutions stall orders and cash flow, while the shift to near‑peer readiness increases demand for higher‑spec builds and expanded testing.
Trade policy and tariffs
Tariffs on electronics, wire‑harness inputs and China‑origin parts (Section 301 rates commonly 7.5–25%) have raised BOM costs—industry estimates showed component BOM uplifts of roughly 5–12% in 2022–24. US export controls on advanced semiconductors (expanded 2023–24) constrain sourcing and force redesigns. Preferential deals like USMCA can cut landed costs to near 0% for qualifying parts and shorten lead times. Sudden policy shifts require customer pricing adjustments within 30–90 days to preserve margins.
Industrial policy incentives
CHIPS Act provides $52B to boost domestic semiconductor manufacturing and the Inflation Reduction Act allocates about $369B in clean energy and manufacturing tax incentives, driving reshoring. Grants and tax credits can materially offset automation and testing-lab capex, while customers favor U.S. content to qualify for incentives. Application and compliance overheads require dedicated staffing and budget.
Geopolitical supply risk
Geopolitical shocks in Taiwan, Eastern Europe and Red Sea lanes have a direct impact on PCB and component flows: TSMC held ~92% of global sub‑5nm foundry capacity in 2024, concentrating risk, while Red Sea disruptions in 2023–24 forced reroutes that added roughly 10–14 days and pushed some liner rates up to ~40%.
- Multi‑sourcing: increased adoption across suppliers
- Buffer stocks: common target 4–12 weeks
- Customer preference: resilience premiums evident in RFQ awards
- Freight rerouting: higher cost and longer lead times
Public health preparedness
Government stockpiles and pandemic-era funding (eg CARES Act $2.2T, Operation Warp Speed ~$18B) can produce sudden spikes in device demand; EUA pathways accelerate design‑to‑build timelines but still require full compliance and documentation; post‑surge normalization risks whipsawing volumes and margin pressure.
- Stockpile funding: demand spikes
- EUA: faster timelines, same compliance
- Documentation: audit risk
- Normalization: volume volatility
FY24 US defense $858B fuels reshoring; CHIPS $52B, IRA $369B tighten supply resilience
FY2024 US defense topline ~$858B underpins demand for Nortech rugged assemblies; DoD multiyear buys improve backlog visibility but CRs/cuts risk order stalls. Tariffs (7.5–25%) and BOM uplifts (~5–12% in 2022–24) raise costs; CHIPS $52B and IRA ~$369B drive reshoring and domestic sourcing. Geopolitical shocks (TSMC ~92% sub‑5nm, Red Sea delays +10–14d, liner rates +~40%) increase lead times and resilience premiums.
| Metric | Value |
|---|---|
| US defense FY2024 | $858B |
| CHIPS | $52B |
| IRA | $369B |
| Tariff rates | 7.5–25% |
| BOM uplift | 5–12% |
What is included in the product
Detailed Word Document
Explores how external macro-environmental factors uniquely affect the Nortech across Political, Economic, Social, Technological, Environmental and Legal dimensions, with each section backed by current data and industry-specific trends. Designed for executives, investors and consultants, it highlights threats and opportunities, offers forward-looking scenarios, and is formatted for direct inclusion in plans, decks, or reports.
Customizable Excel Spreadsheet
A concise, visually segmented Nortech PESTLE summary that can be dropped into presentations, annotated for regional or business context, and easily shared across teams to streamline risk discussions and strategic planning.
Economic factors
Cycle sensitivity
Industrial capex cycles compress order visibility and shift product mix, leaving short-term book-to-bill swings for component suppliers. Medical demand is steadier — the global medical device market grew about 4–5% in 2024 per industry estimates — helping temper downturns. Defense is counter‑cyclical but tied to budgets; global military spending was about 2.24 trillion USD in 2023 (SIPRI). Diversification across end‑markets smooths revenue volatility.
Input cost inflation
Copper, resins and electronic components track global commodity swings — LME copper averaged about 9,500 USD/ton in 2024 while resin indices fell roughly 12% YoY and semiconductor prices declined ~15% YoY. Input cost inflation compresses Nortech margins unless contracts index pricing. Long‑term supply agreements stabilize unit costs but limit procurement agility. VMI and financial hedging have cut peak-spike exposure in industry cases by ~30%.
Labor availability
Skilled assemblers, IPC-certified technicians and test engineers remain scarce, with industry surveys in 2024 reporting that roughly half of electronics firms cite technician shortages as a top constraint; manufacturing job openings in the US stayed elevated (around 600k range in 2023–24 JOLTS data), driving wage competition that lifted skilled labor costs by mid-single digits year-over-year and pressuring Nortech’s margins and delivery windows.
FX and reshoring
Currency swings materially alter offshore sourcing economics: a roughly 6% strengthening of the US dollar in 2023 made imports relatively cheaper for US buyers but increased FX risk for exporters; McKinsey 2024 found about 70% of manufacturing executives prioritize onshoring or nearshoring to secure capacity and cut lead times. FX moves directly change imported component costs, while localized North American supply allows Nortech to command premiums tied to service SLAs and faster delivery.
- FX volatility: ~6% US dollar move (2023)
- Customer intent: ~70% execs favor onshoring/nearshoring (McKinsey 2024)
- Impact: imported component pricing fluctuates with FX
- Opportunity: localized supply justifies premium pricing via SLA-driven value
Working capital needs
Long-lead components in electronics pushed average industry lead times to about 12–20 weeks in 2024, forcing higher inventory buffers and raising inventory turns pressure; customer consignment and deposit models improved cash conversion by cutting financed inventory and trimming cash conversion cycles toward an industry median of ~50–70 days. Accurate demand forecasts reduced obsolescence rates; credit terms must balance growth and liquidity.
- Lead times: 12–20 weeks (2024)
- Inventory days: 75–90
- CCC: ~50–70 days
- Consignment/deposits: lower financed stock, faster cash conversion
FY24 US defense $858B fuels reshoring; CHIPS $52B, IRA $369B tighten supply resilience
Nortech faces cyclical capex risk with medical (+4–5% global growth in 2024) and defense (global spend ~2.24T USD in 2023) softening volatility; diversification smooths revenue. Input costs (LME copper ~9,500 USD/ton in 2024; resins -12% YoY; semiconductors -15% YoY) and 12–20 week lead times pressure margins and working capital. FX (~6% USD move in 2023) and labor shortages (US mfg openings ~600k) raise costs; VMI/hedging cut peak exposure ~30%.
| Metric | Value |
|---|---|
| Medical growth 2024 | 4–5% |
| Global military spend 2023 | 2.24T USD |
| LME copper 2024 | ~9,500 USD/ton |
| Lead times 2024 | 12–20 wks |
| US mfg openings | ~600k |
Preview the Actual Deliverable
Nortech PESTLE Analysis
The preview shown here is the exact Nortech PESTLE Analysis you’ll receive after purchase—fully formatted, professionally structured, and ready to use. No placeholders or teasers: the layout, content, and structure match the downloadable file. After checkout you’ll instantly own this final document.
Description
Skip the Research. Get the Strategy.
Unlock strategic clarity with our focused PESTLE Analysis of Nortech—three to five expert-level insights into how political, economic, social, technological, legal, and environmental forces will shape its future. Ideal for investors, consultants, and executives, this concise report highlights risks and growth levers you can act on immediately. Purchase the full analysis to access the complete, editable breakdown and make smarter decisions faster.
Political factors
US defense budgets
US defense appropriations — FY2024 defense topline roughly $858 billion — directly drive demand for Nortech’s rugged cable and electromechanical assemblies, with multi‑year DoD funding and multiyear procurement enabling backlog visibility and capacity planning. Funding cuts or continuing resolutions stall orders and cash flow, while the shift to near‑peer readiness increases demand for higher‑spec builds and expanded testing.
Trade policy and tariffs
Tariffs on electronics, wire‑harness inputs and China‑origin parts (Section 301 rates commonly 7.5–25%) have raised BOM costs—industry estimates showed component BOM uplifts of roughly 5–12% in 2022–24. US export controls on advanced semiconductors (expanded 2023–24) constrain sourcing and force redesigns. Preferential deals like USMCA can cut landed costs to near 0% for qualifying parts and shorten lead times. Sudden policy shifts require customer pricing adjustments within 30–90 days to preserve margins.
Industrial policy incentives
CHIPS Act provides $52B to boost domestic semiconductor manufacturing and the Inflation Reduction Act allocates about $369B in clean energy and manufacturing tax incentives, driving reshoring. Grants and tax credits can materially offset automation and testing-lab capex, while customers favor U.S. content to qualify for incentives. Application and compliance overheads require dedicated staffing and budget.
Geopolitical supply risk
Geopolitical shocks in Taiwan, Eastern Europe and Red Sea lanes have a direct impact on PCB and component flows: TSMC held ~92% of global sub‑5nm foundry capacity in 2024, concentrating risk, while Red Sea disruptions in 2023–24 forced reroutes that added roughly 10–14 days and pushed some liner rates up to ~40%.
- Multi‑sourcing: increased adoption across suppliers
- Buffer stocks: common target 4–12 weeks
- Customer preference: resilience premiums evident in RFQ awards
- Freight rerouting: higher cost and longer lead times
Public health preparedness
Government stockpiles and pandemic-era funding (eg CARES Act $2.2T, Operation Warp Speed ~$18B) can produce sudden spikes in device demand; EUA pathways accelerate design‑to‑build timelines but still require full compliance and documentation; post‑surge normalization risks whipsawing volumes and margin pressure.
- Stockpile funding: demand spikes
- EUA: faster timelines, same compliance
- Documentation: audit risk
- Normalization: volume volatility
FY24 US defense $858B fuels reshoring; CHIPS $52B, IRA $369B tighten supply resilience
FY2024 US defense topline ~$858B underpins demand for Nortech rugged assemblies; DoD multiyear buys improve backlog visibility but CRs/cuts risk order stalls. Tariffs (7.5–25%) and BOM uplifts (~5–12% in 2022–24) raise costs; CHIPS $52B and IRA ~$369B drive reshoring and domestic sourcing. Geopolitical shocks (TSMC ~92% sub‑5nm, Red Sea delays +10–14d, liner rates +~40%) increase lead times and resilience premiums.
| Metric | Value |
|---|---|
| US defense FY2024 | $858B |
| CHIPS | $52B |
| IRA | $369B |
| Tariff rates | 7.5–25% |
| BOM uplift | 5–12% |
What is included in the product
Detailed Word Document
Explores how external macro-environmental factors uniquely affect the Nortech across Political, Economic, Social, Technological, Environmental and Legal dimensions, with each section backed by current data and industry-specific trends. Designed for executives, investors and consultants, it highlights threats and opportunities, offers forward-looking scenarios, and is formatted for direct inclusion in plans, decks, or reports.
Customizable Excel Spreadsheet
A concise, visually segmented Nortech PESTLE summary that can be dropped into presentations, annotated for regional or business context, and easily shared across teams to streamline risk discussions and strategic planning.
Economic factors
Cycle sensitivity
Industrial capex cycles compress order visibility and shift product mix, leaving short-term book-to-bill swings for component suppliers. Medical demand is steadier — the global medical device market grew about 4–5% in 2024 per industry estimates — helping temper downturns. Defense is counter‑cyclical but tied to budgets; global military spending was about 2.24 trillion USD in 2023 (SIPRI). Diversification across end‑markets smooths revenue volatility.
Input cost inflation
Copper, resins and electronic components track global commodity swings — LME copper averaged about 9,500 USD/ton in 2024 while resin indices fell roughly 12% YoY and semiconductor prices declined ~15% YoY. Input cost inflation compresses Nortech margins unless contracts index pricing. Long‑term supply agreements stabilize unit costs but limit procurement agility. VMI and financial hedging have cut peak-spike exposure in industry cases by ~30%.
Labor availability
Skilled assemblers, IPC-certified technicians and test engineers remain scarce, with industry surveys in 2024 reporting that roughly half of electronics firms cite technician shortages as a top constraint; manufacturing job openings in the US stayed elevated (around 600k range in 2023–24 JOLTS data), driving wage competition that lifted skilled labor costs by mid-single digits year-over-year and pressuring Nortech’s margins and delivery windows.
FX and reshoring
Currency swings materially alter offshore sourcing economics: a roughly 6% strengthening of the US dollar in 2023 made imports relatively cheaper for US buyers but increased FX risk for exporters; McKinsey 2024 found about 70% of manufacturing executives prioritize onshoring or nearshoring to secure capacity and cut lead times. FX moves directly change imported component costs, while localized North American supply allows Nortech to command premiums tied to service SLAs and faster delivery.
- FX volatility: ~6% US dollar move (2023)
- Customer intent: ~70% execs favor onshoring/nearshoring (McKinsey 2024)
- Impact: imported component pricing fluctuates with FX
- Opportunity: localized supply justifies premium pricing via SLA-driven value
Working capital needs
Long-lead components in electronics pushed average industry lead times to about 12–20 weeks in 2024, forcing higher inventory buffers and raising inventory turns pressure; customer consignment and deposit models improved cash conversion by cutting financed inventory and trimming cash conversion cycles toward an industry median of ~50–70 days. Accurate demand forecasts reduced obsolescence rates; credit terms must balance growth and liquidity.
- Lead times: 12–20 weeks (2024)
- Inventory days: 75–90
- CCC: ~50–70 days
- Consignment/deposits: lower financed stock, faster cash conversion
FY24 US defense $858B fuels reshoring; CHIPS $52B, IRA $369B tighten supply resilience
Nortech faces cyclical capex risk with medical (+4–5% global growth in 2024) and defense (global spend ~2.24T USD in 2023) softening volatility; diversification smooths revenue. Input costs (LME copper ~9,500 USD/ton in 2024; resins -12% YoY; semiconductors -15% YoY) and 12–20 week lead times pressure margins and working capital. FX (~6% USD move in 2023) and labor shortages (US mfg openings ~600k) raise costs; VMI/hedging cut peak exposure ~30%.
| Metric | Value |
|---|---|
| Medical growth 2024 | 4–5% |
| Global military spend 2023 | 2.24T USD |
| LME copper 2024 | ~9,500 USD/ton |
| Lead times 2024 | 12–20 wks |
| US mfg openings | ~600k |
Preview the Actual Deliverable
Nortech PESTLE Analysis
The preview shown here is the exact Nortech PESTLE Analysis you’ll receive after purchase—fully formatted, professionally structured, and ready to use. No placeholders or teasers: the layout, content, and structure match the downloadable file. After checkout you’ll instantly own this final document.











