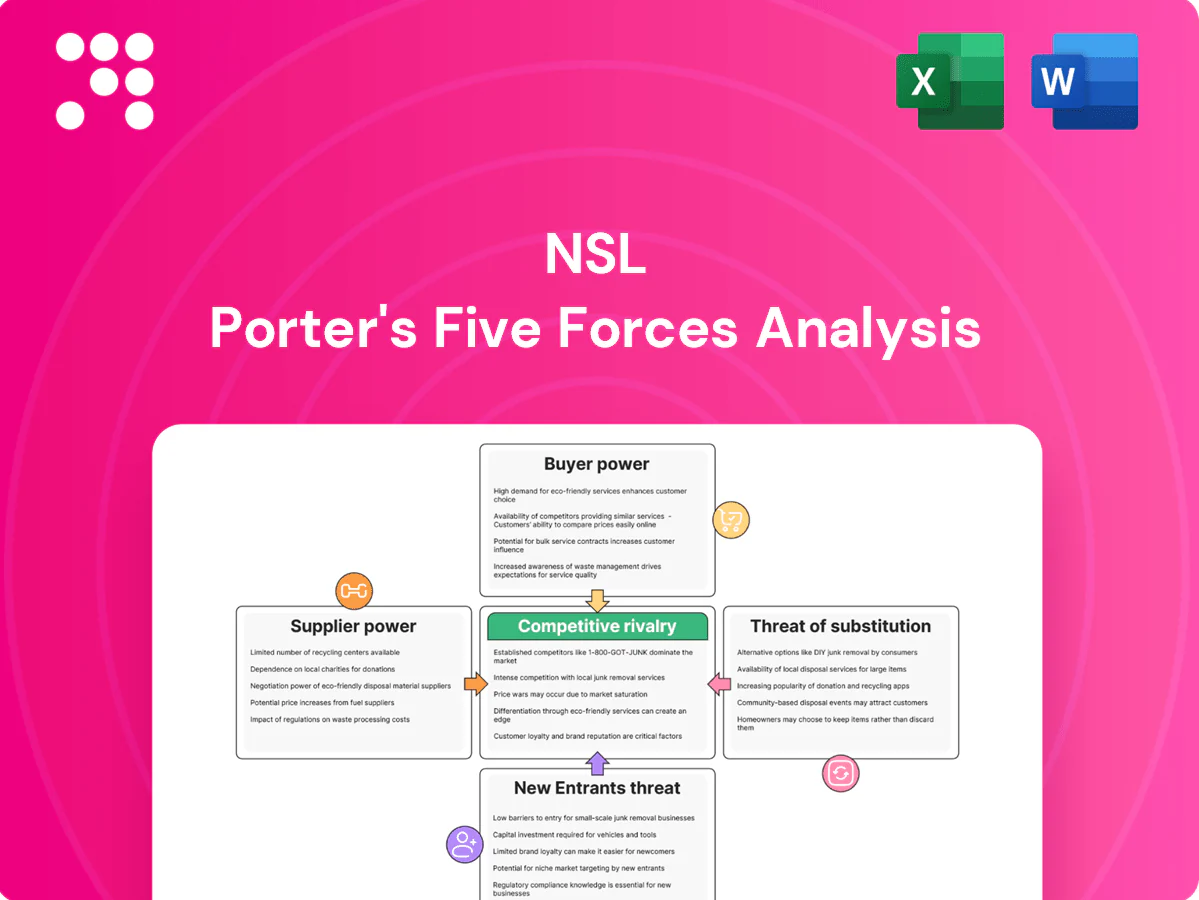
NSL Porter's Five Forces Analysis

Don't Miss the Bigger Picture
NSL’s Porter's Five Forces snapshot highlights competitive intensity, supplier and buyer leverage, threat of entrants, and substitute risks, revealing where margins and strategic vulnerabilities lie. This brief overview hints at critical market pressures and advantage points. Unlock the full Porter's Five Forces Analysis for force-by-force ratings, visuals, and actionable strategy to guide investment or management decisions.
Suppliers Bargaining Power

Concentrated inputs for cement, steel, and polymers
Core inputs—cement (global production ~4.1bn t in 2023-24), crude steel (~1.9bn t in 2023) and polymers (plastics production ~390Mt in 2022)—are sourced from concentrated supplier bases, giving key producers pricing power. Commodity-driven price swings (often tens of percent year-on-year) can be passed to NSL absent indexation in contracts. Multi-region sourcing reduces risk but logistics, tariffs and lead times limit rapid switching; long-term framework agreements cap spikes yet constrain short-term flexibility.
Specialized molds, MEP fixtures, and chemicals
Precast bathroom units need bespoke molds, admixtures, sealants and MEP fixtures that are not interchangeable, raising switching costs as qualification and testing typically take several months; approved-vendor lists on projects can cut supplier options by more than half. In 2024 the global precast concrete market exceeded $90 billion, supporting niche suppliers' ability to sustain moderate bargaining power and command 5–10% price premiums on specialized components.

Equipment and maintenance dependency
Heavy lifting, curing, and batching equipment tie NSL to OEMs for spare parts and maintenance, concentrating supplier power and elevating service-contract premiums as downtime risks hit operations; industry analyses in 2024 show predictive-maintenance adoption can cut unplanned downtime by up to 50%. Multi-vendor parts strategies and condition-based monitoring reduce exposure and spare lead times, but OEM intellectual property and warranty constraints continue to limit third-party servicing options.

Energy and logistics cost pass-through
Energy and transportation are major input costs in precast and environmental operations; fuel and electricity volatility can erode margins if not hedged. Brent averaged about $85/bbl in 2024 and industrial electricity costs rose sharply in several regions, strengthening supplier leverage. Regional plants cut haulage but cannot fully offset cross-border freight and peak-season constraints, raising supplier power during shocks.
- Fuel exposure: Brent ~85$/bbl (2024)
- Electricity: notable YoY rises (~2024)
- Regional plants reduce but do not eliminate freight risk
- Supplier power spikes in energy shocks and peak shipping
Regulatory and sustainability compliance
Regulatory and sustainability compliance raises supplier power as mandates for low-carbon cement, recycled aggregates and certified inputs tighten procurement; shortages in compliant supply drove price premia of up to 15% and extended lead times in 2024. Traceability and EPD requirements concentrate demand on vendors that can certify carbon and material provenance, increasing dependence on a small pool of compliant suppliers. For NSL, this shifts bargaining leverage toward green-material suppliers, raising procurement risk and margin pressure.
- 2024 price premia: up to 15%
- Compliant-supplier concentration: higher traceability needs
- Lead-time impact: longer procurement cycles
Suppliers gain leverage; energy shortages raise 5–15% premia
Suppliers hold moderate-to-high power: concentrated commodity producers (cement 4.1bn t 2023-24, steel 1.9bn t 2023) and niche precast vendors (market >$90bn in 2024) can sustain price premiums (5–15%) and restrict switching. Energy volatility (Brent ~85$/bbl in 2024) and compliance-driven green supply shortages raise costs and procurement lead times.
| Factor | 2024 metric | Impact |
|---|---|---|
| Cement supply | 4.1bn t | Pricing power |
| Precast market | >$90bn | Niche supplier premiums 5–10% |
| Brent | ~85$/bbl | Higher energy costs |
| Green premia | up to 15% | Procurement strain |
What is included in the product
 Detailed Word Document
Comprehensive Porter's Five Forces analysis tailored to NSL that uncovers key competitive drivers, supplier and buyer power, entry barriers, substitute threats and disruptive risks, with strategic commentary for investor materials, business plans or internal strategy decks and fully editable for easy customization.

 Customizable Excel Spreadsheet
A concise one-sheet NSL Porter's Five Forces summary that clarifies competitive pressures for quick decision-making; customize force intensities with new data or scenarios. Includes an instant spider/radar chart and clean layout ready for pitch decks or dashboards.
Customers Bargaining Power

Large contractors and developers aggregate demand
Tier-1 builders, EPCs and developers buy at scale and run competitive tenders, often aggregating multi-project volumes that can exceed $100 million annually, which strengthens their leverage over suppliers. Their ability to bundle projects lets them demand price breaks, performance bonds and liquidated damages, pressuring margins. Preferred-supplier status improves win rates for NSL but typically comes with tighter pricing and higher contractual risk.
Government and infrastructure clients
Government and infrastructure clients prioritize compliance, lowest evaluated cost and delivery certainty; public procurement equals about 12% of GDP globally (World Bank 2024). Rigorous specs, prequalification gates that typically narrow fields to 3–5 bidders and median payment terms around 90 days (2024) concentrate price pressure among approved vendors. Change orders and milestone-linked payments, often 5–10% of contract value, heighten cash-flow risk.

Switching across alternative construction methods
Buyers can switch from precast/PBU to cast-in-situ or other modular options when schedules and designs allow, and modular approaches can cut delivery time by up to 50%. Design lock-in and BIM integration constrain mid‑project switching but do not prevent pre‑award swaps. Value engineering cycles frequently trigger re‑bids and substitutions during early procurement. This dynamic boosts buyer power at early design stages.

Demand cyclicality and project timing
Cycles in property and infrastructure skew capacity utilization, pushing NSL customers to demand discounts in downturns when industry capacity outstrips projects; conversely, booms compress available slots and shift bargaining power back toward suppliers and contractors. NSL’s diversified regional footprint moderates but cannot eliminate these timing-driven swings, leaving customer leverage highly cyclical through project pipelines.
- Customers gain leverage in downturns due to excess capacity
- Booms create supplier advantage from constrained slots
- NSL diversification smooths but does not remove timing risk
Quality, warranty, and ESG expectations
Buyers now require tight tolerances, onsite support, and extended warranties for PBUs and environmental systems, while ESG mandates push low-carbon materials and waste-reduction clauses with measurable KPIs; non-compliance penalties increase buyer leverage, though differentiated performance data can partially offset price pressure.
- Common warranty requests: 5–10 years
- ESG clauses include CO2 intensity and waste targets
- Penalties: contract deductions or liquidated damages
- Performance data reduces price sensitivity
Tier-1 buyers run >$100m aggregated tenders; public procurement ~12% GDP
Large tier‑1 buyers run aggregated tenders (> $100m), public procurement ~12% of GDP (World Bank 2024), median payment terms ~90 days (2024); change orders commonly 5–10% of contract and warranties 5–10 years. Modular options can cut delivery time by up to 50%, boosting buyer leverage early in design.
| Metric | Value |
|---|---|
| Typical aggregated tender | > $100m |
| Public procurement share | ~12% GDP (2024) |
| Payment terms | ~90 days (2024) |
| Change orders | 5–10% contract |
| Warranty | 5–10 years |
| Modular time saving | Up to 50% |
Same Document Delivered
NSL Porter's Five Forces Analysis
This preview shows the exact NSL Porter's Five Forces Analysis you'll receive immediately after purchase—no placeholders or samples. The document displayed is fully formatted, professionally written, and ready for download and use the moment you buy. You're viewing the final deliverable; purchase grants instant access to this same file.

Don't Miss the Bigger Picture
NSL’s Porter's Five Forces snapshot highlights competitive intensity, supplier and buyer leverage, threat of entrants, and substitute risks, revealing where margins and strategic vulnerabilities lie. This brief overview hints at critical market pressures and advantage points. Unlock the full Porter's Five Forces Analysis for force-by-force ratings, visuals, and actionable strategy to guide investment or management decisions.
Suppliers Bargaining Power
Concentrated inputs for cement, steel, and polymers
Core inputs—cement (global production ~4.1bn t in 2023-24), crude steel (~1.9bn t in 2023) and polymers (plastics production ~390Mt in 2022)—are sourced from concentrated supplier bases, giving key producers pricing power. Commodity-driven price swings (often tens of percent year-on-year) can be passed to NSL absent indexation in contracts. Multi-region sourcing reduces risk but logistics, tariffs and lead times limit rapid switching; long-term framework agreements cap spikes yet constrain short-term flexibility.
Specialized molds, MEP fixtures, and chemicals
Precast bathroom units need bespoke molds, admixtures, sealants and MEP fixtures that are not interchangeable, raising switching costs as qualification and testing typically take several months; approved-vendor lists on projects can cut supplier options by more than half. In 2024 the global precast concrete market exceeded $90 billion, supporting niche suppliers' ability to sustain moderate bargaining power and command 5–10% price premiums on specialized components.
Equipment and maintenance dependency
Heavy lifting, curing, and batching equipment tie NSL to OEMs for spare parts and maintenance, concentrating supplier power and elevating service-contract premiums as downtime risks hit operations; industry analyses in 2024 show predictive-maintenance adoption can cut unplanned downtime by up to 50%. Multi-vendor parts strategies and condition-based monitoring reduce exposure and spare lead times, but OEM intellectual property and warranty constraints continue to limit third-party servicing options.
Energy and logistics cost pass-through
Energy and transportation are major input costs in precast and environmental operations; fuel and electricity volatility can erode margins if not hedged. Brent averaged about $85/bbl in 2024 and industrial electricity costs rose sharply in several regions, strengthening supplier leverage. Regional plants cut haulage but cannot fully offset cross-border freight and peak-season constraints, raising supplier power during shocks.
- Fuel exposure: Brent ~85$/bbl (2024)
- Electricity: notable YoY rises (~2024)
- Regional plants reduce but do not eliminate freight risk
- Supplier power spikes in energy shocks and peak shipping
Regulatory and sustainability compliance
Regulatory and sustainability compliance raises supplier power as mandates for low-carbon cement, recycled aggregates and certified inputs tighten procurement; shortages in compliant supply drove price premia of up to 15% and extended lead times in 2024. Traceability and EPD requirements concentrate demand on vendors that can certify carbon and material provenance, increasing dependence on a small pool of compliant suppliers. For NSL, this shifts bargaining leverage toward green-material suppliers, raising procurement risk and margin pressure.
- 2024 price premia: up to 15%
- Compliant-supplier concentration: higher traceability needs
- Lead-time impact: longer procurement cycles
Suppliers gain leverage; energy shortages raise 5–15% premia
Suppliers hold moderate-to-high power: concentrated commodity producers (cement 4.1bn t 2023-24, steel 1.9bn t 2023) and niche precast vendors (market >$90bn in 2024) can sustain price premiums (5–15%) and restrict switching. Energy volatility (Brent ~85$/bbl in 2024) and compliance-driven green supply shortages raise costs and procurement lead times.
| Factor | 2024 metric | Impact |
|---|---|---|
| Cement supply | 4.1bn t | Pricing power |
| Precast market | >$90bn | Niche supplier premiums 5–10% |
| Brent | ~85$/bbl | Higher energy costs |
| Green premia | up to 15% | Procurement strain |
What is included in the product
Detailed Word Document
Comprehensive Porter's Five Forces analysis tailored to NSL that uncovers key competitive drivers, supplier and buyer power, entry barriers, substitute threats and disruptive risks, with strategic commentary for investor materials, business plans or internal strategy decks and fully editable for easy customization.
Customizable Excel Spreadsheet
A concise one-sheet NSL Porter's Five Forces summary that clarifies competitive pressures for quick decision-making; customize force intensities with new data or scenarios. Includes an instant spider/radar chart and clean layout ready for pitch decks or dashboards.
Customers Bargaining Power
Large contractors and developers aggregate demand
Tier-1 builders, EPCs and developers buy at scale and run competitive tenders, often aggregating multi-project volumes that can exceed $100 million annually, which strengthens their leverage over suppliers. Their ability to bundle projects lets them demand price breaks, performance bonds and liquidated damages, pressuring margins. Preferred-supplier status improves win rates for NSL but typically comes with tighter pricing and higher contractual risk.
Government and infrastructure clients
Government and infrastructure clients prioritize compliance, lowest evaluated cost and delivery certainty; public procurement equals about 12% of GDP globally (World Bank 2024). Rigorous specs, prequalification gates that typically narrow fields to 3–5 bidders and median payment terms around 90 days (2024) concentrate price pressure among approved vendors. Change orders and milestone-linked payments, often 5–10% of contract value, heighten cash-flow risk.
Switching across alternative construction methods
Buyers can switch from precast/PBU to cast-in-situ or other modular options when schedules and designs allow, and modular approaches can cut delivery time by up to 50%. Design lock-in and BIM integration constrain mid‑project switching but do not prevent pre‑award swaps. Value engineering cycles frequently trigger re‑bids and substitutions during early procurement. This dynamic boosts buyer power at early design stages.
Demand cyclicality and project timing
Cycles in property and infrastructure skew capacity utilization, pushing NSL customers to demand discounts in downturns when industry capacity outstrips projects; conversely, booms compress available slots and shift bargaining power back toward suppliers and contractors. NSL’s diversified regional footprint moderates but cannot eliminate these timing-driven swings, leaving customer leverage highly cyclical through project pipelines.
- Customers gain leverage in downturns due to excess capacity
- Booms create supplier advantage from constrained slots
- NSL diversification smooths but does not remove timing risk
Quality, warranty, and ESG expectations
Buyers now require tight tolerances, onsite support, and extended warranties for PBUs and environmental systems, while ESG mandates push low-carbon materials and waste-reduction clauses with measurable KPIs; non-compliance penalties increase buyer leverage, though differentiated performance data can partially offset price pressure.
- Common warranty requests: 5–10 years
- ESG clauses include CO2 intensity and waste targets
- Penalties: contract deductions or liquidated damages
- Performance data reduces price sensitivity
Tier-1 buyers run >$100m aggregated tenders; public procurement ~12% GDP
Large tier‑1 buyers run aggregated tenders (> $100m), public procurement ~12% of GDP (World Bank 2024), median payment terms ~90 days (2024); change orders commonly 5–10% of contract and warranties 5–10 years. Modular options can cut delivery time by up to 50%, boosting buyer leverage early in design.
| Metric | Value |
|---|---|
| Typical aggregated tender | > $100m |
| Public procurement share | ~12% GDP (2024) |
| Payment terms | ~90 days (2024) |
| Change orders | 5–10% contract |
| Warranty | 5–10 years |
| Modular time saving | Up to 50% |
Same Document Delivered
NSL Porter's Five Forces Analysis
This preview shows the exact NSL Porter's Five Forces Analysis you'll receive immediately after purchase—no placeholders or samples. The document displayed is fully formatted, professionally written, and ready for download and use the moment you buy. You're viewing the final deliverable; purchase grants instant access to this same file.
Original: $10.00
-65%$10.00
$3.50Description
Don't Miss the Bigger Picture
NSL’s Porter's Five Forces snapshot highlights competitive intensity, supplier and buyer leverage, threat of entrants, and substitute risks, revealing where margins and strategic vulnerabilities lie. This brief overview hints at critical market pressures and advantage points. Unlock the full Porter's Five Forces Analysis for force-by-force ratings, visuals, and actionable strategy to guide investment or management decisions.
Suppliers Bargaining Power
Concentrated inputs for cement, steel, and polymers
Core inputs—cement (global production ~4.1bn t in 2023-24), crude steel (~1.9bn t in 2023) and polymers (plastics production ~390Mt in 2022)—are sourced from concentrated supplier bases, giving key producers pricing power. Commodity-driven price swings (often tens of percent year-on-year) can be passed to NSL absent indexation in contracts. Multi-region sourcing reduces risk but logistics, tariffs and lead times limit rapid switching; long-term framework agreements cap spikes yet constrain short-term flexibility.
Specialized molds, MEP fixtures, and chemicals
Precast bathroom units need bespoke molds, admixtures, sealants and MEP fixtures that are not interchangeable, raising switching costs as qualification and testing typically take several months; approved-vendor lists on projects can cut supplier options by more than half. In 2024 the global precast concrete market exceeded $90 billion, supporting niche suppliers' ability to sustain moderate bargaining power and command 5–10% price premiums on specialized components.
Equipment and maintenance dependency
Heavy lifting, curing, and batching equipment tie NSL to OEMs for spare parts and maintenance, concentrating supplier power and elevating service-contract premiums as downtime risks hit operations; industry analyses in 2024 show predictive-maintenance adoption can cut unplanned downtime by up to 50%. Multi-vendor parts strategies and condition-based monitoring reduce exposure and spare lead times, but OEM intellectual property and warranty constraints continue to limit third-party servicing options.
Energy and logistics cost pass-through
Energy and transportation are major input costs in precast and environmental operations; fuel and electricity volatility can erode margins if not hedged. Brent averaged about $85/bbl in 2024 and industrial electricity costs rose sharply in several regions, strengthening supplier leverage. Regional plants cut haulage but cannot fully offset cross-border freight and peak-season constraints, raising supplier power during shocks.
- Fuel exposure: Brent ~85$/bbl (2024)
- Electricity: notable YoY rises (~2024)
- Regional plants reduce but do not eliminate freight risk
- Supplier power spikes in energy shocks and peak shipping
Regulatory and sustainability compliance
Regulatory and sustainability compliance raises supplier power as mandates for low-carbon cement, recycled aggregates and certified inputs tighten procurement; shortages in compliant supply drove price premia of up to 15% and extended lead times in 2024. Traceability and EPD requirements concentrate demand on vendors that can certify carbon and material provenance, increasing dependence on a small pool of compliant suppliers. For NSL, this shifts bargaining leverage toward green-material suppliers, raising procurement risk and margin pressure.
- 2024 price premia: up to 15%
- Compliant-supplier concentration: higher traceability needs
- Lead-time impact: longer procurement cycles
Suppliers gain leverage; energy shortages raise 5–15% premia
Suppliers hold moderate-to-high power: concentrated commodity producers (cement 4.1bn t 2023-24, steel 1.9bn t 2023) and niche precast vendors (market >$90bn in 2024) can sustain price premiums (5–15%) and restrict switching. Energy volatility (Brent ~85$/bbl in 2024) and compliance-driven green supply shortages raise costs and procurement lead times.
| Factor | 2024 metric | Impact |
|---|---|---|
| Cement supply | 4.1bn t | Pricing power |
| Precast market | >$90bn | Niche supplier premiums 5–10% |
| Brent | ~85$/bbl | Higher energy costs |
| Green premia | up to 15% | Procurement strain |
What is included in the product
Detailed Word Document
Comprehensive Porter's Five Forces analysis tailored to NSL that uncovers key competitive drivers, supplier and buyer power, entry barriers, substitute threats and disruptive risks, with strategic commentary for investor materials, business plans or internal strategy decks and fully editable for easy customization.
Customizable Excel Spreadsheet
A concise one-sheet NSL Porter's Five Forces summary that clarifies competitive pressures for quick decision-making; customize force intensities with new data or scenarios. Includes an instant spider/radar chart and clean layout ready for pitch decks or dashboards.
Customers Bargaining Power
Large contractors and developers aggregate demand
Tier-1 builders, EPCs and developers buy at scale and run competitive tenders, often aggregating multi-project volumes that can exceed $100 million annually, which strengthens their leverage over suppliers. Their ability to bundle projects lets them demand price breaks, performance bonds and liquidated damages, pressuring margins. Preferred-supplier status improves win rates for NSL but typically comes with tighter pricing and higher contractual risk.
Government and infrastructure clients
Government and infrastructure clients prioritize compliance, lowest evaluated cost and delivery certainty; public procurement equals about 12% of GDP globally (World Bank 2024). Rigorous specs, prequalification gates that typically narrow fields to 3–5 bidders and median payment terms around 90 days (2024) concentrate price pressure among approved vendors. Change orders and milestone-linked payments, often 5–10% of contract value, heighten cash-flow risk.
Switching across alternative construction methods
Buyers can switch from precast/PBU to cast-in-situ or other modular options when schedules and designs allow, and modular approaches can cut delivery time by up to 50%. Design lock-in and BIM integration constrain mid‑project switching but do not prevent pre‑award swaps. Value engineering cycles frequently trigger re‑bids and substitutions during early procurement. This dynamic boosts buyer power at early design stages.
Demand cyclicality and project timing
Cycles in property and infrastructure skew capacity utilization, pushing NSL customers to demand discounts in downturns when industry capacity outstrips projects; conversely, booms compress available slots and shift bargaining power back toward suppliers and contractors. NSL’s diversified regional footprint moderates but cannot eliminate these timing-driven swings, leaving customer leverage highly cyclical through project pipelines.
- Customers gain leverage in downturns due to excess capacity
- Booms create supplier advantage from constrained slots
- NSL diversification smooths but does not remove timing risk
Quality, warranty, and ESG expectations
Buyers now require tight tolerances, onsite support, and extended warranties for PBUs and environmental systems, while ESG mandates push low-carbon materials and waste-reduction clauses with measurable KPIs; non-compliance penalties increase buyer leverage, though differentiated performance data can partially offset price pressure.
- Common warranty requests: 5–10 years
- ESG clauses include CO2 intensity and waste targets
- Penalties: contract deductions or liquidated damages
- Performance data reduces price sensitivity
Tier-1 buyers run >$100m aggregated tenders; public procurement ~12% GDP
Large tier‑1 buyers run aggregated tenders (> $100m), public procurement ~12% of GDP (World Bank 2024), median payment terms ~90 days (2024); change orders commonly 5–10% of contract and warranties 5–10 years. Modular options can cut delivery time by up to 50%, boosting buyer leverage early in design.
| Metric | Value |
|---|---|
| Typical aggregated tender | > $100m |
| Public procurement share | ~12% GDP (2024) |
| Payment terms | ~90 days (2024) |
| Change orders | 5–10% contract |
| Warranty | 5–10 years |
| Modular time saving | Up to 50% |
Same Document Delivered
NSL Porter's Five Forces Analysis
This preview shows the exact NSL Porter's Five Forces Analysis you'll receive immediately after purchase—no placeholders or samples. The document displayed is fully formatted, professionally written, and ready for download and use the moment you buy. You're viewing the final deliverable; purchase grants instant access to this same file.











