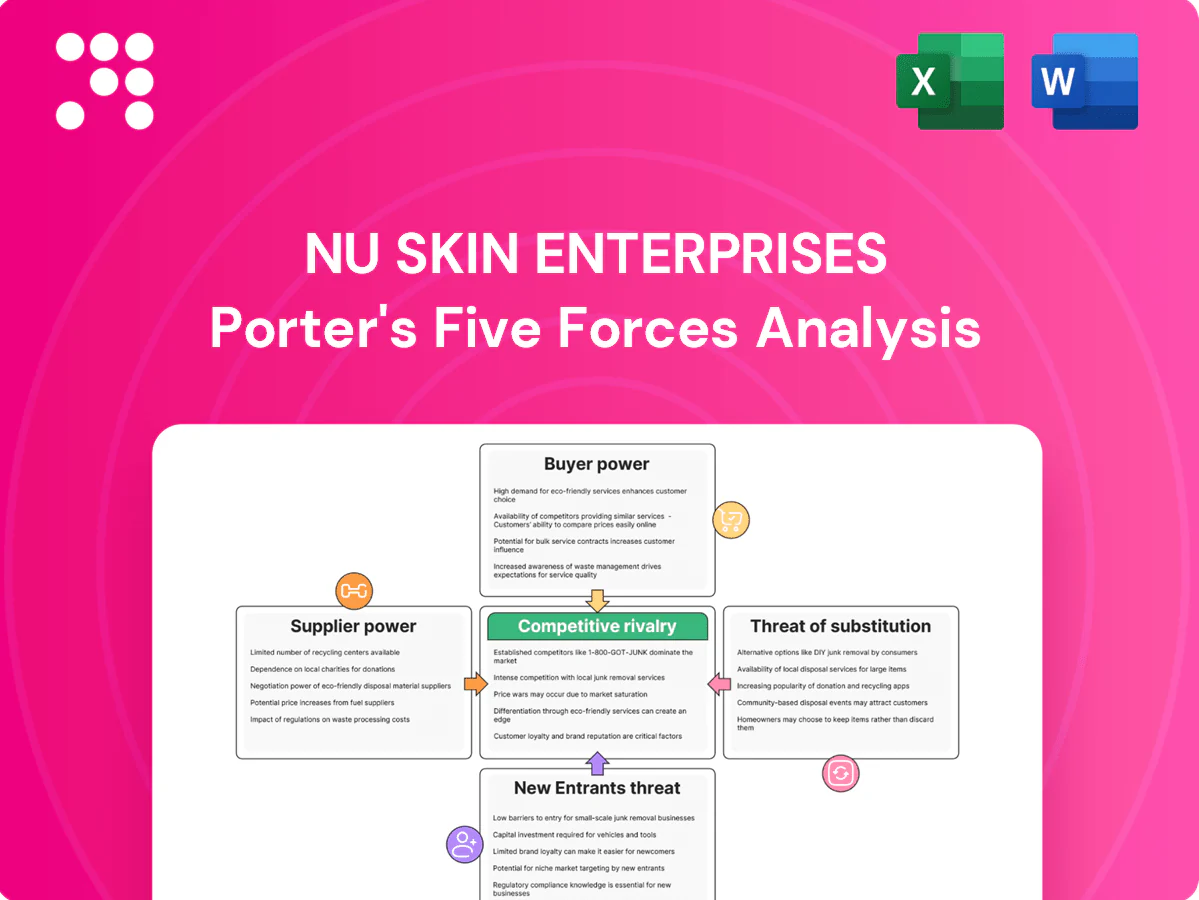
Nu Skin Enterprises Porter's Five Forces Analysis

Elevate Your Analysis with the Complete Porter's Five Forces Analysis
Nu Skin Enterprises faces intense competitive rivalry, evolving buyer preferences, and moderate supplier leverage as network-driven distribution and regulatory shifts reshape margins. This snapshot highlights substitute risks and entry barriers but omits detailed force-by-force ratings, market data, and strategic implications. This brief snapshot only scratches the surface. Unlock the full Porter's Five Forces Analysis to explore Nu Skin Enterprises’s competitive dynamics, market pressures, and strategic advantages in detail.
Suppliers Bargaining Power

Dependence on specialty actives
Nu Skin’s anti-aging and wellness formulas depend on science-backed, often patented actives sourced from a narrow set of biotech and nutraceutical suppliers, concentrating supplier leverage on price and availability. Replacing these inputs forces costly reformulation, revalidation, and regulatory filings, extending time-to-market and raising quality and compliance risk. This supplier concentration thus strengthens supplier bargaining power over Nu Skin.
Contract manufacturing capacity
Nu Skin relies heavily on third-party GMP contract manufacturers for skincare and supplements, and finite certified capacity concentrates supplier bargaining power. Certifications such as NSF and ISO create entry barriers for additional capacity, tightening negotiating leverage. Sudden demand spikes or compliance events can trigger premium pricing and extended lead times; Nu Skin reported roughly $2.0 billion in net sales in 2023, amplifying exposure. Dual-sourcing reduces risk but increases costs and supply-chain complexity.

Packaging and logistics constraints
Airless pumps, specialty jars and sustainable substrates are concentrated among a small set of capable vendors, giving those suppliers leverage over pricing and capacity. High minimum order quantities and bespoke molds raise switching costs and extend redesign lead times. Freight volatility and regional disruptions can amplify supplier influence, and component delays directly disrupt Nu Skin launch schedules and distributor inventories.

Commodity input volatility
Commodity inputs for Nu Skin—oils, botanicals, vitamins and sweeteners—remained volatile in 2024, linked to crop yields, energy and FX swings, allowing suppliers to pass through cost hikes and compress margins.
Hedging and forward buys mitigate but do not eliminate spike exposure; reformulating to cheaper inputs risks product efficacy and brand equity.
- 2024: sustained input volatility
- Supplier pass-through pressure on margins
- Hedging partial protection
- Reformulation risks brand
Regulatory and quality compliance
Suppliers that clear stringent market-by-market standards in the U.S., EU and China are scarcer and more valuable, and in 2024 their audit histories and documentation materially control Nu Skin approval timelines. Audit backlogs in 2024 lengthened qualification cycles and increased switching costs. Non-compliance exposures elevate reliance on proven partners, forming a compliance moat that strengthens supplier bargaining power.
- Scarcity: compliant suppliers concentrated across U.S./EU/China
- Time-to-approve: 2024 audits extended qualification cycles
- Risk: non-compliance raises dependence on vetted partners
Concentrated biotech actives and GMP CMOs create supplier leverage, raising reformulation risk
Nu Skin faces high supplier bargaining power from concentrated biotech actives, packaging vendors and GMP CMOs; replacing inputs forces costly reformulation and compliance risk. 2023 net sales were $2.0 billion, amplifying exposure; 2024 showed sustained input volatility and audit backlogs that lengthened qualification cycles. Hedging and dual-sourcing reduce but do not eliminate leverage.
| Metric | Value |
|---|---|
| 2023 net sales | $2.0 billion |
| 2024 input volatility | sustained |
| Supplier concentration | high |
| Audit delays 2024 | increased |
What is included in the product
 Detailed Word Document
Tailored Porter's Five Forces analysis for Nu Skin Enterprises uncovering key drivers of competition, buyer and supplier influence, and barriers to entry; evaluates substitutes and emerging disruptors that threaten market share, with strategic insights to inform pricing, profitability, and defensive positioning.

 Customizable Excel Spreadsheet
A concise Porter's Five Forces snapshot tailored to Nu Skin Enterprises—quickly highlights supplier/customer leverage, substitute and entrant threats, and competitive rivalry to relieve strategic uncertainty and accelerate boardroom decisions.
Customers Bargaining Power

Abundant product alternatives
Consumers can switch easily among mass, prestige, indie and pharmacy brands, and skincare/supplement categories have low switching costs plus frequent promotions, driving trial and churn; Nu Skin reported $3.3 billion revenue in 2024 amid this competitive mix. Reviews and influencers accelerate product trials and broaden consideration sets, intensifying buyer price sensitivity and pressuring margins.
Distributor expectations and churn
Nu Skin’s quasi-customers—about 585,000 active distributors as of 2024—depend on product appeal and margins for income, so any sell-through weakness drove higher churn in 2024 and pushed recruitment costs up; 2024 net sales were roughly $2.7 billion. Distributors can shift to rival MLMs with similar catalogs, increasing leverage to demand competitive compensation plans and enhanced marketing support.

Price transparency online
Online marketplaces reveal price benchmarks and gray-market discounts often running 20–30%, shrinking perceived value of Nu Skin MSRP and increasing customer bargaining leverage.
Buyers resist MSRP when similar benefits appear cheaper elsewhere; studies in 2024 showed roughly 70–75% of beauty buyers compare prices online before purchase, pressuring margins.
Auto-ship discounts must offset perceived premiums—auto-ship (≈30% of sales) needs aggressive pricing or loyalty incentives as transparency compresses pricing power.

Performance proof and claims
Customers now demand clinical proof, clean-label ingredients and visible results before purchase; educated buyers widely scrutinize ingredient lists and peer-reviewed studies, raising acquisition costs and churn risk for Nu Skin.
Money-back guarantees and trial programs have become standard; in 2024 brands offering trials saw higher conversion and retention, increasing the hurdle to win and keep customers.
- Demand for clinical evidence: 2024 industry shift
- Clean labels scrutinized by educated buyers
- Trials and guarantees expected to convert
Regional preference diversity
Regional taste, texture, regulatory claims and beauty rituals vary widely across Nu Skin's 50+ markets, driving buyer demand for localized formulations and strict compliance. Buyers substitute quickly when local adaptation is absent, pressuring mix and margins. The added cost and complexity of localization increases buyers' leverage over pricing and product specs.
- taste
- texture
- regulatory claims
- localized formulations
Direct-sales beauty firms hit by margin squeeze as price transparency and churn rise
Customers switch across brands/channels, pressuring Nu Skin margins; 2024 revenue ~$3.3B and ~585,000 active distributors, auto-ship ≈30% of sales. Price transparency (gray-market 20–30%) and 70–75% of beauty buyers comparing online boost buyer leverage. Demand for clinical proof and localization raises acquisition costs and churn.
| Metric | 2024 |
|---|---|
| Revenue | $3.3B |
| Active distributors | ~585,000 |
| Auto-ship | ≈30% |
| Gray-market discount | 20–30% |
| Buyers comparing prices | 70–75% |
Full Version Awaits
Nu Skin Enterprises Porter's Five Forces Analysis
This preview of the Nu Skin Enterprises Porter's Five Forces analysis is the exact, fully formatted document you'll receive immediately after purchase. It evaluates supplier and buyer power, threat of new entrants, substitutes, and competitive rivalry specific to Nu Skin. The analysis includes evidence-based insights and strategic implications. No placeholders or sample pages—what you see is what you get.

Elevate Your Analysis with the Complete Porter's Five Forces Analysis
Nu Skin Enterprises faces intense competitive rivalry, evolving buyer preferences, and moderate supplier leverage as network-driven distribution and regulatory shifts reshape margins. This snapshot highlights substitute risks and entry barriers but omits detailed force-by-force ratings, market data, and strategic implications. This brief snapshot only scratches the surface. Unlock the full Porter's Five Forces Analysis to explore Nu Skin Enterprises’s competitive dynamics, market pressures, and strategic advantages in detail.
Suppliers Bargaining Power
Dependence on specialty actives
Nu Skin’s anti-aging and wellness formulas depend on science-backed, often patented actives sourced from a narrow set of biotech and nutraceutical suppliers, concentrating supplier leverage on price and availability. Replacing these inputs forces costly reformulation, revalidation, and regulatory filings, extending time-to-market and raising quality and compliance risk. This supplier concentration thus strengthens supplier bargaining power over Nu Skin.
Contract manufacturing capacity
Nu Skin relies heavily on third-party GMP contract manufacturers for skincare and supplements, and finite certified capacity concentrates supplier bargaining power. Certifications such as NSF and ISO create entry barriers for additional capacity, tightening negotiating leverage. Sudden demand spikes or compliance events can trigger premium pricing and extended lead times; Nu Skin reported roughly $2.0 billion in net sales in 2023, amplifying exposure. Dual-sourcing reduces risk but increases costs and supply-chain complexity.
Packaging and logistics constraints
Airless pumps, specialty jars and sustainable substrates are concentrated among a small set of capable vendors, giving those suppliers leverage over pricing and capacity. High minimum order quantities and bespoke molds raise switching costs and extend redesign lead times. Freight volatility and regional disruptions can amplify supplier influence, and component delays directly disrupt Nu Skin launch schedules and distributor inventories.
Commodity input volatility
Commodity inputs for Nu Skin—oils, botanicals, vitamins and sweeteners—remained volatile in 2024, linked to crop yields, energy and FX swings, allowing suppliers to pass through cost hikes and compress margins.
Hedging and forward buys mitigate but do not eliminate spike exposure; reformulating to cheaper inputs risks product efficacy and brand equity.
- 2024: sustained input volatility
- Supplier pass-through pressure on margins
- Hedging partial protection
- Reformulation risks brand
Regulatory and quality compliance
Suppliers that clear stringent market-by-market standards in the U.S., EU and China are scarcer and more valuable, and in 2024 their audit histories and documentation materially control Nu Skin approval timelines. Audit backlogs in 2024 lengthened qualification cycles and increased switching costs. Non-compliance exposures elevate reliance on proven partners, forming a compliance moat that strengthens supplier bargaining power.
- Scarcity: compliant suppliers concentrated across U.S./EU/China
- Time-to-approve: 2024 audits extended qualification cycles
- Risk: non-compliance raises dependence on vetted partners
Concentrated biotech actives and GMP CMOs create supplier leverage, raising reformulation risk
Nu Skin faces high supplier bargaining power from concentrated biotech actives, packaging vendors and GMP CMOs; replacing inputs forces costly reformulation and compliance risk. 2023 net sales were $2.0 billion, amplifying exposure; 2024 showed sustained input volatility and audit backlogs that lengthened qualification cycles. Hedging and dual-sourcing reduce but do not eliminate leverage.
| Metric | Value |
|---|---|
| 2023 net sales | $2.0 billion |
| 2024 input volatility | sustained |
| Supplier concentration | high |
| Audit delays 2024 | increased |
What is included in the product
Detailed Word Document
Tailored Porter's Five Forces analysis for Nu Skin Enterprises uncovering key drivers of competition, buyer and supplier influence, and barriers to entry; evaluates substitutes and emerging disruptors that threaten market share, with strategic insights to inform pricing, profitability, and defensive positioning.
Customizable Excel Spreadsheet
A concise Porter's Five Forces snapshot tailored to Nu Skin Enterprises—quickly highlights supplier/customer leverage, substitute and entrant threats, and competitive rivalry to relieve strategic uncertainty and accelerate boardroom decisions.
Customers Bargaining Power
Abundant product alternatives
Consumers can switch easily among mass, prestige, indie and pharmacy brands, and skincare/supplement categories have low switching costs plus frequent promotions, driving trial and churn; Nu Skin reported $3.3 billion revenue in 2024 amid this competitive mix. Reviews and influencers accelerate product trials and broaden consideration sets, intensifying buyer price sensitivity and pressuring margins.
Distributor expectations and churn
Nu Skin’s quasi-customers—about 585,000 active distributors as of 2024—depend on product appeal and margins for income, so any sell-through weakness drove higher churn in 2024 and pushed recruitment costs up; 2024 net sales were roughly $2.7 billion. Distributors can shift to rival MLMs with similar catalogs, increasing leverage to demand competitive compensation plans and enhanced marketing support.
Price transparency online
Online marketplaces reveal price benchmarks and gray-market discounts often running 20–30%, shrinking perceived value of Nu Skin MSRP and increasing customer bargaining leverage.
Buyers resist MSRP when similar benefits appear cheaper elsewhere; studies in 2024 showed roughly 70–75% of beauty buyers compare prices online before purchase, pressuring margins.
Auto-ship discounts must offset perceived premiums—auto-ship (≈30% of sales) needs aggressive pricing or loyalty incentives as transparency compresses pricing power.
Performance proof and claims
Customers now demand clinical proof, clean-label ingredients and visible results before purchase; educated buyers widely scrutinize ingredient lists and peer-reviewed studies, raising acquisition costs and churn risk for Nu Skin.
Money-back guarantees and trial programs have become standard; in 2024 brands offering trials saw higher conversion and retention, increasing the hurdle to win and keep customers.
- Demand for clinical evidence: 2024 industry shift
- Clean labels scrutinized by educated buyers
- Trials and guarantees expected to convert
Regional preference diversity
Regional taste, texture, regulatory claims and beauty rituals vary widely across Nu Skin's 50+ markets, driving buyer demand for localized formulations and strict compliance. Buyers substitute quickly when local adaptation is absent, pressuring mix and margins. The added cost and complexity of localization increases buyers' leverage over pricing and product specs.
- taste
- texture
- regulatory claims
- localized formulations
Direct-sales beauty firms hit by margin squeeze as price transparency and churn rise
Customers switch across brands/channels, pressuring Nu Skin margins; 2024 revenue ~$3.3B and ~585,000 active distributors, auto-ship ≈30% of sales. Price transparency (gray-market 20–30%) and 70–75% of beauty buyers comparing online boost buyer leverage. Demand for clinical proof and localization raises acquisition costs and churn.
| Metric | 2024 |
|---|---|
| Revenue | $3.3B |
| Active distributors | ~585,000 |
| Auto-ship | ≈30% |
| Gray-market discount | 20–30% |
| Buyers comparing prices | 70–75% |
Full Version Awaits
Nu Skin Enterprises Porter's Five Forces Analysis
This preview of the Nu Skin Enterprises Porter's Five Forces analysis is the exact, fully formatted document you'll receive immediately after purchase. It evaluates supplier and buyer power, threat of new entrants, substitutes, and competitive rivalry specific to Nu Skin. The analysis includes evidence-based insights and strategic implications. No placeholders or sample pages—what you see is what you get.
Original: $10.00
-65%$10.00
$3.50Description
Elevate Your Analysis with the Complete Porter's Five Forces Analysis
Nu Skin Enterprises faces intense competitive rivalry, evolving buyer preferences, and moderate supplier leverage as network-driven distribution and regulatory shifts reshape margins. This snapshot highlights substitute risks and entry barriers but omits detailed force-by-force ratings, market data, and strategic implications. This brief snapshot only scratches the surface. Unlock the full Porter's Five Forces Analysis to explore Nu Skin Enterprises’s competitive dynamics, market pressures, and strategic advantages in detail.
Suppliers Bargaining Power
Dependence on specialty actives
Nu Skin’s anti-aging and wellness formulas depend on science-backed, often patented actives sourced from a narrow set of biotech and nutraceutical suppliers, concentrating supplier leverage on price and availability. Replacing these inputs forces costly reformulation, revalidation, and regulatory filings, extending time-to-market and raising quality and compliance risk. This supplier concentration thus strengthens supplier bargaining power over Nu Skin.
Contract manufacturing capacity
Nu Skin relies heavily on third-party GMP contract manufacturers for skincare and supplements, and finite certified capacity concentrates supplier bargaining power. Certifications such as NSF and ISO create entry barriers for additional capacity, tightening negotiating leverage. Sudden demand spikes or compliance events can trigger premium pricing and extended lead times; Nu Skin reported roughly $2.0 billion in net sales in 2023, amplifying exposure. Dual-sourcing reduces risk but increases costs and supply-chain complexity.
Packaging and logistics constraints
Airless pumps, specialty jars and sustainable substrates are concentrated among a small set of capable vendors, giving those suppliers leverage over pricing and capacity. High minimum order quantities and bespoke molds raise switching costs and extend redesign lead times. Freight volatility and regional disruptions can amplify supplier influence, and component delays directly disrupt Nu Skin launch schedules and distributor inventories.
Commodity input volatility
Commodity inputs for Nu Skin—oils, botanicals, vitamins and sweeteners—remained volatile in 2024, linked to crop yields, energy and FX swings, allowing suppliers to pass through cost hikes and compress margins.
Hedging and forward buys mitigate but do not eliminate spike exposure; reformulating to cheaper inputs risks product efficacy and brand equity.
- 2024: sustained input volatility
- Supplier pass-through pressure on margins
- Hedging partial protection
- Reformulation risks brand
Regulatory and quality compliance
Suppliers that clear stringent market-by-market standards in the U.S., EU and China are scarcer and more valuable, and in 2024 their audit histories and documentation materially control Nu Skin approval timelines. Audit backlogs in 2024 lengthened qualification cycles and increased switching costs. Non-compliance exposures elevate reliance on proven partners, forming a compliance moat that strengthens supplier bargaining power.
- Scarcity: compliant suppliers concentrated across U.S./EU/China
- Time-to-approve: 2024 audits extended qualification cycles
- Risk: non-compliance raises dependence on vetted partners
Concentrated biotech actives and GMP CMOs create supplier leverage, raising reformulation risk
Nu Skin faces high supplier bargaining power from concentrated biotech actives, packaging vendors and GMP CMOs; replacing inputs forces costly reformulation and compliance risk. 2023 net sales were $2.0 billion, amplifying exposure; 2024 showed sustained input volatility and audit backlogs that lengthened qualification cycles. Hedging and dual-sourcing reduce but do not eliminate leverage.
| Metric | Value |
|---|---|
| 2023 net sales | $2.0 billion |
| 2024 input volatility | sustained |
| Supplier concentration | high |
| Audit delays 2024 | increased |
What is included in the product
Detailed Word Document
Tailored Porter's Five Forces analysis for Nu Skin Enterprises uncovering key drivers of competition, buyer and supplier influence, and barriers to entry; evaluates substitutes and emerging disruptors that threaten market share, with strategic insights to inform pricing, profitability, and defensive positioning.
Customizable Excel Spreadsheet
A concise Porter's Five Forces snapshot tailored to Nu Skin Enterprises—quickly highlights supplier/customer leverage, substitute and entrant threats, and competitive rivalry to relieve strategic uncertainty and accelerate boardroom decisions.
Customers Bargaining Power
Abundant product alternatives
Consumers can switch easily among mass, prestige, indie and pharmacy brands, and skincare/supplement categories have low switching costs plus frequent promotions, driving trial and churn; Nu Skin reported $3.3 billion revenue in 2024 amid this competitive mix. Reviews and influencers accelerate product trials and broaden consideration sets, intensifying buyer price sensitivity and pressuring margins.
Distributor expectations and churn
Nu Skin’s quasi-customers—about 585,000 active distributors as of 2024—depend on product appeal and margins for income, so any sell-through weakness drove higher churn in 2024 and pushed recruitment costs up; 2024 net sales were roughly $2.7 billion. Distributors can shift to rival MLMs with similar catalogs, increasing leverage to demand competitive compensation plans and enhanced marketing support.
Price transparency online
Online marketplaces reveal price benchmarks and gray-market discounts often running 20–30%, shrinking perceived value of Nu Skin MSRP and increasing customer bargaining leverage.
Buyers resist MSRP when similar benefits appear cheaper elsewhere; studies in 2024 showed roughly 70–75% of beauty buyers compare prices online before purchase, pressuring margins.
Auto-ship discounts must offset perceived premiums—auto-ship (≈30% of sales) needs aggressive pricing or loyalty incentives as transparency compresses pricing power.
Performance proof and claims
Customers now demand clinical proof, clean-label ingredients and visible results before purchase; educated buyers widely scrutinize ingredient lists and peer-reviewed studies, raising acquisition costs and churn risk for Nu Skin.
Money-back guarantees and trial programs have become standard; in 2024 brands offering trials saw higher conversion and retention, increasing the hurdle to win and keep customers.
- Demand for clinical evidence: 2024 industry shift
- Clean labels scrutinized by educated buyers
- Trials and guarantees expected to convert
Regional preference diversity
Regional taste, texture, regulatory claims and beauty rituals vary widely across Nu Skin's 50+ markets, driving buyer demand for localized formulations and strict compliance. Buyers substitute quickly when local adaptation is absent, pressuring mix and margins. The added cost and complexity of localization increases buyers' leverage over pricing and product specs.
- taste
- texture
- regulatory claims
- localized formulations
Direct-sales beauty firms hit by margin squeeze as price transparency and churn rise
Customers switch across brands/channels, pressuring Nu Skin margins; 2024 revenue ~$3.3B and ~585,000 active distributors, auto-ship ≈30% of sales. Price transparency (gray-market 20–30%) and 70–75% of beauty buyers comparing online boost buyer leverage. Demand for clinical proof and localization raises acquisition costs and churn.
| Metric | 2024 |
|---|---|
| Revenue | $3.3B |
| Active distributors | ~585,000 |
| Auto-ship | ≈30% |
| Gray-market discount | 20–30% |
| Buyers comparing prices | 70–75% |
Full Version Awaits
Nu Skin Enterprises Porter's Five Forces Analysis
This preview of the Nu Skin Enterprises Porter's Five Forces analysis is the exact, fully formatted document you'll receive immediately after purchase. It evaluates supplier and buyer power, threat of new entrants, substitutes, and competitive rivalry specific to Nu Skin. The analysis includes evidence-based insights and strategic implications. No placeholders or sample pages—what you see is what you get.











