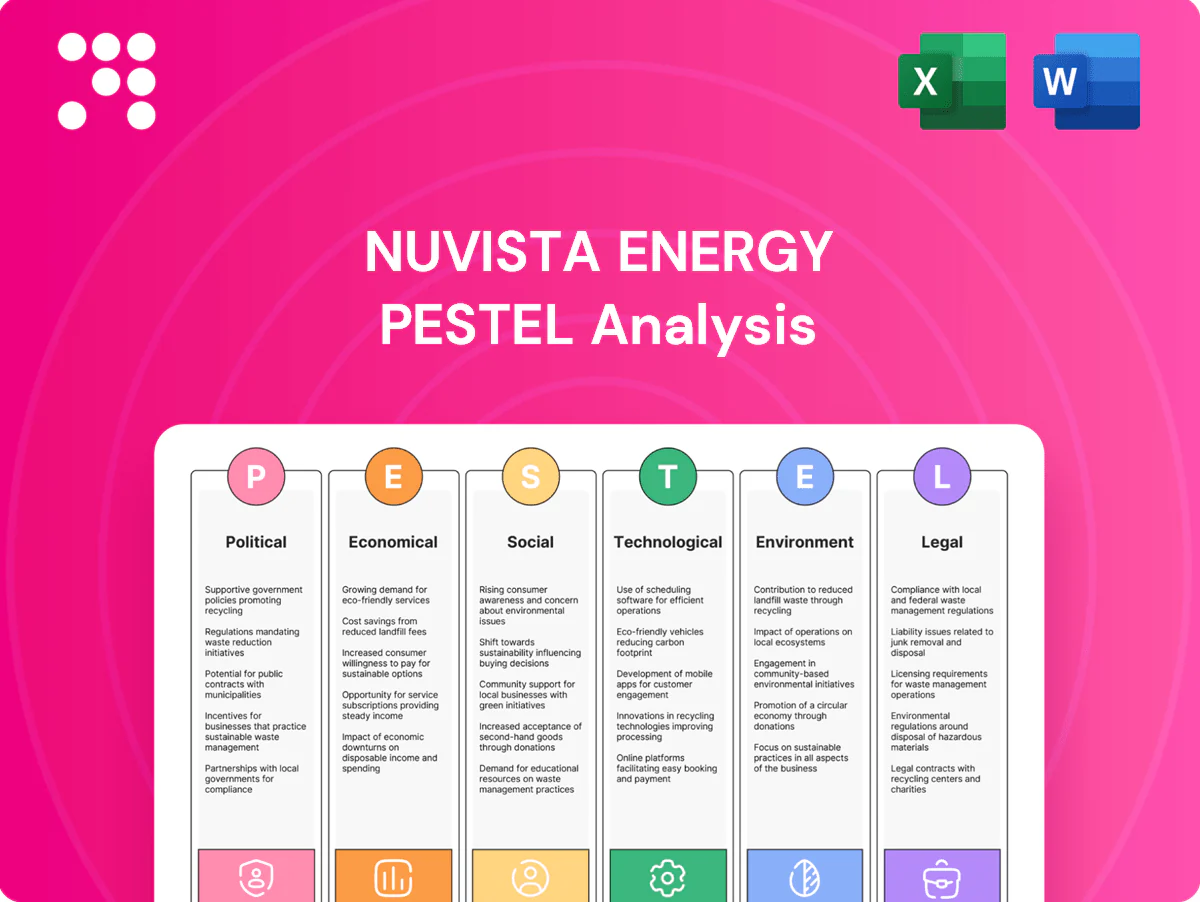
NuVista Energy PESTLE Analysis

Your Shortcut to Market Insight Starts Here
Quickly understand how political, economic and environmental forces shape NuVista Energy’s strategy and risk profile; our PESTLE highlights regulatory, commodity and ESG pressures affecting operations. This concise briefing reveals opportunities and threats for investors and managers. Purchase the full PESTLE for the detailed, editable analysis and actionable intelligence you can use immediately.
Political factors

Federal carbon pricing
Canada’s federal carbon price rose to CAD 65/tonne in 2023 and is scheduled under federal policy to escalate toward CAD 170/tonne by 2030, raising operating costs for combustion, flaring and fuel use across producers. Output-Based Pricing System credits and other industrial exemptions partially offset impacts but require robust compliance and tracking systems. NuVista must model carbon cost pass-through in gas-processing and midstream contracts. Political shifts could speed, slow or redesign the schedule, creating planning uncertainty.
Alberta energy policy
Provincial support for Montney development remains strong while Alberta has tightened environmental standards, including federal-aligned methane regulations introduced in 2023 that force more monitoring and mitigation. Programs targeting methane reductions and well cleanup—amid Alberta orphan well liabilities estimated near CAD 8 billion—shift NuVista's capital allocation and project timelines. Policy stability supports Montney growth, but regulatory tweaks can quickly change project economics, making ongoing engagement with the Alberta government and AER critical.

Indigenous relations and consultation
Duty to consult under Canadian law shapes permitting, access and community agreements for NuVista’s Montney-focused operations; Indigenous peoples represented 5.0% of Canada’s population (2021 Census). Strong partnerships and co-management deals can de-risk timelines, boost social licence and improve Indigenous workforce access. Missteps raise legal, reputational and delay risks. Benefit-sharing frameworks align interests over multi-decade assets.

Pipeline and LNG export strategy
Federal-provincial dynamics drive approvals for egress and LNG projects, shaping timelines and permitting risk; LNG Canada (14 Mtpa Phase 1) and projects targeting roughly 30–40 Mtpa by 2030 tighten AECO differentials and favor gas-focused producers like NuVista. Political will for energy security and Asia trade supports long-term demand, while delays or cancellations would materially constrain price realizations and realizable cash flow.
- Approvals risk: federal-provincial tensions
- LNG Canada: 14 Mtpa; national projects ~30–40 Mtpa by 2030
- Market impact: tighter AECO spreads, higher netbacks
- Downside: delays cut price realizations and cash flow
Geopolitics and energy security
Global disruptions (Russia-Ukraine, 2022–24 supply shocks) continue to drive commodity price volatility and shift North American flows; Henry Hub swings and widening WCS differentials have shown market sensitivity. Canada’s reputation as a stable supplier—supplying roughly 40% of US pipeline gas imports in 2023—supports investment, especially in gas. Geopolitical sanctions and trade-policy shifts can alter export routes and market access. NuVista must hedge exposure to international volatility through firm transport, price hedges and diversified offtakes.
- tag:price-volatility — commodity and hub price swings
- tag:market-access — sanctions/trade shifts risk
- tag:stable-supplier — Canada ~40% of US pipeline imports (2023)
- tag:hedging — firm transport, financial hedges, diversified offtakes
Canada: carbon CAD65→CAD170/t by 2030; methane regs, CAD8B orphan liability tighten gas
Canada carbon price CAD65/t (2023) rising to CAD170/t by 2030; OBRs partly offset costs. Alberta methane regs (2023) and ~CAD8B orphan well liability raise capex and compliance needs. LNG Canada 14 Mtpa (national 30–40 Mtpa by 2030) tightens AECO; Canada supplied ~40% of US pipeline gas (2023).
| Tag | Metric |
|---|---|
| carbon-price | CAD65/t (2023) → CAD170/t (2030) |
| orphan-liability | ~CAD8B |
| LNG | 14 Mtpa (LNG Canada); 30–40 Mtpa national |
| exports | ~40% US pipeline imports (2023) |
What is included in the product
 Detailed Word Document
Explores how macro-environmental factors uniquely affect NuVista Energy across Political, Economic, Social, Technological, Environmental and Legal dimensions, with each section supported by current data and trends to surface risks and opportunities for executives and investors.

 Customizable Excel Spreadsheet
A concise, visually segmented NuVista Energy PESTLE summary that clarifies regulatory, market and environmental risks, easily drop‑in for presentations, team alignment or client reports.
Economic factors

AECO gas and NGL pricing
Realized NuVista prices hinge on AECO basis, seasonal demand swings and egress constraints; AECO averaged about CAD 2.7/GJ in 2024, amplifying winter upside but limiting summer realizations. NGL pricing tracks WTI and petrochemical cycles (WTI ~USD 81/bbl in 2024), directly affecting liquids uplift. Marketing diversification and firm transport contracts have reduced basis volatility. Active price risk management remains central to stabilizing cash flow.
Capital intensity and productivity
NuVista’s Montney development is capital intensive: the company targeted a C$400 million range for its 2024 capital program, reflecting high upfront well costs that, when optimized, produce strong EURs in the Montney fairway. Pad drilling and longer laterals have reduced drilled‑unit costs by roughly 20–30% versus single‑well pads, improving F&D economics. Service cost inflation during 2024–25 has the potential to compress returns in activity upcycles, so NuVista uses rig scheduling and multi‑year supplier contracts to mitigate pricing volatility.

CAD–USD exchange rate
With the CAD trading around 0.73 USD in mid‑2025, a weaker CAD boosts NuVista’s CAD‑reported revenues when underlying gas prices reference USD benchmarks but increases costs for imported steel and equipment often invoiced in USD. NuVista’s hedging policies for gas prices and FX exposures can help stabilize margins amid FX volatility. FX movements also affect foreign investor flows into Canadian energy equities, influencing NuVista’s valuation and access to capital.

Interest rates and capital access
Higher interest rates (Bank of Canada policy rate 5.00% as of July 2025) increase debt service and raise hurdle rates for NuVista's drilling programs; tighter capital raises emphasis on free cash flow prioritization and payout frameworks to keep investor support.
- Credit facility terms linked to reserves, forward price decks and ESG performance
- Balanced leverage enhances cyclical resilience
- FCF-first payout frameworks attract yield-seeking investors
Labor and supply chain
Skilled labor tightness in Alberta has stretched NuVista Energy project timelines and lifted service costs, with provincial oil & gas employment remaining elevated into 2024 after recovery from 2020 lows. Proppant, tubulars and compressor lead times—routinely 6–26 weeks for major items in 2024—have constrained execution and raised working capital needs. NuVista mitigates disruption via local sourcing, long-term vendor contracts and digital procurement plus inventory planning to boost resilience.
- Labor tightness: elevated sector hiring pressure in 2024
- Lead times: proppant/tubulars/compressors typically 6–26 weeks
- Mitigants: local sourcing, long-term vendors, digital procurement/inventory planning
Canada: carbon CAD65→CAD170/t by 2030; methane regs, CAD8B orphan liability tighten gas
NuVista's realized prices remain AECO‑linked (AECO ~CAD 2.7/GJ in 2024) with seasonal and egress-driven volatility; NGL upside follows WTI (~USD 81/bbl in 2024). 2024 capex targeted ~C$400m; pad drilling and longer laterals cut unit costs ~20–30%. CAD ~0.73 USD (mid‑2025) and BoC rate 5.00% (Jul 2025) raise FX and financing sensitivity; lead times 6–26 weeks stress execution.
| Metric | Value | Impact |
|---|---|---|
| AECO 2024 | CAD 2.7/GJ | Price realizations |
| WTI 2024 | USD 81/bbl | NGL uplift |
| Capex 2024 | C$400m | Cash needs |
| FX mid‑2025 | CAD 0.73 | Revenue/cost mix |
| BoC rate Jul‑25 | 5.00% | Debt service |
| Lead times 2024 | 6–26 weeks | Execution risk |
Preview Before You Purchase
NuVista Energy PESTLE Analysis
The NuVista Energy PESTLE Analysis preview shown here is the exact document you’ll receive after purchase—fully formatted and ready to use. It contains the complete political, economic, social, technological, legal, and environmental assessment for NuVista Energy. No placeholders or teasers—this is the final file you’ll download instantly after payment.

Your Shortcut to Market Insight Starts Here
Quickly understand how political, economic and environmental forces shape NuVista Energy’s strategy and risk profile; our PESTLE highlights regulatory, commodity and ESG pressures affecting operations. This concise briefing reveals opportunities and threats for investors and managers. Purchase the full PESTLE for the detailed, editable analysis and actionable intelligence you can use immediately.
Political factors
Federal carbon pricing
Canada’s federal carbon price rose to CAD 65/tonne in 2023 and is scheduled under federal policy to escalate toward CAD 170/tonne by 2030, raising operating costs for combustion, flaring and fuel use across producers. Output-Based Pricing System credits and other industrial exemptions partially offset impacts but require robust compliance and tracking systems. NuVista must model carbon cost pass-through in gas-processing and midstream contracts. Political shifts could speed, slow or redesign the schedule, creating planning uncertainty.
Alberta energy policy
Provincial support for Montney development remains strong while Alberta has tightened environmental standards, including federal-aligned methane regulations introduced in 2023 that force more monitoring and mitigation. Programs targeting methane reductions and well cleanup—amid Alberta orphan well liabilities estimated near CAD 8 billion—shift NuVista's capital allocation and project timelines. Policy stability supports Montney growth, but regulatory tweaks can quickly change project economics, making ongoing engagement with the Alberta government and AER critical.
Indigenous relations and consultation
Duty to consult under Canadian law shapes permitting, access and community agreements for NuVista’s Montney-focused operations; Indigenous peoples represented 5.0% of Canada’s population (2021 Census). Strong partnerships and co-management deals can de-risk timelines, boost social licence and improve Indigenous workforce access. Missteps raise legal, reputational and delay risks. Benefit-sharing frameworks align interests over multi-decade assets.
Pipeline and LNG export strategy
Federal-provincial dynamics drive approvals for egress and LNG projects, shaping timelines and permitting risk; LNG Canada (14 Mtpa Phase 1) and projects targeting roughly 30–40 Mtpa by 2030 tighten AECO differentials and favor gas-focused producers like NuVista. Political will for energy security and Asia trade supports long-term demand, while delays or cancellations would materially constrain price realizations and realizable cash flow.
- Approvals risk: federal-provincial tensions
- LNG Canada: 14 Mtpa; national projects ~30–40 Mtpa by 2030
- Market impact: tighter AECO spreads, higher netbacks
- Downside: delays cut price realizations and cash flow
Geopolitics and energy security
Global disruptions (Russia-Ukraine, 2022–24 supply shocks) continue to drive commodity price volatility and shift North American flows; Henry Hub swings and widening WCS differentials have shown market sensitivity. Canada’s reputation as a stable supplier—supplying roughly 40% of US pipeline gas imports in 2023—supports investment, especially in gas. Geopolitical sanctions and trade-policy shifts can alter export routes and market access. NuVista must hedge exposure to international volatility through firm transport, price hedges and diversified offtakes.
- tag:price-volatility — commodity and hub price swings
- tag:market-access — sanctions/trade shifts risk
- tag:stable-supplier — Canada ~40% of US pipeline imports (2023)
- tag:hedging — firm transport, financial hedges, diversified offtakes
Canada: carbon CAD65→CAD170/t by 2030; methane regs, CAD8B orphan liability tighten gas
Canada carbon price CAD65/t (2023) rising to CAD170/t by 2030; OBRs partly offset costs. Alberta methane regs (2023) and ~CAD8B orphan well liability raise capex and compliance needs. LNG Canada 14 Mtpa (national 30–40 Mtpa by 2030) tightens AECO; Canada supplied ~40% of US pipeline gas (2023).
| Tag | Metric |
|---|---|
| carbon-price | CAD65/t (2023) → CAD170/t (2030) |
| orphan-liability | ~CAD8B |
| LNG | 14 Mtpa (LNG Canada); 30–40 Mtpa national |
| exports | ~40% US pipeline imports (2023) |
What is included in the product
Detailed Word Document
Explores how macro-environmental factors uniquely affect NuVista Energy across Political, Economic, Social, Technological, Environmental and Legal dimensions, with each section supported by current data and trends to surface risks and opportunities for executives and investors.
Customizable Excel Spreadsheet
A concise, visually segmented NuVista Energy PESTLE summary that clarifies regulatory, market and environmental risks, easily drop‑in for presentations, team alignment or client reports.
Economic factors
AECO gas and NGL pricing
Realized NuVista prices hinge on AECO basis, seasonal demand swings and egress constraints; AECO averaged about CAD 2.7/GJ in 2024, amplifying winter upside but limiting summer realizations. NGL pricing tracks WTI and petrochemical cycles (WTI ~USD 81/bbl in 2024), directly affecting liquids uplift. Marketing diversification and firm transport contracts have reduced basis volatility. Active price risk management remains central to stabilizing cash flow.
Capital intensity and productivity
NuVista’s Montney development is capital intensive: the company targeted a C$400 million range for its 2024 capital program, reflecting high upfront well costs that, when optimized, produce strong EURs in the Montney fairway. Pad drilling and longer laterals have reduced drilled‑unit costs by roughly 20–30% versus single‑well pads, improving F&D economics. Service cost inflation during 2024–25 has the potential to compress returns in activity upcycles, so NuVista uses rig scheduling and multi‑year supplier contracts to mitigate pricing volatility.
CAD–USD exchange rate
With the CAD trading around 0.73 USD in mid‑2025, a weaker CAD boosts NuVista’s CAD‑reported revenues when underlying gas prices reference USD benchmarks but increases costs for imported steel and equipment often invoiced in USD. NuVista’s hedging policies for gas prices and FX exposures can help stabilize margins amid FX volatility. FX movements also affect foreign investor flows into Canadian energy equities, influencing NuVista’s valuation and access to capital.
Interest rates and capital access
Higher interest rates (Bank of Canada policy rate 5.00% as of July 2025) increase debt service and raise hurdle rates for NuVista's drilling programs; tighter capital raises emphasis on free cash flow prioritization and payout frameworks to keep investor support.
- Credit facility terms linked to reserves, forward price decks and ESG performance
- Balanced leverage enhances cyclical resilience
- FCF-first payout frameworks attract yield-seeking investors
Labor and supply chain
Skilled labor tightness in Alberta has stretched NuVista Energy project timelines and lifted service costs, with provincial oil & gas employment remaining elevated into 2024 after recovery from 2020 lows. Proppant, tubulars and compressor lead times—routinely 6–26 weeks for major items in 2024—have constrained execution and raised working capital needs. NuVista mitigates disruption via local sourcing, long-term vendor contracts and digital procurement plus inventory planning to boost resilience.
- Labor tightness: elevated sector hiring pressure in 2024
- Lead times: proppant/tubulars/compressors typically 6–26 weeks
- Mitigants: local sourcing, long-term vendors, digital procurement/inventory planning
Canada: carbon CAD65→CAD170/t by 2030; methane regs, CAD8B orphan liability tighten gas
NuVista's realized prices remain AECO‑linked (AECO ~CAD 2.7/GJ in 2024) with seasonal and egress-driven volatility; NGL upside follows WTI (~USD 81/bbl in 2024). 2024 capex targeted ~C$400m; pad drilling and longer laterals cut unit costs ~20–30%. CAD ~0.73 USD (mid‑2025) and BoC rate 5.00% (Jul 2025) raise FX and financing sensitivity; lead times 6–26 weeks stress execution.
| Metric | Value | Impact |
|---|---|---|
| AECO 2024 | CAD 2.7/GJ | Price realizations |
| WTI 2024 | USD 81/bbl | NGL uplift |
| Capex 2024 | C$400m | Cash needs |
| FX mid‑2025 | CAD 0.73 | Revenue/cost mix |
| BoC rate Jul‑25 | 5.00% | Debt service |
| Lead times 2024 | 6–26 weeks | Execution risk |
Preview Before You Purchase
NuVista Energy PESTLE Analysis
The NuVista Energy PESTLE Analysis preview shown here is the exact document you’ll receive after purchase—fully formatted and ready to use. It contains the complete political, economic, social, technological, legal, and environmental assessment for NuVista Energy. No placeholders or teasers—this is the final file you’ll download instantly after payment.
Description
Your Shortcut to Market Insight Starts Here
Quickly understand how political, economic and environmental forces shape NuVista Energy’s strategy and risk profile; our PESTLE highlights regulatory, commodity and ESG pressures affecting operations. This concise briefing reveals opportunities and threats for investors and managers. Purchase the full PESTLE for the detailed, editable analysis and actionable intelligence you can use immediately.
Political factors
Federal carbon pricing
Canada’s federal carbon price rose to CAD 65/tonne in 2023 and is scheduled under federal policy to escalate toward CAD 170/tonne by 2030, raising operating costs for combustion, flaring and fuel use across producers. Output-Based Pricing System credits and other industrial exemptions partially offset impacts but require robust compliance and tracking systems. NuVista must model carbon cost pass-through in gas-processing and midstream contracts. Political shifts could speed, slow or redesign the schedule, creating planning uncertainty.
Alberta energy policy
Provincial support for Montney development remains strong while Alberta has tightened environmental standards, including federal-aligned methane regulations introduced in 2023 that force more monitoring and mitigation. Programs targeting methane reductions and well cleanup—amid Alberta orphan well liabilities estimated near CAD 8 billion—shift NuVista's capital allocation and project timelines. Policy stability supports Montney growth, but regulatory tweaks can quickly change project economics, making ongoing engagement with the Alberta government and AER critical.
Indigenous relations and consultation
Duty to consult under Canadian law shapes permitting, access and community agreements for NuVista’s Montney-focused operations; Indigenous peoples represented 5.0% of Canada’s population (2021 Census). Strong partnerships and co-management deals can de-risk timelines, boost social licence and improve Indigenous workforce access. Missteps raise legal, reputational and delay risks. Benefit-sharing frameworks align interests over multi-decade assets.
Pipeline and LNG export strategy
Federal-provincial dynamics drive approvals for egress and LNG projects, shaping timelines and permitting risk; LNG Canada (14 Mtpa Phase 1) and projects targeting roughly 30–40 Mtpa by 2030 tighten AECO differentials and favor gas-focused producers like NuVista. Political will for energy security and Asia trade supports long-term demand, while delays or cancellations would materially constrain price realizations and realizable cash flow.
- Approvals risk: federal-provincial tensions
- LNG Canada: 14 Mtpa; national projects ~30–40 Mtpa by 2030
- Market impact: tighter AECO spreads, higher netbacks
- Downside: delays cut price realizations and cash flow
Geopolitics and energy security
Global disruptions (Russia-Ukraine, 2022–24 supply shocks) continue to drive commodity price volatility and shift North American flows; Henry Hub swings and widening WCS differentials have shown market sensitivity. Canada’s reputation as a stable supplier—supplying roughly 40% of US pipeline gas imports in 2023—supports investment, especially in gas. Geopolitical sanctions and trade-policy shifts can alter export routes and market access. NuVista must hedge exposure to international volatility through firm transport, price hedges and diversified offtakes.
- tag:price-volatility — commodity and hub price swings
- tag:market-access — sanctions/trade shifts risk
- tag:stable-supplier — Canada ~40% of US pipeline imports (2023)
- tag:hedging — firm transport, financial hedges, diversified offtakes
Canada: carbon CAD65→CAD170/t by 2030; methane regs, CAD8B orphan liability tighten gas
Canada carbon price CAD65/t (2023) rising to CAD170/t by 2030; OBRs partly offset costs. Alberta methane regs (2023) and ~CAD8B orphan well liability raise capex and compliance needs. LNG Canada 14 Mtpa (national 30–40 Mtpa by 2030) tightens AECO; Canada supplied ~40% of US pipeline gas (2023).
| Tag | Metric |
|---|---|
| carbon-price | CAD65/t (2023) → CAD170/t (2030) |
| orphan-liability | ~CAD8B |
| LNG | 14 Mtpa (LNG Canada); 30–40 Mtpa national |
| exports | ~40% US pipeline imports (2023) |
What is included in the product
Detailed Word Document
Explores how macro-environmental factors uniquely affect NuVista Energy across Political, Economic, Social, Technological, Environmental and Legal dimensions, with each section supported by current data and trends to surface risks and opportunities for executives and investors.
Customizable Excel Spreadsheet
A concise, visually segmented NuVista Energy PESTLE summary that clarifies regulatory, market and environmental risks, easily drop‑in for presentations, team alignment or client reports.
Economic factors
AECO gas and NGL pricing
Realized NuVista prices hinge on AECO basis, seasonal demand swings and egress constraints; AECO averaged about CAD 2.7/GJ in 2024, amplifying winter upside but limiting summer realizations. NGL pricing tracks WTI and petrochemical cycles (WTI ~USD 81/bbl in 2024), directly affecting liquids uplift. Marketing diversification and firm transport contracts have reduced basis volatility. Active price risk management remains central to stabilizing cash flow.
Capital intensity and productivity
NuVista’s Montney development is capital intensive: the company targeted a C$400 million range for its 2024 capital program, reflecting high upfront well costs that, when optimized, produce strong EURs in the Montney fairway. Pad drilling and longer laterals have reduced drilled‑unit costs by roughly 20–30% versus single‑well pads, improving F&D economics. Service cost inflation during 2024–25 has the potential to compress returns in activity upcycles, so NuVista uses rig scheduling and multi‑year supplier contracts to mitigate pricing volatility.
CAD–USD exchange rate
With the CAD trading around 0.73 USD in mid‑2025, a weaker CAD boosts NuVista’s CAD‑reported revenues when underlying gas prices reference USD benchmarks but increases costs for imported steel and equipment often invoiced in USD. NuVista’s hedging policies for gas prices and FX exposures can help stabilize margins amid FX volatility. FX movements also affect foreign investor flows into Canadian energy equities, influencing NuVista’s valuation and access to capital.
Interest rates and capital access
Higher interest rates (Bank of Canada policy rate 5.00% as of July 2025) increase debt service and raise hurdle rates for NuVista's drilling programs; tighter capital raises emphasis on free cash flow prioritization and payout frameworks to keep investor support.
- Credit facility terms linked to reserves, forward price decks and ESG performance
- Balanced leverage enhances cyclical resilience
- FCF-first payout frameworks attract yield-seeking investors
Labor and supply chain
Skilled labor tightness in Alberta has stretched NuVista Energy project timelines and lifted service costs, with provincial oil & gas employment remaining elevated into 2024 after recovery from 2020 lows. Proppant, tubulars and compressor lead times—routinely 6–26 weeks for major items in 2024—have constrained execution and raised working capital needs. NuVista mitigates disruption via local sourcing, long-term vendor contracts and digital procurement plus inventory planning to boost resilience.
- Labor tightness: elevated sector hiring pressure in 2024
- Lead times: proppant/tubulars/compressors typically 6–26 weeks
- Mitigants: local sourcing, long-term vendors, digital procurement/inventory planning
Canada: carbon CAD65→CAD170/t by 2030; methane regs, CAD8B orphan liability tighten gas
NuVista's realized prices remain AECO‑linked (AECO ~CAD 2.7/GJ in 2024) with seasonal and egress-driven volatility; NGL upside follows WTI (~USD 81/bbl in 2024). 2024 capex targeted ~C$400m; pad drilling and longer laterals cut unit costs ~20–30%. CAD ~0.73 USD (mid‑2025) and BoC rate 5.00% (Jul 2025) raise FX and financing sensitivity; lead times 6–26 weeks stress execution.
| Metric | Value | Impact |
|---|---|---|
| AECO 2024 | CAD 2.7/GJ | Price realizations |
| WTI 2024 | USD 81/bbl | NGL uplift |
| Capex 2024 | C$400m | Cash needs |
| FX mid‑2025 | CAD 0.73 | Revenue/cost mix |
| BoC rate Jul‑25 | 5.00% | Debt service |
| Lead times 2024 | 6–26 weeks | Execution risk |
Preview Before You Purchase
NuVista Energy PESTLE Analysis
The NuVista Energy PESTLE Analysis preview shown here is the exact document you’ll receive after purchase—fully formatted and ready to use. It contains the complete political, economic, social, technological, legal, and environmental assessment for NuVista Energy. No placeholders or teasers—this is the final file you’ll download instantly after payment.











