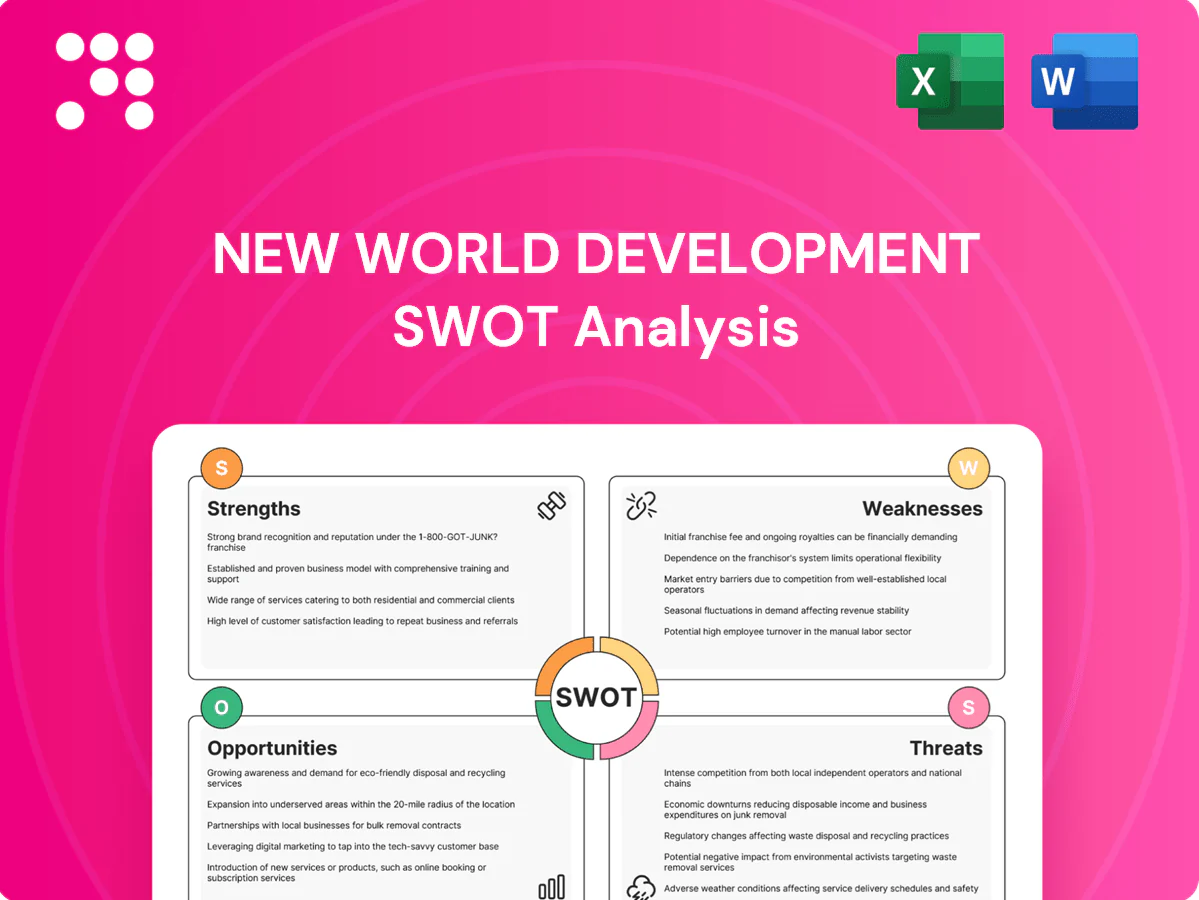
New World Development SWOT Analysis

Make Insightful Decisions Backed by Expert Research
New World Development's strategic landbank, diversified property portfolio, and retail foothold mask mounting leverage and regional exposure—our brief highlights key strengths and threats. Want the full story behind its growth drivers and risks? Purchase the complete SWOT analysis for a professionally written, editable Word and Excel report to guide investing and strategy.
Strengths

Diversified business mix
New World Development’s diversified mix across property development, infrastructure and services reduces reliance on any single cycle, with residential, commercial, retail, hotels and logistics creating multiple demand drivers and cross-selling opportunities within mixed-use ecosystems.
Prime HK–Mainland footprint
New World Development (HKEX: 0017) leverages a deep Hong Kong and Mainland footprint, securing access to core urban demand across the Greater Bay Area and key Mainland cities. Its landbank and flagship assets, including K11 retail and mixed‑use projects, underpin local pricing power and brand premium. Cross‑border development know‑how accelerates approvals and delivery cycles. Regional scale strengthens procurement and contractor bargaining.

Strong brands and recurring income
New World Development, founded in 1970, leverages iconic retail and hospitality platforms such as K11 and flagship malls to boost tenant and customer stickiness. Quality malls, offices and hotels—across Hong Kong, Mainland China and Macau—generate steady recurring cash flows alongside episodic development profits. Mixed-use placemaking (e.g., K11 Musea opened 2019) elevates footfall and asset productivity, while strong brand equity supports premium positioning and faster leasing velocity.

Integrated development capabilities
Integrated development capabilities let New World compress timelines and costs through end-to-end expertise from site assembly to operations, while in-house design, construction oversight and asset management enhance margins and speed decision-making. Portfolio recycling and disciplined reinvestment optimize returns across cycles, and operational synergies boost utilization of shared services and data to lift asset performance.
- End-to-end execution
- In-house design & asset mgmt
- Portfolio recycling
- Shared-services synergies
Partnerships and capital access
New World Development (HKEX stock code 0017) leverages joint ventures and co-investments to spread project risk and unlock larger development pipelines, while deep relationships with banks, insurers and institutional investors reduce funding friction and support recurring liquidity. Access to equity and debt markets across Hong Kong and offshore enhances refinancing flexibility, and strategic partners contribute technology, anchor tenants and operational expertise.
- Joint ventures: risk sharing, larger pipelines
- Bank/insurer ties: lower funding friction
- Multi-market capital access: refinancing flexibility
- Strategic partners: tech, tenants, operating know-how
GBA mixed-use portfolio across Hong Kong, Mainland China and Macau fuels diversified revenue
Diversified property, infrastructure and services across Hong Kong, Mainland China and Macau drive multiple revenue streams and cross‑selling in mixed‑use ecosystems. Deep Greater Bay Area footprint and flagship K11 assets (K11 Musea opened 2019) support pricing power and leasing velocity. In‑house execution and JV funding lower cycle risk and compress delivery timelines.
| Metric | Value |
|---|---|
| Founded | 1970 |
| HKEX code | 0017 |
| Flagship K11 Musea opened | 2019 |
| Core regions | Hong Kong, Mainland China, Macau |
What is included in the product
 Detailed Word Document
Delivers a strategic overview of New World Development’s internal and external business factors, outlining strengths, weaknesses, opportunities and threats to assess its competitive position, growth drivers and market risks shaping future performance.

 Customizable Excel Spreadsheet
Provides a concise, visual SWOT matrix for New World Development that streamlines strategic alignment and enables quick edits to reflect shifting market priorities for fast stakeholder decision-making.
Weaknesses

High capital intensity
Large upfront land acquisitions and construction expenditures strain New World Developments balance sheet, with long payback cycles increasing sensitivity to interest-rate swings and market downturns. Working capital demands spike during construction peaks, forcing short-term funding or higher drawdowns on facilities. Timing mismatches between project outflows and sales inflows complicate deleveraging and raise refinancing risk.
Cyclical exposure
Revenue and margins at New World Development are highly sensitive to HK and China property cycles, so downturns compress development margins and land-sale timing; China grew 5.2% in 2023, underscoring cyclical exposure to macro swings. Sales slowdowns rapidly hit cash collections and inventory turns, pressuring working capital. Hospitality and retail earnings swing with tourism—HK saw about 18.2 million visitor arrivals in 2023—while infrastructure tariffs and volumes can soften in downturns.

Complex portfolio management
New World Development (HKEX: 0017) runs multi-segment operations across 5+ markets, raising execution risk as development, leasing and operations must be coordinated across jurisdictions. Governance and oversight costs rise with organizational complexity, while project delays or cost overruns in one asset can cascade through the pipeline and strain group resources. This complexity can dilute managerial focus and slow capital recycling.

Regulatory dependence
Regulatory dependence compresses New World Development margins as land policies, pre-sale rules and price controls limit pricing flexibility and lock in lower returns; zoning and environmental approvals routinely extend project timelines, raising financing costs. Infrastructure concessions face policy and tariff resets that can erode long-term cash flows, while growing compliance burdens lift operating costs and increase project uncertainty.
- Land policy constraints
- Pre-sale & price caps
- Zoning/environment delays
- Concession tariff risk
- Rising compliance costs
Currency and concentration risks
Earnings concentrated in HKD and RMB leave New World Development exposed to FX and purchasing-power shifts; HKD remains pegged to USD since 1983 while RMB was about 3% of global payments in 2024, limiting currency diversification.
Heavy reliance on Greater China amplifies localized shocks and property-cycle risk; cross-border remittances and Chinese capital controls can constrain cash mobility and strategic flexibility.
Hedging programs reduce volatility but cannot fully remove translation, basis and regulatory exposures.
- currency: HKD peg since 1983, RMB ~3% global payments (2024)
- geography: concentration in Greater China heightens local shock risk
- capital controls: remittance limits can restrict liquidity
- hedging: mitigates but does not eliminate FX exposure
High upfront costs and FX/regulatory exposure drive long payback and refinancing risk
Large upfront land and construction costs create long payback cycles and refinancing sensitivity; project timing mismatches strain working capital. Earnings are cyclical—China GDP +5.2% (2023) and HK visitors 18.2m (2023) show market dependence—while multi-segment, 5+ market operations raise execution and governance risk. Regulatory, tariff and FX (RMB ~3% global payments, 2024; HKD peg since 1983) exposures limit pricing flexibility.
| Metric | Value | Year/Source |
|---|---|---|
| China GDP growth | +5.2% | 2023 |
| HK visitor arrivals | 18.2m | 2023 |
| RMB share global payments | ~3% | 2024 |
| Markets | 5+ | Group disclosure |
Preview the Actual Deliverable
New World Development SWOT Analysis
This is a live preview of the actual New World Development SWOT analysis you’ll receive upon purchase—no surprises, just professional quality. The excerpt below is pulled directly from the full, editable report. The complete document becomes available immediately after checkout.

Make Insightful Decisions Backed by Expert Research
New World Development's strategic landbank, diversified property portfolio, and retail foothold mask mounting leverage and regional exposure—our brief highlights key strengths and threats. Want the full story behind its growth drivers and risks? Purchase the complete SWOT analysis for a professionally written, editable Word and Excel report to guide investing and strategy.
Strengths
Diversified business mix
New World Development’s diversified mix across property development, infrastructure and services reduces reliance on any single cycle, with residential, commercial, retail, hotels and logistics creating multiple demand drivers and cross-selling opportunities within mixed-use ecosystems.
Prime HK–Mainland footprint
New World Development (HKEX: 0017) leverages a deep Hong Kong and Mainland footprint, securing access to core urban demand across the Greater Bay Area and key Mainland cities. Its landbank and flagship assets, including K11 retail and mixed‑use projects, underpin local pricing power and brand premium. Cross‑border development know‑how accelerates approvals and delivery cycles. Regional scale strengthens procurement and contractor bargaining.
Strong brands and recurring income
New World Development, founded in 1970, leverages iconic retail and hospitality platforms such as K11 and flagship malls to boost tenant and customer stickiness. Quality malls, offices and hotels—across Hong Kong, Mainland China and Macau—generate steady recurring cash flows alongside episodic development profits. Mixed-use placemaking (e.g., K11 Musea opened 2019) elevates footfall and asset productivity, while strong brand equity supports premium positioning and faster leasing velocity.
Integrated development capabilities
Integrated development capabilities let New World compress timelines and costs through end-to-end expertise from site assembly to operations, while in-house design, construction oversight and asset management enhance margins and speed decision-making. Portfolio recycling and disciplined reinvestment optimize returns across cycles, and operational synergies boost utilization of shared services and data to lift asset performance.
- End-to-end execution
- In-house design & asset mgmt
- Portfolio recycling
- Shared-services synergies
Partnerships and capital access
New World Development (HKEX stock code 0017) leverages joint ventures and co-investments to spread project risk and unlock larger development pipelines, while deep relationships with banks, insurers and institutional investors reduce funding friction and support recurring liquidity. Access to equity and debt markets across Hong Kong and offshore enhances refinancing flexibility, and strategic partners contribute technology, anchor tenants and operational expertise.
- Joint ventures: risk sharing, larger pipelines
- Bank/insurer ties: lower funding friction
- Multi-market capital access: refinancing flexibility
- Strategic partners: tech, tenants, operating know-how
GBA mixed-use portfolio across Hong Kong, Mainland China and Macau fuels diversified revenue
Diversified property, infrastructure and services across Hong Kong, Mainland China and Macau drive multiple revenue streams and cross‑selling in mixed‑use ecosystems. Deep Greater Bay Area footprint and flagship K11 assets (K11 Musea opened 2019) support pricing power and leasing velocity. In‑house execution and JV funding lower cycle risk and compress delivery timelines.
| Metric | Value |
|---|---|
| Founded | 1970 |
| HKEX code | 0017 |
| Flagship K11 Musea opened | 2019 |
| Core regions | Hong Kong, Mainland China, Macau |
What is included in the product
Detailed Word Document
Delivers a strategic overview of New World Development’s internal and external business factors, outlining strengths, weaknesses, opportunities and threats to assess its competitive position, growth drivers and market risks shaping future performance.
Customizable Excel Spreadsheet
Provides a concise, visual SWOT matrix for New World Development that streamlines strategic alignment and enables quick edits to reflect shifting market priorities for fast stakeholder decision-making.
Weaknesses
High capital intensity
Large upfront land acquisitions and construction expenditures strain New World Developments balance sheet, with long payback cycles increasing sensitivity to interest-rate swings and market downturns. Working capital demands spike during construction peaks, forcing short-term funding or higher drawdowns on facilities. Timing mismatches between project outflows and sales inflows complicate deleveraging and raise refinancing risk.
Cyclical exposure
Revenue and margins at New World Development are highly sensitive to HK and China property cycles, so downturns compress development margins and land-sale timing; China grew 5.2% in 2023, underscoring cyclical exposure to macro swings. Sales slowdowns rapidly hit cash collections and inventory turns, pressuring working capital. Hospitality and retail earnings swing with tourism—HK saw about 18.2 million visitor arrivals in 2023—while infrastructure tariffs and volumes can soften in downturns.
Complex portfolio management
New World Development (HKEX: 0017) runs multi-segment operations across 5+ markets, raising execution risk as development, leasing and operations must be coordinated across jurisdictions. Governance and oversight costs rise with organizational complexity, while project delays or cost overruns in one asset can cascade through the pipeline and strain group resources. This complexity can dilute managerial focus and slow capital recycling.
Regulatory dependence
Regulatory dependence compresses New World Development margins as land policies, pre-sale rules and price controls limit pricing flexibility and lock in lower returns; zoning and environmental approvals routinely extend project timelines, raising financing costs. Infrastructure concessions face policy and tariff resets that can erode long-term cash flows, while growing compliance burdens lift operating costs and increase project uncertainty.
- Land policy constraints
- Pre-sale & price caps
- Zoning/environment delays
- Concession tariff risk
- Rising compliance costs
Currency and concentration risks
Earnings concentrated in HKD and RMB leave New World Development exposed to FX and purchasing-power shifts; HKD remains pegged to USD since 1983 while RMB was about 3% of global payments in 2024, limiting currency diversification.
Heavy reliance on Greater China amplifies localized shocks and property-cycle risk; cross-border remittances and Chinese capital controls can constrain cash mobility and strategic flexibility.
Hedging programs reduce volatility but cannot fully remove translation, basis and regulatory exposures.
- currency: HKD peg since 1983, RMB ~3% global payments (2024)
- geography: concentration in Greater China heightens local shock risk
- capital controls: remittance limits can restrict liquidity
- hedging: mitigates but does not eliminate FX exposure
High upfront costs and FX/regulatory exposure drive long payback and refinancing risk
Large upfront land and construction costs create long payback cycles and refinancing sensitivity; project timing mismatches strain working capital. Earnings are cyclical—China GDP +5.2% (2023) and HK visitors 18.2m (2023) show market dependence—while multi-segment, 5+ market operations raise execution and governance risk. Regulatory, tariff and FX (RMB ~3% global payments, 2024; HKD peg since 1983) exposures limit pricing flexibility.
| Metric | Value | Year/Source |
|---|---|---|
| China GDP growth | +5.2% | 2023 |
| HK visitor arrivals | 18.2m | 2023 |
| RMB share global payments | ~3% | 2024 |
| Markets | 5+ | Group disclosure |
Preview the Actual Deliverable
New World Development SWOT Analysis
This is a live preview of the actual New World Development SWOT analysis you’ll receive upon purchase—no surprises, just professional quality. The excerpt below is pulled directly from the full, editable report. The complete document becomes available immediately after checkout.
Original: $10.00
-65%$10.00
$3.50Description
Make Insightful Decisions Backed by Expert Research
New World Development's strategic landbank, diversified property portfolio, and retail foothold mask mounting leverage and regional exposure—our brief highlights key strengths and threats. Want the full story behind its growth drivers and risks? Purchase the complete SWOT analysis for a professionally written, editable Word and Excel report to guide investing and strategy.
Strengths
Diversified business mix
New World Development’s diversified mix across property development, infrastructure and services reduces reliance on any single cycle, with residential, commercial, retail, hotels and logistics creating multiple demand drivers and cross-selling opportunities within mixed-use ecosystems.
Prime HK–Mainland footprint
New World Development (HKEX: 0017) leverages a deep Hong Kong and Mainland footprint, securing access to core urban demand across the Greater Bay Area and key Mainland cities. Its landbank and flagship assets, including K11 retail and mixed‑use projects, underpin local pricing power and brand premium. Cross‑border development know‑how accelerates approvals and delivery cycles. Regional scale strengthens procurement and contractor bargaining.
Strong brands and recurring income
New World Development, founded in 1970, leverages iconic retail and hospitality platforms such as K11 and flagship malls to boost tenant and customer stickiness. Quality malls, offices and hotels—across Hong Kong, Mainland China and Macau—generate steady recurring cash flows alongside episodic development profits. Mixed-use placemaking (e.g., K11 Musea opened 2019) elevates footfall and asset productivity, while strong brand equity supports premium positioning and faster leasing velocity.
Integrated development capabilities
Integrated development capabilities let New World compress timelines and costs through end-to-end expertise from site assembly to operations, while in-house design, construction oversight and asset management enhance margins and speed decision-making. Portfolio recycling and disciplined reinvestment optimize returns across cycles, and operational synergies boost utilization of shared services and data to lift asset performance.
- End-to-end execution
- In-house design & asset mgmt
- Portfolio recycling
- Shared-services synergies
Partnerships and capital access
New World Development (HKEX stock code 0017) leverages joint ventures and co-investments to spread project risk and unlock larger development pipelines, while deep relationships with banks, insurers and institutional investors reduce funding friction and support recurring liquidity. Access to equity and debt markets across Hong Kong and offshore enhances refinancing flexibility, and strategic partners contribute technology, anchor tenants and operational expertise.
- Joint ventures: risk sharing, larger pipelines
- Bank/insurer ties: lower funding friction
- Multi-market capital access: refinancing flexibility
- Strategic partners: tech, tenants, operating know-how
GBA mixed-use portfolio across Hong Kong, Mainland China and Macau fuels diversified revenue
Diversified property, infrastructure and services across Hong Kong, Mainland China and Macau drive multiple revenue streams and cross‑selling in mixed‑use ecosystems. Deep Greater Bay Area footprint and flagship K11 assets (K11 Musea opened 2019) support pricing power and leasing velocity. In‑house execution and JV funding lower cycle risk and compress delivery timelines.
| Metric | Value |
|---|---|
| Founded | 1970 |
| HKEX code | 0017 |
| Flagship K11 Musea opened | 2019 |
| Core regions | Hong Kong, Mainland China, Macau |
What is included in the product
Detailed Word Document
Delivers a strategic overview of New World Development’s internal and external business factors, outlining strengths, weaknesses, opportunities and threats to assess its competitive position, growth drivers and market risks shaping future performance.
Customizable Excel Spreadsheet
Provides a concise, visual SWOT matrix for New World Development that streamlines strategic alignment and enables quick edits to reflect shifting market priorities for fast stakeholder decision-making.
Weaknesses
High capital intensity
Large upfront land acquisitions and construction expenditures strain New World Developments balance sheet, with long payback cycles increasing sensitivity to interest-rate swings and market downturns. Working capital demands spike during construction peaks, forcing short-term funding or higher drawdowns on facilities. Timing mismatches between project outflows and sales inflows complicate deleveraging and raise refinancing risk.
Cyclical exposure
Revenue and margins at New World Development are highly sensitive to HK and China property cycles, so downturns compress development margins and land-sale timing; China grew 5.2% in 2023, underscoring cyclical exposure to macro swings. Sales slowdowns rapidly hit cash collections and inventory turns, pressuring working capital. Hospitality and retail earnings swing with tourism—HK saw about 18.2 million visitor arrivals in 2023—while infrastructure tariffs and volumes can soften in downturns.
Complex portfolio management
New World Development (HKEX: 0017) runs multi-segment operations across 5+ markets, raising execution risk as development, leasing and operations must be coordinated across jurisdictions. Governance and oversight costs rise with organizational complexity, while project delays or cost overruns in one asset can cascade through the pipeline and strain group resources. This complexity can dilute managerial focus and slow capital recycling.
Regulatory dependence
Regulatory dependence compresses New World Development margins as land policies, pre-sale rules and price controls limit pricing flexibility and lock in lower returns; zoning and environmental approvals routinely extend project timelines, raising financing costs. Infrastructure concessions face policy and tariff resets that can erode long-term cash flows, while growing compliance burdens lift operating costs and increase project uncertainty.
- Land policy constraints
- Pre-sale & price caps
- Zoning/environment delays
- Concession tariff risk
- Rising compliance costs
Currency and concentration risks
Earnings concentrated in HKD and RMB leave New World Development exposed to FX and purchasing-power shifts; HKD remains pegged to USD since 1983 while RMB was about 3% of global payments in 2024, limiting currency diversification.
Heavy reliance on Greater China amplifies localized shocks and property-cycle risk; cross-border remittances and Chinese capital controls can constrain cash mobility and strategic flexibility.
Hedging programs reduce volatility but cannot fully remove translation, basis and regulatory exposures.
- currency: HKD peg since 1983, RMB ~3% global payments (2024)
- geography: concentration in Greater China heightens local shock risk
- capital controls: remittance limits can restrict liquidity
- hedging: mitigates but does not eliminate FX exposure
High upfront costs and FX/regulatory exposure drive long payback and refinancing risk
Large upfront land and construction costs create long payback cycles and refinancing sensitivity; project timing mismatches strain working capital. Earnings are cyclical—China GDP +5.2% (2023) and HK visitors 18.2m (2023) show market dependence—while multi-segment, 5+ market operations raise execution and governance risk. Regulatory, tariff and FX (RMB ~3% global payments, 2024; HKD peg since 1983) exposures limit pricing flexibility.
| Metric | Value | Year/Source |
|---|---|---|
| China GDP growth | +5.2% | 2023 |
| HK visitor arrivals | 18.2m | 2023 |
| RMB share global payments | ~3% | 2024 |
| Markets | 5+ | Group disclosure |
Preview the Actual Deliverable
New World Development SWOT Analysis
This is a live preview of the actual New World Development SWOT analysis you’ll receive upon purchase—no surprises, just professional quality. The excerpt below is pulled directly from the full, editable report. The complete document becomes available immediately after checkout.











