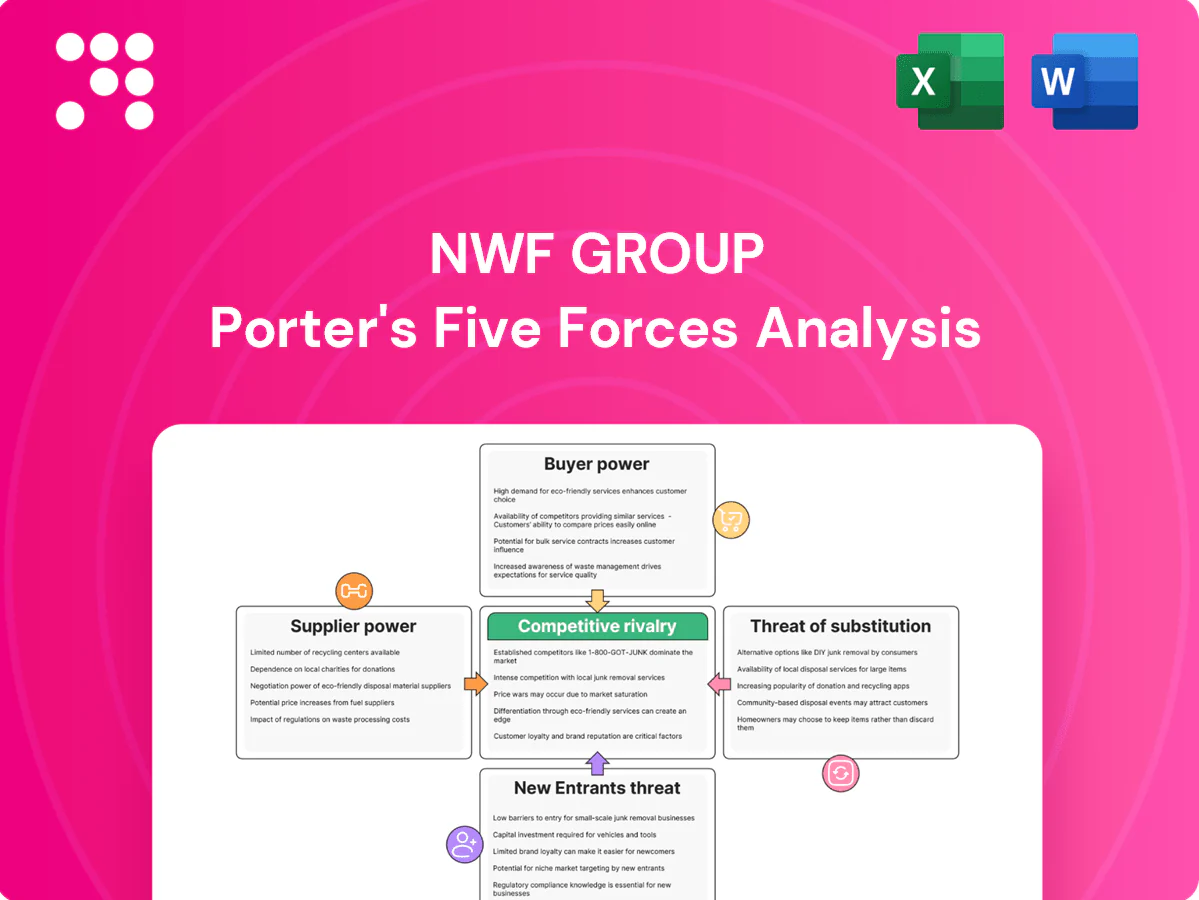
NWF Group Porter's Five Forces Analysis

Don't Miss the Bigger Picture
NWF Group's Porter's Five Forces snapshot highlights moderate buyer power, consolidated suppliers, niche substitute threats, and barriers limiting entrants, shaping a defensible yet competitive position. This brief shows strategic pressure points and growth levers. Unlock the full Porter's Five Forces Analysis to explore force-by-force ratings, visuals, and actionable recommendations.
Suppliers Bargaining Power

Refiners & fuel wholesalers concentrated
The Fuels division relies on a limited pool of UK/European refiners and large wholesalers, giving suppliers leverage on price and allocation in tight markets. Top five oil traders still handle c.60% of seaborne crude flows in 2024, so OPEC moves, refinery outages and FX swings flow straight into supply terms. Winter allocation control can force NWF to accept tighter margins; multi‑sourcing and hedging help but cannot fully neutralize concentration risk.
Commodity volatility in feed inputs
Feeds rely on grains, oilseed meals and additives bought on global markets where 2024 CBOT prices averaged about $5.50/bu for corn and $12.50/bu for soybeans, driving volatility that lets suppliers pass costs quickly and squeeze feed gross margins. Origin risks — weather disruptions, Black Sea geopolitics and freight spikes — amplify supplier bargaining power, though NWF-style forward purchasing and formulation flexibility limit short-term exposure.

Specialist equipment, fleet, and parts
Tanker trucks, HGVs and specialist handling kit are concentrated among a few OEMs (Daimler/Mercedes, Volvo, Scania, MAN, Iveco), giving suppliers leverage. Lead times commonly run 6–12 months and tightening emissions rules plus bespoke financing raise switching costs. Parts shortages directly dent uptime and service KPIs. Long-term fleet contracts and preventative maintenance materially lower disruption risk.

Energy and storage cost inputs
Power, fuel and warehousing inputs are supplied by utilities and landlords with moderate leverage; energy cost spikes in 2022–23 left operating costs for depot networks elevated and in 2024 remained roughly 20% above pre‑pandemic 2019 baselines, compressing margins and raising sensitivity to fuel price moves.
Renegotiation cycles can reset cost bases unfavorably, while targeted on‑site energy efficiency and selective ownership of warehouses materially reduce exposure and insulating capex needs.
- Supplier leverage: moderate
- 2024 energy cost vs 2019: ~+20%
- Risk: contract reset on renegotiation
- Mitigant: efficiency and selective ownership
Compliance-driven dependencies
Compliance-driven dependencies raise supplier power for NWF Group because accredited labs, specialist packaging, pallets and compliance services (ADR, BRC) are niche providers. Certification audit cycles are typically annual and in 2024 renewal windows concentrate leverage for suppliers during contract renegotiations. Building dual-supply and maintaining certifications preserves optionality and reduces switching friction.
- Accredited labs: niche capacity, audit-led access
- Certification timelines: annual audits, multi-week lead times
- Renewal cycles: increase supplier leverage in 2024
- Mitigation: dual-sourcing and retained certifications
Supplier power moderate-to-high: concentrated fuels, rising feed costs, long OEM lead times
Supplier power for NWF is moderate‑to‑high: fuels exposure is acute as top five traders handle c.60% of seaborne crude in 2024, feeding volatility into margins; feed costs reflect CBOT averages in 2024 of ~$5.50/bu corn and ~$12.50/bu soybeans; transport OEM lead times 6–12 months raise switching costs. Energy costs remain ~+20% vs 2019, while certifications and niche services concentrate leverage.
| Metric | 2024 |
|---|---|
| Top traders share | ~60% |
| Corn (CBOT) | $5.50/bu |
| Soybean (CBOT) | $12.50/bu |
| Energy vs 2019 | +20% |
| OEM lead times | 6–12 months |
What is included in the product
 Detailed Word Document
Tailored Porter's Five Forces analysis for NWF Group uncovering key drivers of competition, supplier and buyer power, threat of substitutes, and entry barriers, with strategic commentary on emerging disruptors and market risks.

 Customizable Excel Spreadsheet
A concise one-sheet Porter's Five Forces for NWF Group that highlights supplier/customer power, competitive rivalry, new entrants and substitutes—ideal for quick strategic decisions; editable pressure sliders and a radar chart let you run scenarios and adapt to market shifts without complex tools.
Customers Bargaining Power

Large food manufacturers & retailers strong
Boughey’s ambient logistics customers are highly concentrated and professional, with UK grocery top four retailers holding c.60% of the market (2024), so tenders drive fierce price and SLA negotiation. Buyers demand sharp pricing, tight KPIs and penalty clauses; contract sizes and durations give them leverage. Reliability and value-added services (temperature control, labelling, reverse logistics) help Boughey mitigate price pressure and retain volume.
Farmers are price-sensitive yet sticky
Feed customers are highly cost-focused amid tight farm economics—DEFRA reported average farm business income in England at £68,000 in 2023–24—yet purchases remain sticky because nutrition support, reliable delivery and measurable herd performance create moderate switching costs. Seasonal demand spikes and credit terms act as primary bargaining levers. Robust technical advisory services and performance data reduce pure price comparison and raise customer retention.

Domestic and SME fuel buyers fragmented
Households (c.28 million) and c.5.5 million SMEs in the UK (ONS 2024) are numerous and fragmented, limiting individual bargaining power against NWF. Yet widespread online price comparison and dense local fuel competition increase price sensitivity and margin pressure. Faster delivery expectations raise service costs, while loyalty schemes and route optimization help protect margins and reduce distribution unit costs.

Contractual terms shift risk to NWF
In logistics and feeds customers push indexation, fuel surcharges and service credits that shift volatility and performance risk onto NWF, often leaving the group to absorb margin swings; longer contracts (typically 3–5 years) can trade price for guaranteed volume, securing ~10–15% lower unit rates in market practice.
- Indexation and surcharges: passes risk to NWF
- Service credits: penalise performance
- 3–5 year contracts: volume security vs price
- Careful pricing formulas and capacity discipline critical
Switching costs are tangible but manageable
Switching costs for NWF customers stem from data integration, bespoke farm rations and warehouse onboarding, creating frictions that are manageable rather than prohibitive.
Competitors can match specifications and product collections at tender points, making price and terms pivotal; service differentiation tends to delay churn between buying cycles.
Continuous operational and product improvement is required to retain key accounts and defend margins.
- data-integration: onboarding delays create short-term stickiness
- farm-rations: tailored formulations lower immediate switching
- warehouse-onboarding: logistical setup is reversible
- service-differentiation: reduces churn within cycles
Top4 ≈60%; farms £68,000; 3-5y deals -10–15%
Bargaining power is high with concentrated grocery buyers (top four ≈60% UK market, 2024) and cost-pressured feed clients (avg farm business income England £68,000 2023–24), driving tight pricing, KPIs and surcharges. Fragmented household/SME base (≈28m households; 5.5m SMEs, ONS 2024) limits individual power but raises price sensitivity. 3–5y contracts trade price for volume (~10–15% lower unit rates).
| Metric | Value |
|---|---|
| Top4 grocery share (2024) | ≈60% |
| Avg farm income (2023–24) | £68,000 |
| Households (UK) | ≈28m |
| SMEs (UK) | ≈5.5m |
Preview the Actual Deliverable
NWF Group Porter's Five Forces Analysis
This preview shows the exact Porter's Five Forces analysis of NWF Group you'll receive—comprehensive, professionally written, and specific to the company. The document displayed is the final, fully formatted file ready for immediate download after purchase. No placeholders or samples—what you see is the deliverable.

Don't Miss the Bigger Picture
NWF Group's Porter's Five Forces snapshot highlights moderate buyer power, consolidated suppliers, niche substitute threats, and barriers limiting entrants, shaping a defensible yet competitive position. This brief shows strategic pressure points and growth levers. Unlock the full Porter's Five Forces Analysis to explore force-by-force ratings, visuals, and actionable recommendations.
Suppliers Bargaining Power
Refiners & fuel wholesalers concentrated
The Fuels division relies on a limited pool of UK/European refiners and large wholesalers, giving suppliers leverage on price and allocation in tight markets. Top five oil traders still handle c.60% of seaborne crude flows in 2024, so OPEC moves, refinery outages and FX swings flow straight into supply terms. Winter allocation control can force NWF to accept tighter margins; multi‑sourcing and hedging help but cannot fully neutralize concentration risk.
Commodity volatility in feed inputs
Feeds rely on grains, oilseed meals and additives bought on global markets where 2024 CBOT prices averaged about $5.50/bu for corn and $12.50/bu for soybeans, driving volatility that lets suppliers pass costs quickly and squeeze feed gross margins. Origin risks — weather disruptions, Black Sea geopolitics and freight spikes — amplify supplier bargaining power, though NWF-style forward purchasing and formulation flexibility limit short-term exposure.
Specialist equipment, fleet, and parts
Tanker trucks, HGVs and specialist handling kit are concentrated among a few OEMs (Daimler/Mercedes, Volvo, Scania, MAN, Iveco), giving suppliers leverage. Lead times commonly run 6–12 months and tightening emissions rules plus bespoke financing raise switching costs. Parts shortages directly dent uptime and service KPIs. Long-term fleet contracts and preventative maintenance materially lower disruption risk.
Energy and storage cost inputs
Power, fuel and warehousing inputs are supplied by utilities and landlords with moderate leverage; energy cost spikes in 2022–23 left operating costs for depot networks elevated and in 2024 remained roughly 20% above pre‑pandemic 2019 baselines, compressing margins and raising sensitivity to fuel price moves.
Renegotiation cycles can reset cost bases unfavorably, while targeted on‑site energy efficiency and selective ownership of warehouses materially reduce exposure and insulating capex needs.
- Supplier leverage: moderate
- 2024 energy cost vs 2019: ~+20%
- Risk: contract reset on renegotiation
- Mitigant: efficiency and selective ownership
Compliance-driven dependencies
Compliance-driven dependencies raise supplier power for NWF Group because accredited labs, specialist packaging, pallets and compliance services (ADR, BRC) are niche providers. Certification audit cycles are typically annual and in 2024 renewal windows concentrate leverage for suppliers during contract renegotiations. Building dual-supply and maintaining certifications preserves optionality and reduces switching friction.
- Accredited labs: niche capacity, audit-led access
- Certification timelines: annual audits, multi-week lead times
- Renewal cycles: increase supplier leverage in 2024
- Mitigation: dual-sourcing and retained certifications
Supplier power moderate-to-high: concentrated fuels, rising feed costs, long OEM lead times
Supplier power for NWF is moderate‑to‑high: fuels exposure is acute as top five traders handle c.60% of seaborne crude in 2024, feeding volatility into margins; feed costs reflect CBOT averages in 2024 of ~$5.50/bu corn and ~$12.50/bu soybeans; transport OEM lead times 6–12 months raise switching costs. Energy costs remain ~+20% vs 2019, while certifications and niche services concentrate leverage.
| Metric | 2024 |
|---|---|
| Top traders share | ~60% |
| Corn (CBOT) | $5.50/bu |
| Soybean (CBOT) | $12.50/bu |
| Energy vs 2019 | +20% |
| OEM lead times | 6–12 months |
What is included in the product
Detailed Word Document
Tailored Porter's Five Forces analysis for NWF Group uncovering key drivers of competition, supplier and buyer power, threat of substitutes, and entry barriers, with strategic commentary on emerging disruptors and market risks.
Customizable Excel Spreadsheet
A concise one-sheet Porter's Five Forces for NWF Group that highlights supplier/customer power, competitive rivalry, new entrants and substitutes—ideal for quick strategic decisions; editable pressure sliders and a radar chart let you run scenarios and adapt to market shifts without complex tools.
Customers Bargaining Power
Large food manufacturers & retailers strong
Boughey’s ambient logistics customers are highly concentrated and professional, with UK grocery top four retailers holding c.60% of the market (2024), so tenders drive fierce price and SLA negotiation. Buyers demand sharp pricing, tight KPIs and penalty clauses; contract sizes and durations give them leverage. Reliability and value-added services (temperature control, labelling, reverse logistics) help Boughey mitigate price pressure and retain volume.
Farmers are price-sensitive yet sticky
Feed customers are highly cost-focused amid tight farm economics—DEFRA reported average farm business income in England at £68,000 in 2023–24—yet purchases remain sticky because nutrition support, reliable delivery and measurable herd performance create moderate switching costs. Seasonal demand spikes and credit terms act as primary bargaining levers. Robust technical advisory services and performance data reduce pure price comparison and raise customer retention.
Domestic and SME fuel buyers fragmented
Households (c.28 million) and c.5.5 million SMEs in the UK (ONS 2024) are numerous and fragmented, limiting individual bargaining power against NWF. Yet widespread online price comparison and dense local fuel competition increase price sensitivity and margin pressure. Faster delivery expectations raise service costs, while loyalty schemes and route optimization help protect margins and reduce distribution unit costs.
Contractual terms shift risk to NWF
In logistics and feeds customers push indexation, fuel surcharges and service credits that shift volatility and performance risk onto NWF, often leaving the group to absorb margin swings; longer contracts (typically 3–5 years) can trade price for guaranteed volume, securing ~10–15% lower unit rates in market practice.
- Indexation and surcharges: passes risk to NWF
- Service credits: penalise performance
- 3–5 year contracts: volume security vs price
- Careful pricing formulas and capacity discipline critical
Switching costs are tangible but manageable
Switching costs for NWF customers stem from data integration, bespoke farm rations and warehouse onboarding, creating frictions that are manageable rather than prohibitive.
Competitors can match specifications and product collections at tender points, making price and terms pivotal; service differentiation tends to delay churn between buying cycles.
Continuous operational and product improvement is required to retain key accounts and defend margins.
- data-integration: onboarding delays create short-term stickiness
- farm-rations: tailored formulations lower immediate switching
- warehouse-onboarding: logistical setup is reversible
- service-differentiation: reduces churn within cycles
Top4 ≈60%; farms £68,000; 3-5y deals -10–15%
Bargaining power is high with concentrated grocery buyers (top four ≈60% UK market, 2024) and cost-pressured feed clients (avg farm business income England £68,000 2023–24), driving tight pricing, KPIs and surcharges. Fragmented household/SME base (≈28m households; 5.5m SMEs, ONS 2024) limits individual power but raises price sensitivity. 3–5y contracts trade price for volume (~10–15% lower unit rates).
| Metric | Value |
|---|---|
| Top4 grocery share (2024) | ≈60% |
| Avg farm income (2023–24) | £68,000 |
| Households (UK) | ≈28m |
| SMEs (UK) | ≈5.5m |
Preview the Actual Deliverable
NWF Group Porter's Five Forces Analysis
This preview shows the exact Porter's Five Forces analysis of NWF Group you'll receive—comprehensive, professionally written, and specific to the company. The document displayed is the final, fully formatted file ready for immediate download after purchase. No placeholders or samples—what you see is the deliverable.
Original: $10.00
-65%$10.00
$3.50Description
Don't Miss the Bigger Picture
NWF Group's Porter's Five Forces snapshot highlights moderate buyer power, consolidated suppliers, niche substitute threats, and barriers limiting entrants, shaping a defensible yet competitive position. This brief shows strategic pressure points and growth levers. Unlock the full Porter's Five Forces Analysis to explore force-by-force ratings, visuals, and actionable recommendations.
Suppliers Bargaining Power
Refiners & fuel wholesalers concentrated
The Fuels division relies on a limited pool of UK/European refiners and large wholesalers, giving suppliers leverage on price and allocation in tight markets. Top five oil traders still handle c.60% of seaborne crude flows in 2024, so OPEC moves, refinery outages and FX swings flow straight into supply terms. Winter allocation control can force NWF to accept tighter margins; multi‑sourcing and hedging help but cannot fully neutralize concentration risk.
Commodity volatility in feed inputs
Feeds rely on grains, oilseed meals and additives bought on global markets where 2024 CBOT prices averaged about $5.50/bu for corn and $12.50/bu for soybeans, driving volatility that lets suppliers pass costs quickly and squeeze feed gross margins. Origin risks — weather disruptions, Black Sea geopolitics and freight spikes — amplify supplier bargaining power, though NWF-style forward purchasing and formulation flexibility limit short-term exposure.
Specialist equipment, fleet, and parts
Tanker trucks, HGVs and specialist handling kit are concentrated among a few OEMs (Daimler/Mercedes, Volvo, Scania, MAN, Iveco), giving suppliers leverage. Lead times commonly run 6–12 months and tightening emissions rules plus bespoke financing raise switching costs. Parts shortages directly dent uptime and service KPIs. Long-term fleet contracts and preventative maintenance materially lower disruption risk.
Energy and storage cost inputs
Power, fuel and warehousing inputs are supplied by utilities and landlords with moderate leverage; energy cost spikes in 2022–23 left operating costs for depot networks elevated and in 2024 remained roughly 20% above pre‑pandemic 2019 baselines, compressing margins and raising sensitivity to fuel price moves.
Renegotiation cycles can reset cost bases unfavorably, while targeted on‑site energy efficiency and selective ownership of warehouses materially reduce exposure and insulating capex needs.
- Supplier leverage: moderate
- 2024 energy cost vs 2019: ~+20%
- Risk: contract reset on renegotiation
- Mitigant: efficiency and selective ownership
Compliance-driven dependencies
Compliance-driven dependencies raise supplier power for NWF Group because accredited labs, specialist packaging, pallets and compliance services (ADR, BRC) are niche providers. Certification audit cycles are typically annual and in 2024 renewal windows concentrate leverage for suppliers during contract renegotiations. Building dual-supply and maintaining certifications preserves optionality and reduces switching friction.
- Accredited labs: niche capacity, audit-led access
- Certification timelines: annual audits, multi-week lead times
- Renewal cycles: increase supplier leverage in 2024
- Mitigation: dual-sourcing and retained certifications
Supplier power moderate-to-high: concentrated fuels, rising feed costs, long OEM lead times
Supplier power for NWF is moderate‑to‑high: fuels exposure is acute as top five traders handle c.60% of seaborne crude in 2024, feeding volatility into margins; feed costs reflect CBOT averages in 2024 of ~$5.50/bu corn and ~$12.50/bu soybeans; transport OEM lead times 6–12 months raise switching costs. Energy costs remain ~+20% vs 2019, while certifications and niche services concentrate leverage.
| Metric | 2024 |
|---|---|
| Top traders share | ~60% |
| Corn (CBOT) | $5.50/bu |
| Soybean (CBOT) | $12.50/bu |
| Energy vs 2019 | +20% |
| OEM lead times | 6–12 months |
What is included in the product
Detailed Word Document
Tailored Porter's Five Forces analysis for NWF Group uncovering key drivers of competition, supplier and buyer power, threat of substitutes, and entry barriers, with strategic commentary on emerging disruptors and market risks.
Customizable Excel Spreadsheet
A concise one-sheet Porter's Five Forces for NWF Group that highlights supplier/customer power, competitive rivalry, new entrants and substitutes—ideal for quick strategic decisions; editable pressure sliders and a radar chart let you run scenarios and adapt to market shifts without complex tools.
Customers Bargaining Power
Large food manufacturers & retailers strong
Boughey’s ambient logistics customers are highly concentrated and professional, with UK grocery top four retailers holding c.60% of the market (2024), so tenders drive fierce price and SLA negotiation. Buyers demand sharp pricing, tight KPIs and penalty clauses; contract sizes and durations give them leverage. Reliability and value-added services (temperature control, labelling, reverse logistics) help Boughey mitigate price pressure and retain volume.
Farmers are price-sensitive yet sticky
Feed customers are highly cost-focused amid tight farm economics—DEFRA reported average farm business income in England at £68,000 in 2023–24—yet purchases remain sticky because nutrition support, reliable delivery and measurable herd performance create moderate switching costs. Seasonal demand spikes and credit terms act as primary bargaining levers. Robust technical advisory services and performance data reduce pure price comparison and raise customer retention.
Domestic and SME fuel buyers fragmented
Households (c.28 million) and c.5.5 million SMEs in the UK (ONS 2024) are numerous and fragmented, limiting individual bargaining power against NWF. Yet widespread online price comparison and dense local fuel competition increase price sensitivity and margin pressure. Faster delivery expectations raise service costs, while loyalty schemes and route optimization help protect margins and reduce distribution unit costs.
Contractual terms shift risk to NWF
In logistics and feeds customers push indexation, fuel surcharges and service credits that shift volatility and performance risk onto NWF, often leaving the group to absorb margin swings; longer contracts (typically 3–5 years) can trade price for guaranteed volume, securing ~10–15% lower unit rates in market practice.
- Indexation and surcharges: passes risk to NWF
- Service credits: penalise performance
- 3–5 year contracts: volume security vs price
- Careful pricing formulas and capacity discipline critical
Switching costs are tangible but manageable
Switching costs for NWF customers stem from data integration, bespoke farm rations and warehouse onboarding, creating frictions that are manageable rather than prohibitive.
Competitors can match specifications and product collections at tender points, making price and terms pivotal; service differentiation tends to delay churn between buying cycles.
Continuous operational and product improvement is required to retain key accounts and defend margins.
- data-integration: onboarding delays create short-term stickiness
- farm-rations: tailored formulations lower immediate switching
- warehouse-onboarding: logistical setup is reversible
- service-differentiation: reduces churn within cycles
Top4 ≈60%; farms £68,000; 3-5y deals -10–15%
Bargaining power is high with concentrated grocery buyers (top four ≈60% UK market, 2024) and cost-pressured feed clients (avg farm business income England £68,000 2023–24), driving tight pricing, KPIs and surcharges. Fragmented household/SME base (≈28m households; 5.5m SMEs, ONS 2024) limits individual power but raises price sensitivity. 3–5y contracts trade price for volume (~10–15% lower unit rates).
| Metric | Value |
|---|---|
| Top4 grocery share (2024) | ≈60% |
| Avg farm income (2023–24) | £68,000 |
| Households (UK) | ≈28m |
| SMEs (UK) | ≈5.5m |
Preview the Actual Deliverable
NWF Group Porter's Five Forces Analysis
This preview shows the exact Porter's Five Forces analysis of NWF Group you'll receive—comprehensive, professionally written, and specific to the company. The document displayed is the final, fully formatted file ready for immediate download after purchase. No placeholders or samples—what you see is the deliverable.











