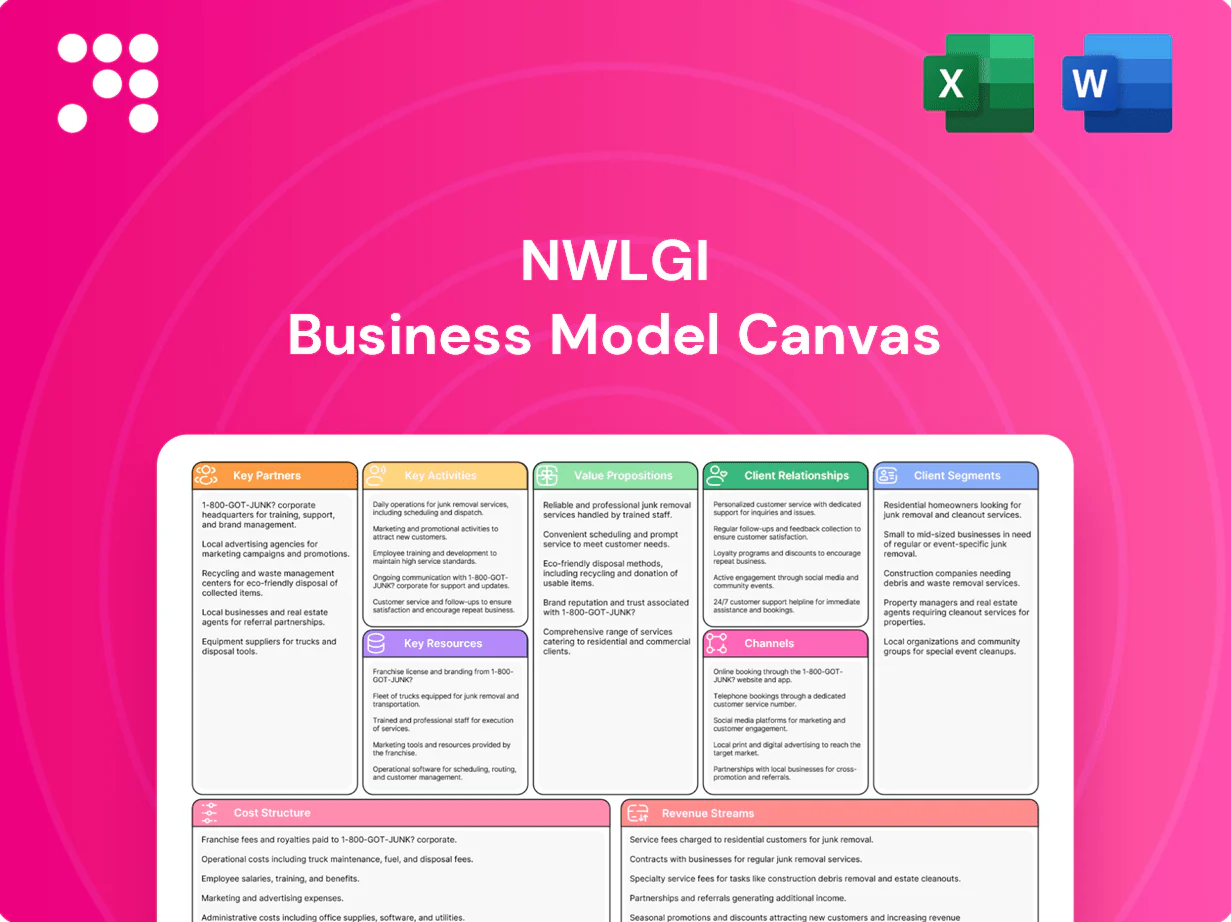
NWLGI Business Model Canvas

Unlock a strategic Business Model Canvas for investors and founders
Unlock NWLGI's strategic blueprint with our Business Model Canvas. This concise yet thorough canvas maps value propositions, customer segments, key partners, revenue streams and cost structure to show how NWLGI wins market share and scales. Ideal for investors, founders and analysts—download the full Word/Excel pack for a section-by-section breakdown and actionable insights.
Partnerships

Independent agent and broker network
Independent agents and brokers expand NWLGI’s market reach and deliver personalized sales and service, driving local prospecting and customer retention; 2024 industry data show independent channels still account for roughly half of new commercial and personal lines placements. Their local market knowledge improves risk matching and underwriting efficiency, while strong agent relationships lift placement rates and policy persistency, often outperforming direct channels.
Reinsurance providers
Reinsurance providers share mortality and longevity risks with NWLGI, transferring blocks to improve capital efficiency and enabling product innovation; the global reinsurance market reached about $380 billion in premiums in 2024, supporting larger life-capacity. Structured treaties stabilize earnings, with quota-share and longevity swaps protecting solvency and smoothing capital requirements.

Distribution alliances and IMOs/FMOs
Distribution alliances with IMOs/FMOs aggregate thousands of independent producers, offering training and compliance support that accelerates rollouts and geographic penetration; the U.S. annuity and life markets exceeded 300 billion in annual sales in 2023–24, highlighting scale. Preferred contracts with IMOs/FMOs demonstrably boost volume and case quality through prioritized underwriting and product placement, improving producer retention and average case size.

Technology and data vendors
Policy administration, underwriting, and analytics platforms drive automation and reduce cycle times; digital underwriting and analytics cut manual steps and improve risk selection. Digital tools enable e-apps, e-signature and straight-through processing, with 60% of carriers using e-app/e-sign workflows in 2024. Cybersecurity partners protect sensitive customer data as cyber insurance premiums topped $10 billion in 2024.
- Efficiency: policy admin + analytics
- Digital: e-apps, e-sign, STP (60% adoption 2024)
- Security: cybersecurity partners; cyber premiums > $10B (2024)
Banking, custodial, and compliance partners
Banks and custodians enable rapid premium processing and annuity funding, supporting e-settlement workflows that cut issuance times to days; US life insurers held roughly 12.0 trillion dollars in assets in 2024, underscoring custody scale. Legal and compliance firms manage multi-state and international licensing and tax regimes, while medical exam and lab vendors streamline underwriting with electronic report delivery.
- Bank custody: scales to trillions (US life insurers ~12.0T, 2024)
- Premium processing: 48–72 hour e-settlement norms
- Compliance: multi-state + cross-border licensing
- Underwriting: e-reports from labs and telemedical exams
Agents drive ~50% placements; reinsurers $380B stabilize
Independent agents/brokers drive ~50% of new placements, boosting local prospecting, placement rates and persistency.
Reinsurers (global premiums ~$380B in 2024) enable capital relief and longevity solutions, stabilizing earnings via quota-share and swaps.
IMOs/FMOs accelerate distribution in a >$300B US annuity/life market (2023–24), improving case quality and producer retention.
Tech, custody and cyber partners cut cycle times (e-settlement 48–72h), enable 60% e-app adoption (2024), and protect data (cyber premiums >$10B, 2024).
| Partner | Metric (2024) |
|---|---|
| Agents/Brokers | ~50% new placements |
| Reinsurers | $380B premiums |
| IMOs/FMOs | >$300B market |
| Tech/Custody/Cyber | 60% e-app; 48–72h e-settlement; cyber >$10B; US insurers assets $12.0T |
What is included in the product
 Detailed Word Document
A comprehensive, pre-written Business Model Canvas tailored to NWLGI that maps all 9 blocks with detailed customer segments, channels, value propositions, revenue streams and cost structure; includes competitive advantage analysis and linked SWOT, ideal for investor presentations, bank funding and strategic decision-making.

 Customizable Excel Spreadsheet
Streamlines strategy by condensing your company model into an editable one-page canvas that eliminates hours of formatting and aligns teams quickly. Ideal for brainstorming, board presentations, and side-by-side comparisons to resolve misalignment and speed decision-making.
Activities

Product design and pricing
Actuarial teams design life and annuity products tailored to customer needs, targeting a 12–15% pricing ROE in 2024 while observing capital constraints. Pricing models balance mortality, morbidity and market risk against regulatory capital (solvency ratios ~150%). Ongoing quarterly experience studies (sample sizes >100,000 policies) refine assumptions, e.g., mortality improvement ~0.5% p.a., and update reserves accordingly.
Underwriting and risk selection
Medical and financial underwriting at NWLGI improves portfolio quality by tightening adverse selection and aligning pricing to risk, contributing to lower lapse and claim volatility; industry studies in 2024 show risk-based underwriting can reduce loss ratios by up to 10% in targeted segments. Automation and accelerated programs shorten cycle times—McKinsey 2024 found digital underwriting can cut decision time by up to 50%—increasing conversion and reducing acquisition costs. Strategic reinsurance placement, commonly ceding 10–30% of peak exposures, optimizes case economics by lowering capital strain and smoothing earnings volatility.

Investment management of reserves
General account assets are managed for yield and ALM, targeting income above benchmark as 10-year US Treasury yields hovered near 4.3–4.6% in 2024. Duration matching and strict credit risk controls (senior IG bias, limits by issuer and rating) protect solvency and regulatory capital ratios. Active portfolio rebalancing reacts to rate shifts and spread movements, with liquid government securities and IG corporates used to adjust duration and credit exposure.

Distribution enablement and sales support
Training, illustrations and case design support producers to raise quote accuracy and productivity; McKinsey notes distributor enablement can lift sales productivity up to 30% (2023). Marketing campaigns target and generate qualified leads with typical MQL-to-SQL conversion ~10–15% (industry benchmarks 2023–24). New-business operations drive same-day issuance targets and aim for <2% post-issue error rates.
- Training: productivity +30% (McKinsey 2023)
- Marketing: MQL→SQL ~10–15% (2023–24)
- Operations: same-day issuance; <2% errors
Policy administration and service
Policy administration and service covers billing, claims, and in-force changes to keep policyholder satisfaction high; industry data (2024) shows automation can cut claims cycle times by ~40% and improve NPS by ~8 points. Robust compliance reporting and audit readiness reduce regulatory risk and have helped firms lower fine exposure by ~15% year-over-year. Digital self-service handles roughly 60% of routine interactions and can lower cost-to-serve by up to 30%.
- Billing accuracy: reduces leakage, boosts retention
- Claims automation: ~40% faster cycle
- Compliance/audit: ~15% lower fine exposure
- Digital self-service: ~60% interactions, ~30% cost-to-serve
12–15% ROE, ~150% solvency, -50% UW time
Actuarial pricing targets 12–15% ROE in 2024 with solvency ~150% and mortality improvement ~0.5% p.a. Underwriting and reinsurance lower loss ratios (~10% improvement) and cut decision time (digital underwriting ~-50%). Asset ALM targets beat 10y US Treasuries (4.3–4.6% in 2024) while ops aim same-day issuance, <2% post-issue errors, claims automation ~-40% cycle time.
| Metric | 2024 value |
|---|---|
| Pricing ROE | 12–15% |
| Solvency | ~150% |
| Mortality imp. | ~0.5% p.a. |
| Underwriting impact | -10% loss ratio |
| Digital underwriting | -50% time |
| 10y Treasury | 4.3–4.6% |
| Issuance errors | <2% |
| Claims cycle | -40% |
| Digital self-service | 60% |
Full Version Awaits
Business Model Canvas
The document you're previewing is the actual NWLGI Business Model Canvas, not a mockup or sample. When you purchase, you'll receive this exact file—complete, fully editable and formatted—ready to download in Word and Excel. No hidden pages, no surprises.

Unlock a strategic Business Model Canvas for investors and founders
Unlock NWLGI's strategic blueprint with our Business Model Canvas. This concise yet thorough canvas maps value propositions, customer segments, key partners, revenue streams and cost structure to show how NWLGI wins market share and scales. Ideal for investors, founders and analysts—download the full Word/Excel pack for a section-by-section breakdown and actionable insights.
Partnerships
Independent agent and broker network
Independent agents and brokers expand NWLGI’s market reach and deliver personalized sales and service, driving local prospecting and customer retention; 2024 industry data show independent channels still account for roughly half of new commercial and personal lines placements. Their local market knowledge improves risk matching and underwriting efficiency, while strong agent relationships lift placement rates and policy persistency, often outperforming direct channels.
Reinsurance providers
Reinsurance providers share mortality and longevity risks with NWLGI, transferring blocks to improve capital efficiency and enabling product innovation; the global reinsurance market reached about $380 billion in premiums in 2024, supporting larger life-capacity. Structured treaties stabilize earnings, with quota-share and longevity swaps protecting solvency and smoothing capital requirements.
Distribution alliances and IMOs/FMOs
Distribution alliances with IMOs/FMOs aggregate thousands of independent producers, offering training and compliance support that accelerates rollouts and geographic penetration; the U.S. annuity and life markets exceeded 300 billion in annual sales in 2023–24, highlighting scale. Preferred contracts with IMOs/FMOs demonstrably boost volume and case quality through prioritized underwriting and product placement, improving producer retention and average case size.
Technology and data vendors
Policy administration, underwriting, and analytics platforms drive automation and reduce cycle times; digital underwriting and analytics cut manual steps and improve risk selection. Digital tools enable e-apps, e-signature and straight-through processing, with 60% of carriers using e-app/e-sign workflows in 2024. Cybersecurity partners protect sensitive customer data as cyber insurance premiums topped $10 billion in 2024.
- Efficiency: policy admin + analytics
- Digital: e-apps, e-sign, STP (60% adoption 2024)
- Security: cybersecurity partners; cyber premiums > $10B (2024)
Banking, custodial, and compliance partners
Banks and custodians enable rapid premium processing and annuity funding, supporting e-settlement workflows that cut issuance times to days; US life insurers held roughly 12.0 trillion dollars in assets in 2024, underscoring custody scale. Legal and compliance firms manage multi-state and international licensing and tax regimes, while medical exam and lab vendors streamline underwriting with electronic report delivery.
- Bank custody: scales to trillions (US life insurers ~12.0T, 2024)
- Premium processing: 48–72 hour e-settlement norms
- Compliance: multi-state + cross-border licensing
- Underwriting: e-reports from labs and telemedical exams
Agents drive ~50% placements; reinsurers $380B stabilize
Independent agents/brokers drive ~50% of new placements, boosting local prospecting, placement rates and persistency.
Reinsurers (global premiums ~$380B in 2024) enable capital relief and longevity solutions, stabilizing earnings via quota-share and swaps.
IMOs/FMOs accelerate distribution in a >$300B US annuity/life market (2023–24), improving case quality and producer retention.
Tech, custody and cyber partners cut cycle times (e-settlement 48–72h), enable 60% e-app adoption (2024), and protect data (cyber premiums >$10B, 2024).
| Partner | Metric (2024) |
|---|---|
| Agents/Brokers | ~50% new placements |
| Reinsurers | $380B premiums |
| IMOs/FMOs | >$300B market |
| Tech/Custody/Cyber | 60% e-app; 48–72h e-settlement; cyber >$10B; US insurers assets $12.0T |
What is included in the product
Detailed Word Document
A comprehensive, pre-written Business Model Canvas tailored to NWLGI that maps all 9 blocks with detailed customer segments, channels, value propositions, revenue streams and cost structure; includes competitive advantage analysis and linked SWOT, ideal for investor presentations, bank funding and strategic decision-making.
Customizable Excel Spreadsheet
Streamlines strategy by condensing your company model into an editable one-page canvas that eliminates hours of formatting and aligns teams quickly. Ideal for brainstorming, board presentations, and side-by-side comparisons to resolve misalignment and speed decision-making.
Activities
Product design and pricing
Actuarial teams design life and annuity products tailored to customer needs, targeting a 12–15% pricing ROE in 2024 while observing capital constraints. Pricing models balance mortality, morbidity and market risk against regulatory capital (solvency ratios ~150%). Ongoing quarterly experience studies (sample sizes >100,000 policies) refine assumptions, e.g., mortality improvement ~0.5% p.a., and update reserves accordingly.
Underwriting and risk selection
Medical and financial underwriting at NWLGI improves portfolio quality by tightening adverse selection and aligning pricing to risk, contributing to lower lapse and claim volatility; industry studies in 2024 show risk-based underwriting can reduce loss ratios by up to 10% in targeted segments. Automation and accelerated programs shorten cycle times—McKinsey 2024 found digital underwriting can cut decision time by up to 50%—increasing conversion and reducing acquisition costs. Strategic reinsurance placement, commonly ceding 10–30% of peak exposures, optimizes case economics by lowering capital strain and smoothing earnings volatility.
Investment management of reserves
General account assets are managed for yield and ALM, targeting income above benchmark as 10-year US Treasury yields hovered near 4.3–4.6% in 2024. Duration matching and strict credit risk controls (senior IG bias, limits by issuer and rating) protect solvency and regulatory capital ratios. Active portfolio rebalancing reacts to rate shifts and spread movements, with liquid government securities and IG corporates used to adjust duration and credit exposure.
Distribution enablement and sales support
Training, illustrations and case design support producers to raise quote accuracy and productivity; McKinsey notes distributor enablement can lift sales productivity up to 30% (2023). Marketing campaigns target and generate qualified leads with typical MQL-to-SQL conversion ~10–15% (industry benchmarks 2023–24). New-business operations drive same-day issuance targets and aim for <2% post-issue error rates.
- Training: productivity +30% (McKinsey 2023)
- Marketing: MQL→SQL ~10–15% (2023–24)
- Operations: same-day issuance; <2% errors
Policy administration and service
Policy administration and service covers billing, claims, and in-force changes to keep policyholder satisfaction high; industry data (2024) shows automation can cut claims cycle times by ~40% and improve NPS by ~8 points. Robust compliance reporting and audit readiness reduce regulatory risk and have helped firms lower fine exposure by ~15% year-over-year. Digital self-service handles roughly 60% of routine interactions and can lower cost-to-serve by up to 30%.
- Billing accuracy: reduces leakage, boosts retention
- Claims automation: ~40% faster cycle
- Compliance/audit: ~15% lower fine exposure
- Digital self-service: ~60% interactions, ~30% cost-to-serve
12–15% ROE, ~150% solvency, -50% UW time
Actuarial pricing targets 12–15% ROE in 2024 with solvency ~150% and mortality improvement ~0.5% p.a. Underwriting and reinsurance lower loss ratios (~10% improvement) and cut decision time (digital underwriting ~-50%). Asset ALM targets beat 10y US Treasuries (4.3–4.6% in 2024) while ops aim same-day issuance, <2% post-issue errors, claims automation ~-40% cycle time.
| Metric | 2024 value |
|---|---|
| Pricing ROE | 12–15% |
| Solvency | ~150% |
| Mortality imp. | ~0.5% p.a. |
| Underwriting impact | -10% loss ratio |
| Digital underwriting | -50% time |
| 10y Treasury | 4.3–4.6% |
| Issuance errors | <2% |
| Claims cycle | -40% |
| Digital self-service | 60% |
Full Version Awaits
Business Model Canvas
The document you're previewing is the actual NWLGI Business Model Canvas, not a mockup or sample. When you purchase, you'll receive this exact file—complete, fully editable and formatted—ready to download in Word and Excel. No hidden pages, no surprises.
Description
Unlock a strategic Business Model Canvas for investors and founders
Unlock NWLGI's strategic blueprint with our Business Model Canvas. This concise yet thorough canvas maps value propositions, customer segments, key partners, revenue streams and cost structure to show how NWLGI wins market share and scales. Ideal for investors, founders and analysts—download the full Word/Excel pack for a section-by-section breakdown and actionable insights.
Partnerships
Independent agent and broker network
Independent agents and brokers expand NWLGI’s market reach and deliver personalized sales and service, driving local prospecting and customer retention; 2024 industry data show independent channels still account for roughly half of new commercial and personal lines placements. Their local market knowledge improves risk matching and underwriting efficiency, while strong agent relationships lift placement rates and policy persistency, often outperforming direct channels.
Reinsurance providers
Reinsurance providers share mortality and longevity risks with NWLGI, transferring blocks to improve capital efficiency and enabling product innovation; the global reinsurance market reached about $380 billion in premiums in 2024, supporting larger life-capacity. Structured treaties stabilize earnings, with quota-share and longevity swaps protecting solvency and smoothing capital requirements.
Distribution alliances and IMOs/FMOs
Distribution alliances with IMOs/FMOs aggregate thousands of independent producers, offering training and compliance support that accelerates rollouts and geographic penetration; the U.S. annuity and life markets exceeded 300 billion in annual sales in 2023–24, highlighting scale. Preferred contracts with IMOs/FMOs demonstrably boost volume and case quality through prioritized underwriting and product placement, improving producer retention and average case size.
Technology and data vendors
Policy administration, underwriting, and analytics platforms drive automation and reduce cycle times; digital underwriting and analytics cut manual steps and improve risk selection. Digital tools enable e-apps, e-signature and straight-through processing, with 60% of carriers using e-app/e-sign workflows in 2024. Cybersecurity partners protect sensitive customer data as cyber insurance premiums topped $10 billion in 2024.
- Efficiency: policy admin + analytics
- Digital: e-apps, e-sign, STP (60% adoption 2024)
- Security: cybersecurity partners; cyber premiums > $10B (2024)
Banking, custodial, and compliance partners
Banks and custodians enable rapid premium processing and annuity funding, supporting e-settlement workflows that cut issuance times to days; US life insurers held roughly 12.0 trillion dollars in assets in 2024, underscoring custody scale. Legal and compliance firms manage multi-state and international licensing and tax regimes, while medical exam and lab vendors streamline underwriting with electronic report delivery.
- Bank custody: scales to trillions (US life insurers ~12.0T, 2024)
- Premium processing: 48–72 hour e-settlement norms
- Compliance: multi-state + cross-border licensing
- Underwriting: e-reports from labs and telemedical exams
Agents drive ~50% placements; reinsurers $380B stabilize
Independent agents/brokers drive ~50% of new placements, boosting local prospecting, placement rates and persistency.
Reinsurers (global premiums ~$380B in 2024) enable capital relief and longevity solutions, stabilizing earnings via quota-share and swaps.
IMOs/FMOs accelerate distribution in a >$300B US annuity/life market (2023–24), improving case quality and producer retention.
Tech, custody and cyber partners cut cycle times (e-settlement 48–72h), enable 60% e-app adoption (2024), and protect data (cyber premiums >$10B, 2024).
| Partner | Metric (2024) |
|---|---|
| Agents/Brokers | ~50% new placements |
| Reinsurers | $380B premiums |
| IMOs/FMOs | >$300B market |
| Tech/Custody/Cyber | 60% e-app; 48–72h e-settlement; cyber >$10B; US insurers assets $12.0T |
What is included in the product
Detailed Word Document
A comprehensive, pre-written Business Model Canvas tailored to NWLGI that maps all 9 blocks with detailed customer segments, channels, value propositions, revenue streams and cost structure; includes competitive advantage analysis and linked SWOT, ideal for investor presentations, bank funding and strategic decision-making.
Customizable Excel Spreadsheet
Streamlines strategy by condensing your company model into an editable one-page canvas that eliminates hours of formatting and aligns teams quickly. Ideal for brainstorming, board presentations, and side-by-side comparisons to resolve misalignment and speed decision-making.
Activities
Product design and pricing
Actuarial teams design life and annuity products tailored to customer needs, targeting a 12–15% pricing ROE in 2024 while observing capital constraints. Pricing models balance mortality, morbidity and market risk against regulatory capital (solvency ratios ~150%). Ongoing quarterly experience studies (sample sizes >100,000 policies) refine assumptions, e.g., mortality improvement ~0.5% p.a., and update reserves accordingly.
Underwriting and risk selection
Medical and financial underwriting at NWLGI improves portfolio quality by tightening adverse selection and aligning pricing to risk, contributing to lower lapse and claim volatility; industry studies in 2024 show risk-based underwriting can reduce loss ratios by up to 10% in targeted segments. Automation and accelerated programs shorten cycle times—McKinsey 2024 found digital underwriting can cut decision time by up to 50%—increasing conversion and reducing acquisition costs. Strategic reinsurance placement, commonly ceding 10–30% of peak exposures, optimizes case economics by lowering capital strain and smoothing earnings volatility.
Investment management of reserves
General account assets are managed for yield and ALM, targeting income above benchmark as 10-year US Treasury yields hovered near 4.3–4.6% in 2024. Duration matching and strict credit risk controls (senior IG bias, limits by issuer and rating) protect solvency and regulatory capital ratios. Active portfolio rebalancing reacts to rate shifts and spread movements, with liquid government securities and IG corporates used to adjust duration and credit exposure.
Distribution enablement and sales support
Training, illustrations and case design support producers to raise quote accuracy and productivity; McKinsey notes distributor enablement can lift sales productivity up to 30% (2023). Marketing campaigns target and generate qualified leads with typical MQL-to-SQL conversion ~10–15% (industry benchmarks 2023–24). New-business operations drive same-day issuance targets and aim for <2% post-issue error rates.
- Training: productivity +30% (McKinsey 2023)
- Marketing: MQL→SQL ~10–15% (2023–24)
- Operations: same-day issuance; <2% errors
Policy administration and service
Policy administration and service covers billing, claims, and in-force changes to keep policyholder satisfaction high; industry data (2024) shows automation can cut claims cycle times by ~40% and improve NPS by ~8 points. Robust compliance reporting and audit readiness reduce regulatory risk and have helped firms lower fine exposure by ~15% year-over-year. Digital self-service handles roughly 60% of routine interactions and can lower cost-to-serve by up to 30%.
- Billing accuracy: reduces leakage, boosts retention
- Claims automation: ~40% faster cycle
- Compliance/audit: ~15% lower fine exposure
- Digital self-service: ~60% interactions, ~30% cost-to-serve
12–15% ROE, ~150% solvency, -50% UW time
Actuarial pricing targets 12–15% ROE in 2024 with solvency ~150% and mortality improvement ~0.5% p.a. Underwriting and reinsurance lower loss ratios (~10% improvement) and cut decision time (digital underwriting ~-50%). Asset ALM targets beat 10y US Treasuries (4.3–4.6% in 2024) while ops aim same-day issuance, <2% post-issue errors, claims automation ~-40% cycle time.
| Metric | 2024 value |
|---|---|
| Pricing ROE | 12–15% |
| Solvency | ~150% |
| Mortality imp. | ~0.5% p.a. |
| Underwriting impact | -10% loss ratio |
| Digital underwriting | -50% time |
| 10y Treasury | 4.3–4.6% |
| Issuance errors | <2% |
| Claims cycle | -40% |
| Digital self-service | 60% |
Full Version Awaits
Business Model Canvas
The document you're previewing is the actual NWLGI Business Model Canvas, not a mockup or sample. When you purchase, you'll receive this exact file—complete, fully editable and formatted—ready to download in Word and Excel. No hidden pages, no surprises.











