New York Community Bancorp Porter's Five Forces Analysis

Don't Miss the Bigger Picture
New York Community Bancorp faces concentrated buyer power, moderate supplier constraints, and persistent regulatory and interest-rate pressures that shape its margin outlook; low threat of well-capitalized new entrants but rising fintech substitutes increase competitive intensity. This brief snapshot only scratches the surface. Unlock the full Porter's Five Forces Analysis to explore the bank’s strategic risks and opportunities in detail.
Suppliers Bargaining Power

Funding mix dependence
Depositors and wholesale markets supply the bulk of NYCB funding, with total deposits of about $67.5 billion as of Q2 2024 and brokered deposits near 14%, shaping pricing and balance-sheet flexibility. A higher share of non-interest-bearing and core deposits reduces supplier power; reliance on higher-cost brokered funding raises it. Rising rate cycles can quickly push NYCBs cost of funds higher, and in stress wholesale counterparties can tighten terms, amplifying leverage.
Regulatory capital as a constraint
Regulators act as suppliers by controlling licenses and capital rules that bind New York Community Bancorp, with Basel III floors including a common equity Tier 1 minimum of 4.5% plus a 2.5% conservation buffer (effectively 7.0%) and an expected liquidity coverage ratio of 100%. After recent regional-bank stress, heightened supervisory scrutiny has increased buffer expectations and compliance costs. Capital scarcity thus raises the cost of growth and narrows strategic options, making regulators a non-negotiable supplier of operating permission.

Core technology vendors
Core processors, payments rails and cloud providers are highly concentrated—top three cloud vendors hold roughly 66% of global market share and Visa/Mastercard account for over 80% of card volume—raising switching costs for New York Community Bancorp. Contract lock‑ins and integration complexity give vendors pricing and service‑level leverage. Outages or delays (recent large‑provider incidents in 2022–24) can directly impair customer experience. Vendor risk management programs increase compliance and operational costs and constrain bargaining flexibility.

Specialized talent and underwriting know-how
Experienced multifamily and CRE underwriters are scarce in NYC’s rent-regulated niche, with roughly 1.0 million rent-regulated units in New York State as of 2024, concentrating specialized underwriting demand. Competition for workout, risk, and credit talent raises wage pressure and increases recruiting/retention costs, so loss of key personnel can directly impair pipeline quality and portfolio monitoring.
- Scarcity: concentrated expertise for ~1.0M rent-regulated units
- Wage pressure: higher hiring/retention costs
- Risk: key-person departures weaken pipeline and monitoring
Collateral valuation and servicing partners
Appraisers, legal firms, and special servicers materially shape deal timing and recoveries for NYCB by determining collateral valuation, enforcement pathways, and restructuring outcomes; limited trusted providers in regulated asset classes often command premium fees, tightening economics for originations and workouts.
Conflicts or operational delays from these partners can push loan closings and resolution timelines, increasing holding costs and credit losses; dependence on them spikes in periods of credit stress when industry servicing capacity contracts.
- Appraisers: influence timing and recovery realizations
- Legal firms: affect enforcement speed and cost
- Special servicers: command premiums, tighten during stress
- Delays/conflicts: increase hold costs and loss severity
Suppliers: deposits $67.5B, brokered 14%, CET1 ~7.0%, LCR 100%
NYCB’s suppliers exert moderate-to-high power: deposits $67.5B (Q2 2024) with ~14% brokered increases funding cost sensitivity; regulatory capital floors (CET1 ~7.0%) and LCR =100% constrain capital supply; concentrated tech/payment vendors (top3 cloud ~66%, Visa/Mastercard >80%) and scarce NYC rent‑regulated underwriting talent (~1.0M units) raise switching and wage costs.
| Supplier | 2024 metric |
|---|---|
| Deposits | $67.5B (Q2 2024), brokered ~14% |
| Regulators | CET1 floor ~7.0%, LCR 100% |
| Tech/Payments | Top3 cloud ~66%, Visa/MC >80% |
| Talent | Rent‑regulated units ~1.0M |
What is included in the product
 Detailed Word Document
Tailored Porter's Five Forces analysis for New York Community Bancorp uncovering competitive intensity, customer and supplier influence on margins, entry barriers protecting incumbents, and substitutes or disruptive threats to market share. Includes strategic commentary and editable findings for use in investor materials, internal strategy decks, or academic projects.

 Customizable Excel Spreadsheet
A concise, one-sheet Porter’s Five Forces for New York Community Bancorp—instantly reveal competitive pressures, regulatory risk, and borrower concentration so you can prioritize strategic actions and speed boardroom decisions.
Customers Bargaining Power

Institutional multifamily borrowers
Institutional multifamily borrowers, especially owners of New York’s roughly 1,000,000 rent-stabilized units, exert strong bargaining power by negotiating rates and terms across banks and private lenders. Their scale and cross-lender optionality amplify leverage, though NYCB’s deep relationships and niche underwriting expertise reduce but do not remove switching risk. Tailored covenants and structural loan features help NYCB compete beyond price.
Retail and small business depositors
Retail and small-business depositors face low switching costs via digital onboarding and ACH portability. In rising-rate environments they demand higher yields or move to money market funds; FDIC insurance remains $250,000. Brand trust and branch proximity reduce churn but not rate sensitivity. Material shifts in deposit mix can meaningfully raise NYCB funding costs.

Mortgage and CRE borrowers beyond NYC
Flagstar, acquired by NYCB in 2022, gives NYCB exposure to national mortgage channels, increasing borrower alternatives beyond NYC. In 2024 nonbank and bank competitors alongside GSE-backed programs kept pricing and warehouse competition intense. Borrowers frequently play lenders off each other to win on speed and structure. Superior service quality and certainty of close remain key levers to blunt customer bargaining power.

Fee-based service users
Treasury management and payments clients often bundle services for fee discounts; in 2024 the largest corporate relationships accounted for over 40% of fee-based revenues.
Growing API and integration needs increase demands for customization, with roughly 45% of corporate clients in 2024 requiring bespoke connectivity.
Switching is feasible when data migration and onboarding are supported, and volume commitments give large customers clear negotiating leverage.
- Bundle discounts drive concentration
- API/customization = higher servicing cost
- Data migration reduces switching friction
- Volume commitments = pricing power
Credit quality dispersion
Higher-quality borrowers at New York Community Bancorp exert greater bargaining power because their lower default risk lets them secure looser covenants and lower spreads; NYCB’s multifamily-heavy book, about 70% of loans in 2024, concentrates leverage with higher-quality landlords. Weaker credits accept tighter covenants and higher spreads, but cycle turns can flip this dynamic as lenders retrench. Active portfolio mix management helps balance buyer power across segments.
- Higher-quality borrowers: lower default risk, more pricing leverage
- Weaker credits: accept tighter covenants, pay higher spreads
- 2024 concentration ~70% multifamily increases customer bargaining concentration
Multifamily ~70% of loans; deposits flee, funding costs rise; >40% fee concentration; 45% need APIs
Large institutional multifamily borrowers (≈70% of loans in 2024) have strong leverage, negotiating price and covenants across banks and nonbanks. Retail depositors shift for yields (FDIC cap $250,000) raising funding costs. Top corporate clients drove >40% of fee revenue in 2024 and ~45% demanded API/customization, increasing servicing cost and bargaining power.
| Metric | 2024 |
|---|---|
| Multifamily share of loans | ~70% |
| FDIC insurance | $250,000 |
| Fee rev concentration | >40% |
| Clients needing API | ~45% |
Preview Before You Purchase
New York Community Bancorp Porter's Five Forces Analysis
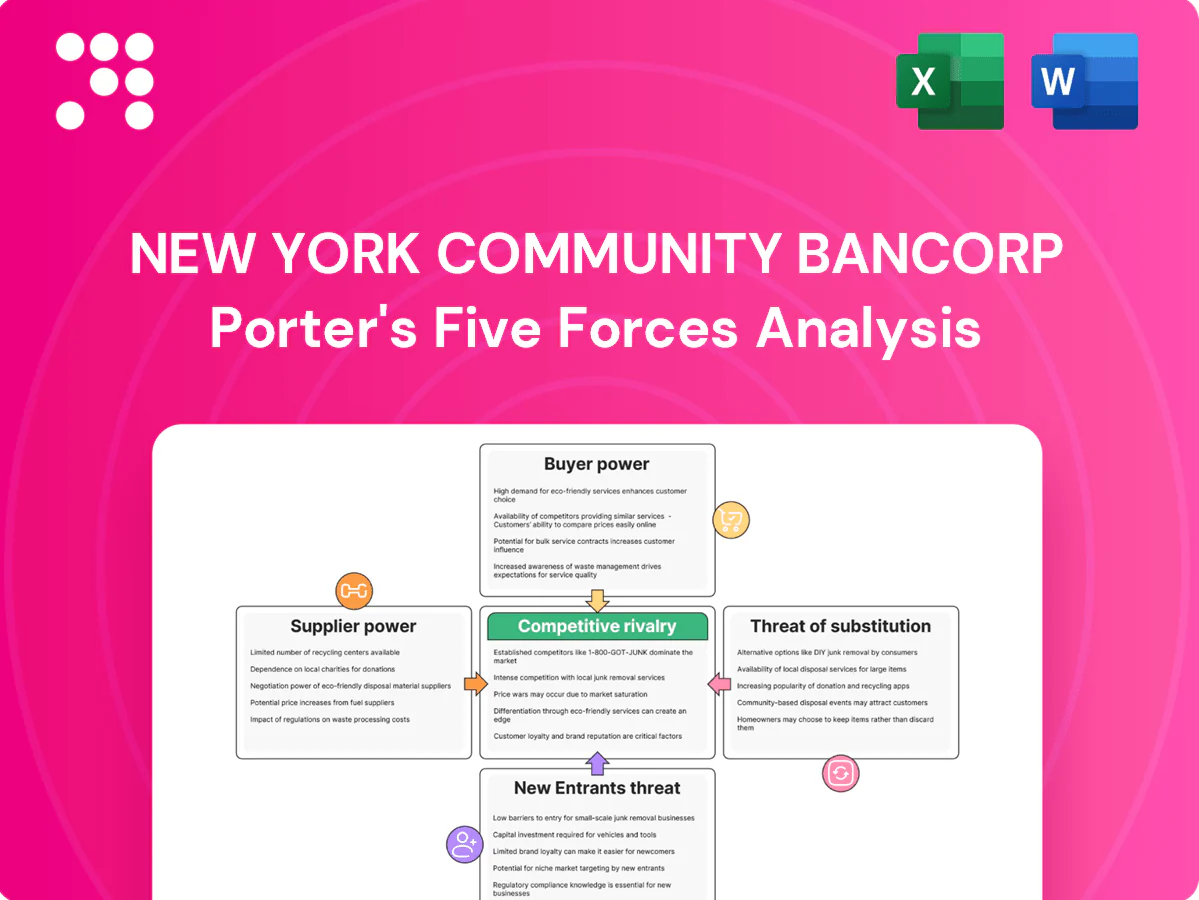
This preview shows the exact Porter's Five Forces analysis for New York Community Bancorp you'll receive after purchase. It evaluates competitive rivalry, threat of new entrants, bargaining power of suppliers and buyers, and substitute risks, offering actionable insights and strategic implications. Fully formatted and ready for immediate download and use.

Don't Miss the Bigger Picture
New York Community Bancorp faces concentrated buyer power, moderate supplier constraints, and persistent regulatory and interest-rate pressures that shape its margin outlook; low threat of well-capitalized new entrants but rising fintech substitutes increase competitive intensity. This brief snapshot only scratches the surface. Unlock the full Porter's Five Forces Analysis to explore the bank’s strategic risks and opportunities in detail.
Suppliers Bargaining Power
Funding mix dependence
Depositors and wholesale markets supply the bulk of NYCB funding, with total deposits of about $67.5 billion as of Q2 2024 and brokered deposits near 14%, shaping pricing and balance-sheet flexibility. A higher share of non-interest-bearing and core deposits reduces supplier power; reliance on higher-cost brokered funding raises it. Rising rate cycles can quickly push NYCBs cost of funds higher, and in stress wholesale counterparties can tighten terms, amplifying leverage.
Regulatory capital as a constraint
Regulators act as suppliers by controlling licenses and capital rules that bind New York Community Bancorp, with Basel III floors including a common equity Tier 1 minimum of 4.5% plus a 2.5% conservation buffer (effectively 7.0%) and an expected liquidity coverage ratio of 100%. After recent regional-bank stress, heightened supervisory scrutiny has increased buffer expectations and compliance costs. Capital scarcity thus raises the cost of growth and narrows strategic options, making regulators a non-negotiable supplier of operating permission.
Core technology vendors
Core processors, payments rails and cloud providers are highly concentrated—top three cloud vendors hold roughly 66% of global market share and Visa/Mastercard account for over 80% of card volume—raising switching costs for New York Community Bancorp. Contract lock‑ins and integration complexity give vendors pricing and service‑level leverage. Outages or delays (recent large‑provider incidents in 2022–24) can directly impair customer experience. Vendor risk management programs increase compliance and operational costs and constrain bargaining flexibility.
Specialized talent and underwriting know-how
Experienced multifamily and CRE underwriters are scarce in NYC’s rent-regulated niche, with roughly 1.0 million rent-regulated units in New York State as of 2024, concentrating specialized underwriting demand. Competition for workout, risk, and credit talent raises wage pressure and increases recruiting/retention costs, so loss of key personnel can directly impair pipeline quality and portfolio monitoring.
- Scarcity: concentrated expertise for ~1.0M rent-regulated units
- Wage pressure: higher hiring/retention costs
- Risk: key-person departures weaken pipeline and monitoring
Collateral valuation and servicing partners
Appraisers, legal firms, and special servicers materially shape deal timing and recoveries for NYCB by determining collateral valuation, enforcement pathways, and restructuring outcomes; limited trusted providers in regulated asset classes often command premium fees, tightening economics for originations and workouts.
Conflicts or operational delays from these partners can push loan closings and resolution timelines, increasing holding costs and credit losses; dependence on them spikes in periods of credit stress when industry servicing capacity contracts.
- Appraisers: influence timing and recovery realizations
- Legal firms: affect enforcement speed and cost
- Special servicers: command premiums, tighten during stress
- Delays/conflicts: increase hold costs and loss severity
Suppliers: deposits $67.5B, brokered 14%, CET1 ~7.0%, LCR 100%
NYCB’s suppliers exert moderate-to-high power: deposits $67.5B (Q2 2024) with ~14% brokered increases funding cost sensitivity; regulatory capital floors (CET1 ~7.0%) and LCR =100% constrain capital supply; concentrated tech/payment vendors (top3 cloud ~66%, Visa/Mastercard >80%) and scarce NYC rent‑regulated underwriting talent (~1.0M units) raise switching and wage costs.
| Supplier | 2024 metric |
|---|---|
| Deposits | $67.5B (Q2 2024), brokered ~14% |
| Regulators | CET1 floor ~7.0%, LCR 100% |
| Tech/Payments | Top3 cloud ~66%, Visa/MC >80% |
| Talent | Rent‑regulated units ~1.0M |
What is included in the product
Detailed Word Document
Tailored Porter's Five Forces analysis for New York Community Bancorp uncovering competitive intensity, customer and supplier influence on margins, entry barriers protecting incumbents, and substitutes or disruptive threats to market share. Includes strategic commentary and editable findings for use in investor materials, internal strategy decks, or academic projects.
Customizable Excel Spreadsheet
A concise, one-sheet Porter’s Five Forces for New York Community Bancorp—instantly reveal competitive pressures, regulatory risk, and borrower concentration so you can prioritize strategic actions and speed boardroom decisions.
Customers Bargaining Power
Institutional multifamily borrowers
Institutional multifamily borrowers, especially owners of New York’s roughly 1,000,000 rent-stabilized units, exert strong bargaining power by negotiating rates and terms across banks and private lenders. Their scale and cross-lender optionality amplify leverage, though NYCB’s deep relationships and niche underwriting expertise reduce but do not remove switching risk. Tailored covenants and structural loan features help NYCB compete beyond price.
Retail and small business depositors
Retail and small-business depositors face low switching costs via digital onboarding and ACH portability. In rising-rate environments they demand higher yields or move to money market funds; FDIC insurance remains $250,000. Brand trust and branch proximity reduce churn but not rate sensitivity. Material shifts in deposit mix can meaningfully raise NYCB funding costs.
Mortgage and CRE borrowers beyond NYC
Flagstar, acquired by NYCB in 2022, gives NYCB exposure to national mortgage channels, increasing borrower alternatives beyond NYC. In 2024 nonbank and bank competitors alongside GSE-backed programs kept pricing and warehouse competition intense. Borrowers frequently play lenders off each other to win on speed and structure. Superior service quality and certainty of close remain key levers to blunt customer bargaining power.
Fee-based service users
Treasury management and payments clients often bundle services for fee discounts; in 2024 the largest corporate relationships accounted for over 40% of fee-based revenues.
Growing API and integration needs increase demands for customization, with roughly 45% of corporate clients in 2024 requiring bespoke connectivity.
Switching is feasible when data migration and onboarding are supported, and volume commitments give large customers clear negotiating leverage.
- Bundle discounts drive concentration
- API/customization = higher servicing cost
- Data migration reduces switching friction
- Volume commitments = pricing power
Credit quality dispersion
Higher-quality borrowers at New York Community Bancorp exert greater bargaining power because their lower default risk lets them secure looser covenants and lower spreads; NYCB’s multifamily-heavy book, about 70% of loans in 2024, concentrates leverage with higher-quality landlords. Weaker credits accept tighter covenants and higher spreads, but cycle turns can flip this dynamic as lenders retrench. Active portfolio mix management helps balance buyer power across segments.
- Higher-quality borrowers: lower default risk, more pricing leverage
- Weaker credits: accept tighter covenants, pay higher spreads
- 2024 concentration ~70% multifamily increases customer bargaining concentration
Multifamily ~70% of loans; deposits flee, funding costs rise; >40% fee concentration; 45% need APIs
Large institutional multifamily borrowers (≈70% of loans in 2024) have strong leverage, negotiating price and covenants across banks and nonbanks. Retail depositors shift for yields (FDIC cap $250,000) raising funding costs. Top corporate clients drove >40% of fee revenue in 2024 and ~45% demanded API/customization, increasing servicing cost and bargaining power.
| Metric | 2024 |
|---|---|
| Multifamily share of loans | ~70% |
| FDIC insurance | $250,000 |
| Fee rev concentration | >40% |
| Clients needing API | ~45% |
Preview Before You Purchase
New York Community Bancorp Porter's Five Forces Analysis
This preview shows the exact Porter's Five Forces analysis for New York Community Bancorp you'll receive after purchase. It evaluates competitive rivalry, threat of new entrants, bargaining power of suppliers and buyers, and substitute risks, offering actionable insights and strategic implications. Fully formatted and ready for immediate download and use.
Original: $10.00
-65%$10.00
$3.50Description
Don't Miss the Bigger Picture
New York Community Bancorp faces concentrated buyer power, moderate supplier constraints, and persistent regulatory and interest-rate pressures that shape its margin outlook; low threat of well-capitalized new entrants but rising fintech substitutes increase competitive intensity. This brief snapshot only scratches the surface. Unlock the full Porter's Five Forces Analysis to explore the bank’s strategic risks and opportunities in detail.
Suppliers Bargaining Power
Funding mix dependence
Depositors and wholesale markets supply the bulk of NYCB funding, with total deposits of about $67.5 billion as of Q2 2024 and brokered deposits near 14%, shaping pricing and balance-sheet flexibility. A higher share of non-interest-bearing and core deposits reduces supplier power; reliance on higher-cost brokered funding raises it. Rising rate cycles can quickly push NYCBs cost of funds higher, and in stress wholesale counterparties can tighten terms, amplifying leverage.
Regulatory capital as a constraint
Regulators act as suppliers by controlling licenses and capital rules that bind New York Community Bancorp, with Basel III floors including a common equity Tier 1 minimum of 4.5% plus a 2.5% conservation buffer (effectively 7.0%) and an expected liquidity coverage ratio of 100%. After recent regional-bank stress, heightened supervisory scrutiny has increased buffer expectations and compliance costs. Capital scarcity thus raises the cost of growth and narrows strategic options, making regulators a non-negotiable supplier of operating permission.
Core technology vendors
Core processors, payments rails and cloud providers are highly concentrated—top three cloud vendors hold roughly 66% of global market share and Visa/Mastercard account for over 80% of card volume—raising switching costs for New York Community Bancorp. Contract lock‑ins and integration complexity give vendors pricing and service‑level leverage. Outages or delays (recent large‑provider incidents in 2022–24) can directly impair customer experience. Vendor risk management programs increase compliance and operational costs and constrain bargaining flexibility.
Specialized talent and underwriting know-how
Experienced multifamily and CRE underwriters are scarce in NYC’s rent-regulated niche, with roughly 1.0 million rent-regulated units in New York State as of 2024, concentrating specialized underwriting demand. Competition for workout, risk, and credit talent raises wage pressure and increases recruiting/retention costs, so loss of key personnel can directly impair pipeline quality and portfolio monitoring.
- Scarcity: concentrated expertise for ~1.0M rent-regulated units
- Wage pressure: higher hiring/retention costs
- Risk: key-person departures weaken pipeline and monitoring
Collateral valuation and servicing partners
Appraisers, legal firms, and special servicers materially shape deal timing and recoveries for NYCB by determining collateral valuation, enforcement pathways, and restructuring outcomes; limited trusted providers in regulated asset classes often command premium fees, tightening economics for originations and workouts.
Conflicts or operational delays from these partners can push loan closings and resolution timelines, increasing holding costs and credit losses; dependence on them spikes in periods of credit stress when industry servicing capacity contracts.
- Appraisers: influence timing and recovery realizations
- Legal firms: affect enforcement speed and cost
- Special servicers: command premiums, tighten during stress
- Delays/conflicts: increase hold costs and loss severity
Suppliers: deposits $67.5B, brokered 14%, CET1 ~7.0%, LCR 100%
NYCB’s suppliers exert moderate-to-high power: deposits $67.5B (Q2 2024) with ~14% brokered increases funding cost sensitivity; regulatory capital floors (CET1 ~7.0%) and LCR =100% constrain capital supply; concentrated tech/payment vendors (top3 cloud ~66%, Visa/Mastercard >80%) and scarce NYC rent‑regulated underwriting talent (~1.0M units) raise switching and wage costs.
| Supplier | 2024 metric |
|---|---|
| Deposits | $67.5B (Q2 2024), brokered ~14% |
| Regulators | CET1 floor ~7.0%, LCR 100% |
| Tech/Payments | Top3 cloud ~66%, Visa/MC >80% |
| Talent | Rent‑regulated units ~1.0M |
What is included in the product
Detailed Word Document
Tailored Porter's Five Forces analysis for New York Community Bancorp uncovering competitive intensity, customer and supplier influence on margins, entry barriers protecting incumbents, and substitutes or disruptive threats to market share. Includes strategic commentary and editable findings for use in investor materials, internal strategy decks, or academic projects.
Customizable Excel Spreadsheet
A concise, one-sheet Porter’s Five Forces for New York Community Bancorp—instantly reveal competitive pressures, regulatory risk, and borrower concentration so you can prioritize strategic actions and speed boardroom decisions.
Customers Bargaining Power
Institutional multifamily borrowers
Institutional multifamily borrowers, especially owners of New York’s roughly 1,000,000 rent-stabilized units, exert strong bargaining power by negotiating rates and terms across banks and private lenders. Their scale and cross-lender optionality amplify leverage, though NYCB’s deep relationships and niche underwriting expertise reduce but do not remove switching risk. Tailored covenants and structural loan features help NYCB compete beyond price.
Retail and small business depositors
Retail and small-business depositors face low switching costs via digital onboarding and ACH portability. In rising-rate environments they demand higher yields or move to money market funds; FDIC insurance remains $250,000. Brand trust and branch proximity reduce churn but not rate sensitivity. Material shifts in deposit mix can meaningfully raise NYCB funding costs.
Mortgage and CRE borrowers beyond NYC
Flagstar, acquired by NYCB in 2022, gives NYCB exposure to national mortgage channels, increasing borrower alternatives beyond NYC. In 2024 nonbank and bank competitors alongside GSE-backed programs kept pricing and warehouse competition intense. Borrowers frequently play lenders off each other to win on speed and structure. Superior service quality and certainty of close remain key levers to blunt customer bargaining power.
Fee-based service users
Treasury management and payments clients often bundle services for fee discounts; in 2024 the largest corporate relationships accounted for over 40% of fee-based revenues.
Growing API and integration needs increase demands for customization, with roughly 45% of corporate clients in 2024 requiring bespoke connectivity.
Switching is feasible when data migration and onboarding are supported, and volume commitments give large customers clear negotiating leverage.
- Bundle discounts drive concentration
- API/customization = higher servicing cost
- Data migration reduces switching friction
- Volume commitments = pricing power
Credit quality dispersion
Higher-quality borrowers at New York Community Bancorp exert greater bargaining power because their lower default risk lets them secure looser covenants and lower spreads; NYCB’s multifamily-heavy book, about 70% of loans in 2024, concentrates leverage with higher-quality landlords. Weaker credits accept tighter covenants and higher spreads, but cycle turns can flip this dynamic as lenders retrench. Active portfolio mix management helps balance buyer power across segments.
- Higher-quality borrowers: lower default risk, more pricing leverage
- Weaker credits: accept tighter covenants, pay higher spreads
- 2024 concentration ~70% multifamily increases customer bargaining concentration
Multifamily ~70% of loans; deposits flee, funding costs rise; >40% fee concentration; 45% need APIs
Large institutional multifamily borrowers (≈70% of loans in 2024) have strong leverage, negotiating price and covenants across banks and nonbanks. Retail depositors shift for yields (FDIC cap $250,000) raising funding costs. Top corporate clients drove >40% of fee revenue in 2024 and ~45% demanded API/customization, increasing servicing cost and bargaining power.
| Metric | 2024 |
|---|---|
| Multifamily share of loans | ~70% |
| FDIC insurance | $250,000 |
| Fee rev concentration | >40% |
| Clients needing API | ~45% |
Preview Before You Purchase
New York Community Bancorp Porter's Five Forces Analysis
This preview shows the exact Porter's Five Forces analysis for New York Community Bancorp you'll receive after purchase. It evaluates competitive rivalry, threat of new entrants, bargaining power of suppliers and buyers, and substitute risks, offering actionable insights and strategic implications. Fully formatted and ready for immediate download and use.











