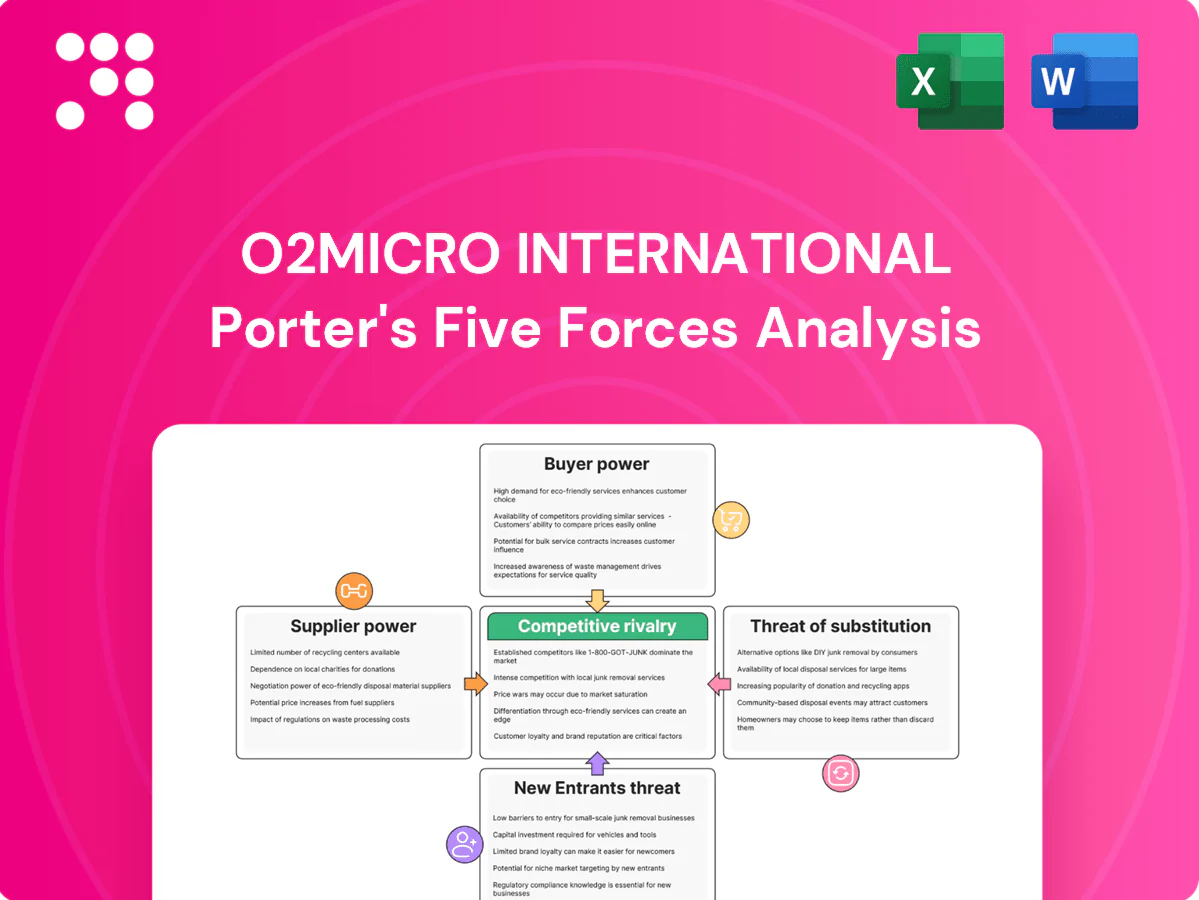
O2Micro International Porter's Five Forces Analysis

Elevate Your Analysis with the Complete Porter's Five Forces Analysis
O2Micro International faces moderate supplier leverage, rising buyer sophistication, niche substitute threats, and entry barriers shaped by IP and manufacturing scale. Competitive rivalry centers on innovation and cost efficiency. This snapshot hints at strategic pressure points and risk exposures. Unlock the full Porter's Five Forces Analysis for force-by-force ratings, visuals, and actionable strategy guidance.
Suppliers Bargaining Power

Concentrated foundry reliance
Analog/mixed-signal PMICs for O2Micro rely on a small set of specialized foundries (TSMC, UMC, SMIC), with TSMC holding about 54% of global foundry share in 2023, concentrating supply for specific nodes. Limited alternative process variants raise switching costs and escalate lead-time risk when capacity tightens. During tight cycles foundry pricing power has historically compressed fabless margins, increasing procurement cost volatility for O2Micro.
Specialized packaging and testing
O2Micro relies on OSAT partners for advanced QFN/QFP, CSP and power-thermal packages. Unique thermal and reliability specs reduce substitutability, concentrating sourcing with top OSATs — over 70% of advanced packaging capacity was held by the top five OSATs in 2024. Test and burn-in bottlenecks can delay production ramps. Such constraints raise supplier leverage and risk of time-to-revenue setbacks.

Critical materials and substrates
Epoxy mold compounds, leadframes and specialty substrates are sourced from qualified vendor lists, concentrating supply and raising supplier power. Re-qualification of new vendors typically requires 6–12 months and can cost $100k–$1M, creating switching frictions. Volatility in copper, resin and substrate prices in 2024 has shifted COGS by an estimated 5–15% on high-volume SKUs, directly affecting margins.

EDA tools and IP ecosystems
EDA tool and foundry PDK/IP licensing is concentrated: the top three EDA vendors (Synopsys, Cadence, Siemens EDA) account for over 80% of EDA revenue, and TSMC controls over 50% of global foundry capacity in 2024, creating supplier lock-in. Tool switching requires retraining and methodology shifts, so upstream vendors hold pricing and contractual leverage over O2Micro’s analog/RF design inputs.
- Concentration: top-3 EDA >80%
- Foundry dominance: TSMC >50% (2024)
- Switching costs: high retraining/methodology
- Result: strong supplier pricing/contract leverage
Process-specific know-how
O2Micro performance targets for PMICs rely on foundry process recipes co-developed over time, and porting designs to new nodes often incurs multi-quarter redesign cycles and yield setbacks; foundry concentration (TSMC ~56% of global foundry revenue in 2024) increases supplier leverage. Suppliers owning unique process IP can demand favorable pricing, priority capacity and tighter contract terms, raising switching costs and procurement risk.
- Co-developed recipes: long-term dependence
- Porting risk: multi-quarter redesigns, yield setbacks
- 2024 foundry concentration: TSMC ~56%
- Supplier leverage: pricing, capacity priority, contract terms
Foundry/EDA lock-in, material swings squeeze PMIC margins; switching 6–12m
Supplier power is high: foundry concentration (TSMC ~56% 2024) and top-3 EDA >80% create lock-in; top-5 OSATs hold >70% advanced packaging capacity (2024). Switching/qualification takes 6–12 months and $100k–$1M, while 2024 material volatility moved COGS by ~5–15%, compressing PMIC margins.
| Metric | 2024 |
|---|---|
| TSMC share | ~56% |
| Top-3 EDA | >80% |
| Top-5 OSAT | >70% |
| COGS volatility | 5–15% |
What is included in the product
 Detailed Word Document
Tailored Porter's Five Forces analysis for O2Micro International that uncovers competitive intensity, buyer and supplier power, threat of substitutes and entrants, and identifies disruptive forces and strategic levers to protect or grow its market position.

 Customizable Excel Spreadsheet
A concise one-sheet Porter's Five Forces for O2Micro International that visualizes supplier, buyer, competitor, substitute and regulatory pressures—ideal for quick strategic decisions and boardroom use.
Customers Bargaining Power

Large OEM/ODM concentration
Notebook, mobile and appliance OEM/ODM concentration gives buyers outsized leverage: the top 5 notebook vendors accounted for roughly 75–80% of global shipments in 2024, and the top 5 smartphone vendors about 65–70% in 2024, so a few design wins can represent a material share of O2Micro’s revenue. These large buyers purchase in high volumes and negotiate aggressively on price, lead times and warranty terms. This concentration elevates buyer power over pricing and contract conditions.
Design-in decision gate
Design-in decision gate gives buyers strong leverage because design wins lock parts for product lifecycles, typically 3–5 years, making initial selection crucial. Customers routinely demand samples, engineering support and NRE concessions during qualification, increasing supplier costs. Losing a socket can shift share for multiple years and materially reduce supplier revenue streams.

Availability of alternatives
TI, MPS, Renesas, ON and others maintain overlapping PMIC/BMS portfolios, and with the global PMIC market valued at about $9.2 billion in 2024 customers can readily source alternatives. Multi-sourcing—commonly involving 2–3 vendors per design—reduces switching costs and bargaining friction for buyers. Feature parity across suppliers forces O2Micro to compete increasingly on price-performance, lead times and after-sales service.

Price sensitivity in consumer markets
Price elasticity in consumer electronics forces high BOM cost-down targets; industry reports in 2024 noted OEMs commonly sought 5–10% annual BOM reductions, driving buyers to demand quarterly or annual price erosion. For O2Micro this intensifies margin pressure as volume buyers push down ASPs; vendors respond with process cost reduction, die shrinks and supply-chain efficiencies to preserve margins.
- High elasticity: OEMs target 5–10% BOM cuts (2024)
- Buyer pressure: quarterly/annual price erosion
- Vendor response: cost reduction, die shrinks, yield improvements
Qualification and compliance leverage
Customers impose stringent reliability, safety and regulatory standards (ISO 26262 for automotive and AEC‑Q in 2024), and successful audits give buyers leverage to dictate delivery timelines, spot‑check documentation and change order pacing; failure to meet targets risks supplier delisting and months of costly requalification.
- Audit leverage: buyers control timelines
- Standards: ISO 26262, AEC‑Q (2024)
- Risk: delisting + requalification delays
Top5 NB 75-80%, SP 65-70%, PMIC $9.2B
High OEM concentration gives buyers outsized leverage: top 5 notebook vendors 75–80% and top 5 smartphone vendors 65–70% of shipments (2024).
Design‑in windows (3–5 years) and multi‑sourcing lower switching costs and force competitive design wins.
PMIC market ~$9.2B (2024) with feature parity drives price competition; OEMs target 5–10% annual BOM cuts.
| Metric | 2024 |
|---|---|
| Top5 notebook share | 75–80% |
| Top5 smartphone share | 65–70% |
| PMIC market | $9.2B |
| OEM BOM cuts | 5–10% |
Same Document Delivered
O2Micro International Porter's Five Forces Analysis
This preview shows the exact O2Micro International Porter’s Five Forces analysis you’ll receive after purchase—no placeholders or samples. It’s the final, professionally formatted document ready for immediate download and use. Purchase grants instant access to this identical file.

Elevate Your Analysis with the Complete Porter's Five Forces Analysis
O2Micro International faces moderate supplier leverage, rising buyer sophistication, niche substitute threats, and entry barriers shaped by IP and manufacturing scale. Competitive rivalry centers on innovation and cost efficiency. This snapshot hints at strategic pressure points and risk exposures. Unlock the full Porter's Five Forces Analysis for force-by-force ratings, visuals, and actionable strategy guidance.
Suppliers Bargaining Power
Concentrated foundry reliance
Analog/mixed-signal PMICs for O2Micro rely on a small set of specialized foundries (TSMC, UMC, SMIC), with TSMC holding about 54% of global foundry share in 2023, concentrating supply for specific nodes. Limited alternative process variants raise switching costs and escalate lead-time risk when capacity tightens. During tight cycles foundry pricing power has historically compressed fabless margins, increasing procurement cost volatility for O2Micro.
Specialized packaging and testing
O2Micro relies on OSAT partners for advanced QFN/QFP, CSP and power-thermal packages. Unique thermal and reliability specs reduce substitutability, concentrating sourcing with top OSATs — over 70% of advanced packaging capacity was held by the top five OSATs in 2024. Test and burn-in bottlenecks can delay production ramps. Such constraints raise supplier leverage and risk of time-to-revenue setbacks.
Critical materials and substrates
Epoxy mold compounds, leadframes and specialty substrates are sourced from qualified vendor lists, concentrating supply and raising supplier power. Re-qualification of new vendors typically requires 6–12 months and can cost $100k–$1M, creating switching frictions. Volatility in copper, resin and substrate prices in 2024 has shifted COGS by an estimated 5–15% on high-volume SKUs, directly affecting margins.
EDA tools and IP ecosystems
EDA tool and foundry PDK/IP licensing is concentrated: the top three EDA vendors (Synopsys, Cadence, Siemens EDA) account for over 80% of EDA revenue, and TSMC controls over 50% of global foundry capacity in 2024, creating supplier lock-in. Tool switching requires retraining and methodology shifts, so upstream vendors hold pricing and contractual leverage over O2Micro’s analog/RF design inputs.
- Concentration: top-3 EDA >80%
- Foundry dominance: TSMC >50% (2024)
- Switching costs: high retraining/methodology
- Result: strong supplier pricing/contract leverage
Process-specific know-how
O2Micro performance targets for PMICs rely on foundry process recipes co-developed over time, and porting designs to new nodes often incurs multi-quarter redesign cycles and yield setbacks; foundry concentration (TSMC ~56% of global foundry revenue in 2024) increases supplier leverage. Suppliers owning unique process IP can demand favorable pricing, priority capacity and tighter contract terms, raising switching costs and procurement risk.
- Co-developed recipes: long-term dependence
- Porting risk: multi-quarter redesigns, yield setbacks
- 2024 foundry concentration: TSMC ~56%
- Supplier leverage: pricing, capacity priority, contract terms
Foundry/EDA lock-in, material swings squeeze PMIC margins; switching 6–12m
Supplier power is high: foundry concentration (TSMC ~56% 2024) and top-3 EDA >80% create lock-in; top-5 OSATs hold >70% advanced packaging capacity (2024). Switching/qualification takes 6–12 months and $100k–$1M, while 2024 material volatility moved COGS by ~5–15%, compressing PMIC margins.
| Metric | 2024 |
|---|---|
| TSMC share | ~56% |
| Top-3 EDA | >80% |
| Top-5 OSAT | >70% |
| COGS volatility | 5–15% |
What is included in the product
Detailed Word Document
Tailored Porter's Five Forces analysis for O2Micro International that uncovers competitive intensity, buyer and supplier power, threat of substitutes and entrants, and identifies disruptive forces and strategic levers to protect or grow its market position.
Customizable Excel Spreadsheet
A concise one-sheet Porter's Five Forces for O2Micro International that visualizes supplier, buyer, competitor, substitute and regulatory pressures—ideal for quick strategic decisions and boardroom use.
Customers Bargaining Power
Large OEM/ODM concentration
Notebook, mobile and appliance OEM/ODM concentration gives buyers outsized leverage: the top 5 notebook vendors accounted for roughly 75–80% of global shipments in 2024, and the top 5 smartphone vendors about 65–70% in 2024, so a few design wins can represent a material share of O2Micro’s revenue. These large buyers purchase in high volumes and negotiate aggressively on price, lead times and warranty terms. This concentration elevates buyer power over pricing and contract conditions.
Design-in decision gate
Design-in decision gate gives buyers strong leverage because design wins lock parts for product lifecycles, typically 3–5 years, making initial selection crucial. Customers routinely demand samples, engineering support and NRE concessions during qualification, increasing supplier costs. Losing a socket can shift share for multiple years and materially reduce supplier revenue streams.
Availability of alternatives
TI, MPS, Renesas, ON and others maintain overlapping PMIC/BMS portfolios, and with the global PMIC market valued at about $9.2 billion in 2024 customers can readily source alternatives. Multi-sourcing—commonly involving 2–3 vendors per design—reduces switching costs and bargaining friction for buyers. Feature parity across suppliers forces O2Micro to compete increasingly on price-performance, lead times and after-sales service.
Price sensitivity in consumer markets
Price elasticity in consumer electronics forces high BOM cost-down targets; industry reports in 2024 noted OEMs commonly sought 5–10% annual BOM reductions, driving buyers to demand quarterly or annual price erosion. For O2Micro this intensifies margin pressure as volume buyers push down ASPs; vendors respond with process cost reduction, die shrinks and supply-chain efficiencies to preserve margins.
- High elasticity: OEMs target 5–10% BOM cuts (2024)
- Buyer pressure: quarterly/annual price erosion
- Vendor response: cost reduction, die shrinks, yield improvements
Qualification and compliance leverage
Customers impose stringent reliability, safety and regulatory standards (ISO 26262 for automotive and AEC‑Q in 2024), and successful audits give buyers leverage to dictate delivery timelines, spot‑check documentation and change order pacing; failure to meet targets risks supplier delisting and months of costly requalification.
- Audit leverage: buyers control timelines
- Standards: ISO 26262, AEC‑Q (2024)
- Risk: delisting + requalification delays
Top5 NB 75-80%, SP 65-70%, PMIC $9.2B
High OEM concentration gives buyers outsized leverage: top 5 notebook vendors 75–80% and top 5 smartphone vendors 65–70% of shipments (2024).
Design‑in windows (3–5 years) and multi‑sourcing lower switching costs and force competitive design wins.
PMIC market ~$9.2B (2024) with feature parity drives price competition; OEMs target 5–10% annual BOM cuts.
| Metric | 2024 |
|---|---|
| Top5 notebook share | 75–80% |
| Top5 smartphone share | 65–70% |
| PMIC market | $9.2B |
| OEM BOM cuts | 5–10% |
Same Document Delivered
O2Micro International Porter's Five Forces Analysis
This preview shows the exact O2Micro International Porter’s Five Forces analysis you’ll receive after purchase—no placeholders or samples. It’s the final, professionally formatted document ready for immediate download and use. Purchase grants instant access to this identical file.
Original: $10.00
-65%$10.00
$3.50Description
Elevate Your Analysis with the Complete Porter's Five Forces Analysis
O2Micro International faces moderate supplier leverage, rising buyer sophistication, niche substitute threats, and entry barriers shaped by IP and manufacturing scale. Competitive rivalry centers on innovation and cost efficiency. This snapshot hints at strategic pressure points and risk exposures. Unlock the full Porter's Five Forces Analysis for force-by-force ratings, visuals, and actionable strategy guidance.
Suppliers Bargaining Power
Concentrated foundry reliance
Analog/mixed-signal PMICs for O2Micro rely on a small set of specialized foundries (TSMC, UMC, SMIC), with TSMC holding about 54% of global foundry share in 2023, concentrating supply for specific nodes. Limited alternative process variants raise switching costs and escalate lead-time risk when capacity tightens. During tight cycles foundry pricing power has historically compressed fabless margins, increasing procurement cost volatility for O2Micro.
Specialized packaging and testing
O2Micro relies on OSAT partners for advanced QFN/QFP, CSP and power-thermal packages. Unique thermal and reliability specs reduce substitutability, concentrating sourcing with top OSATs — over 70% of advanced packaging capacity was held by the top five OSATs in 2024. Test and burn-in bottlenecks can delay production ramps. Such constraints raise supplier leverage and risk of time-to-revenue setbacks.
Critical materials and substrates
Epoxy mold compounds, leadframes and specialty substrates are sourced from qualified vendor lists, concentrating supply and raising supplier power. Re-qualification of new vendors typically requires 6–12 months and can cost $100k–$1M, creating switching frictions. Volatility in copper, resin and substrate prices in 2024 has shifted COGS by an estimated 5–15% on high-volume SKUs, directly affecting margins.
EDA tools and IP ecosystems
EDA tool and foundry PDK/IP licensing is concentrated: the top three EDA vendors (Synopsys, Cadence, Siemens EDA) account for over 80% of EDA revenue, and TSMC controls over 50% of global foundry capacity in 2024, creating supplier lock-in. Tool switching requires retraining and methodology shifts, so upstream vendors hold pricing and contractual leverage over O2Micro’s analog/RF design inputs.
- Concentration: top-3 EDA >80%
- Foundry dominance: TSMC >50% (2024)
- Switching costs: high retraining/methodology
- Result: strong supplier pricing/contract leverage
Process-specific know-how
O2Micro performance targets for PMICs rely on foundry process recipes co-developed over time, and porting designs to new nodes often incurs multi-quarter redesign cycles and yield setbacks; foundry concentration (TSMC ~56% of global foundry revenue in 2024) increases supplier leverage. Suppliers owning unique process IP can demand favorable pricing, priority capacity and tighter contract terms, raising switching costs and procurement risk.
- Co-developed recipes: long-term dependence
- Porting risk: multi-quarter redesigns, yield setbacks
- 2024 foundry concentration: TSMC ~56%
- Supplier leverage: pricing, capacity priority, contract terms
Foundry/EDA lock-in, material swings squeeze PMIC margins; switching 6–12m
Supplier power is high: foundry concentration (TSMC ~56% 2024) and top-3 EDA >80% create lock-in; top-5 OSATs hold >70% advanced packaging capacity (2024). Switching/qualification takes 6–12 months and $100k–$1M, while 2024 material volatility moved COGS by ~5–15%, compressing PMIC margins.
| Metric | 2024 |
|---|---|
| TSMC share | ~56% |
| Top-3 EDA | >80% |
| Top-5 OSAT | >70% |
| COGS volatility | 5–15% |
What is included in the product
Detailed Word Document
Tailored Porter's Five Forces analysis for O2Micro International that uncovers competitive intensity, buyer and supplier power, threat of substitutes and entrants, and identifies disruptive forces and strategic levers to protect or grow its market position.
Customizable Excel Spreadsheet
A concise one-sheet Porter's Five Forces for O2Micro International that visualizes supplier, buyer, competitor, substitute and regulatory pressures—ideal for quick strategic decisions and boardroom use.
Customers Bargaining Power
Large OEM/ODM concentration
Notebook, mobile and appliance OEM/ODM concentration gives buyers outsized leverage: the top 5 notebook vendors accounted for roughly 75–80% of global shipments in 2024, and the top 5 smartphone vendors about 65–70% in 2024, so a few design wins can represent a material share of O2Micro’s revenue. These large buyers purchase in high volumes and negotiate aggressively on price, lead times and warranty terms. This concentration elevates buyer power over pricing and contract conditions.
Design-in decision gate
Design-in decision gate gives buyers strong leverage because design wins lock parts for product lifecycles, typically 3–5 years, making initial selection crucial. Customers routinely demand samples, engineering support and NRE concessions during qualification, increasing supplier costs. Losing a socket can shift share for multiple years and materially reduce supplier revenue streams.
Availability of alternatives
TI, MPS, Renesas, ON and others maintain overlapping PMIC/BMS portfolios, and with the global PMIC market valued at about $9.2 billion in 2024 customers can readily source alternatives. Multi-sourcing—commonly involving 2–3 vendors per design—reduces switching costs and bargaining friction for buyers. Feature parity across suppliers forces O2Micro to compete increasingly on price-performance, lead times and after-sales service.
Price sensitivity in consumer markets
Price elasticity in consumer electronics forces high BOM cost-down targets; industry reports in 2024 noted OEMs commonly sought 5–10% annual BOM reductions, driving buyers to demand quarterly or annual price erosion. For O2Micro this intensifies margin pressure as volume buyers push down ASPs; vendors respond with process cost reduction, die shrinks and supply-chain efficiencies to preserve margins.
- High elasticity: OEMs target 5–10% BOM cuts (2024)
- Buyer pressure: quarterly/annual price erosion
- Vendor response: cost reduction, die shrinks, yield improvements
Qualification and compliance leverage
Customers impose stringent reliability, safety and regulatory standards (ISO 26262 for automotive and AEC‑Q in 2024), and successful audits give buyers leverage to dictate delivery timelines, spot‑check documentation and change order pacing; failure to meet targets risks supplier delisting and months of costly requalification.
- Audit leverage: buyers control timelines
- Standards: ISO 26262, AEC‑Q (2024)
- Risk: delisting + requalification delays
Top5 NB 75-80%, SP 65-70%, PMIC $9.2B
High OEM concentration gives buyers outsized leverage: top 5 notebook vendors 75–80% and top 5 smartphone vendors 65–70% of shipments (2024).
Design‑in windows (3–5 years) and multi‑sourcing lower switching costs and force competitive design wins.
PMIC market ~$9.2B (2024) with feature parity drives price competition; OEMs target 5–10% annual BOM cuts.
| Metric | 2024 |
|---|---|
| Top5 notebook share | 75–80% |
| Top5 smartphone share | 65–70% |
| PMIC market | $9.2B |
| OEM BOM cuts | 5–10% |
Same Document Delivered
O2Micro International Porter's Five Forces Analysis
This preview shows the exact O2Micro International Porter’s Five Forces analysis you’ll receive after purchase—no placeholders or samples. It’s the final, professionally formatted document ready for immediate download and use. Purchase grants instant access to this identical file.











