Obsidian Energy Boston Consulting Group Matrix

Visual. Strategic. Downloadable.
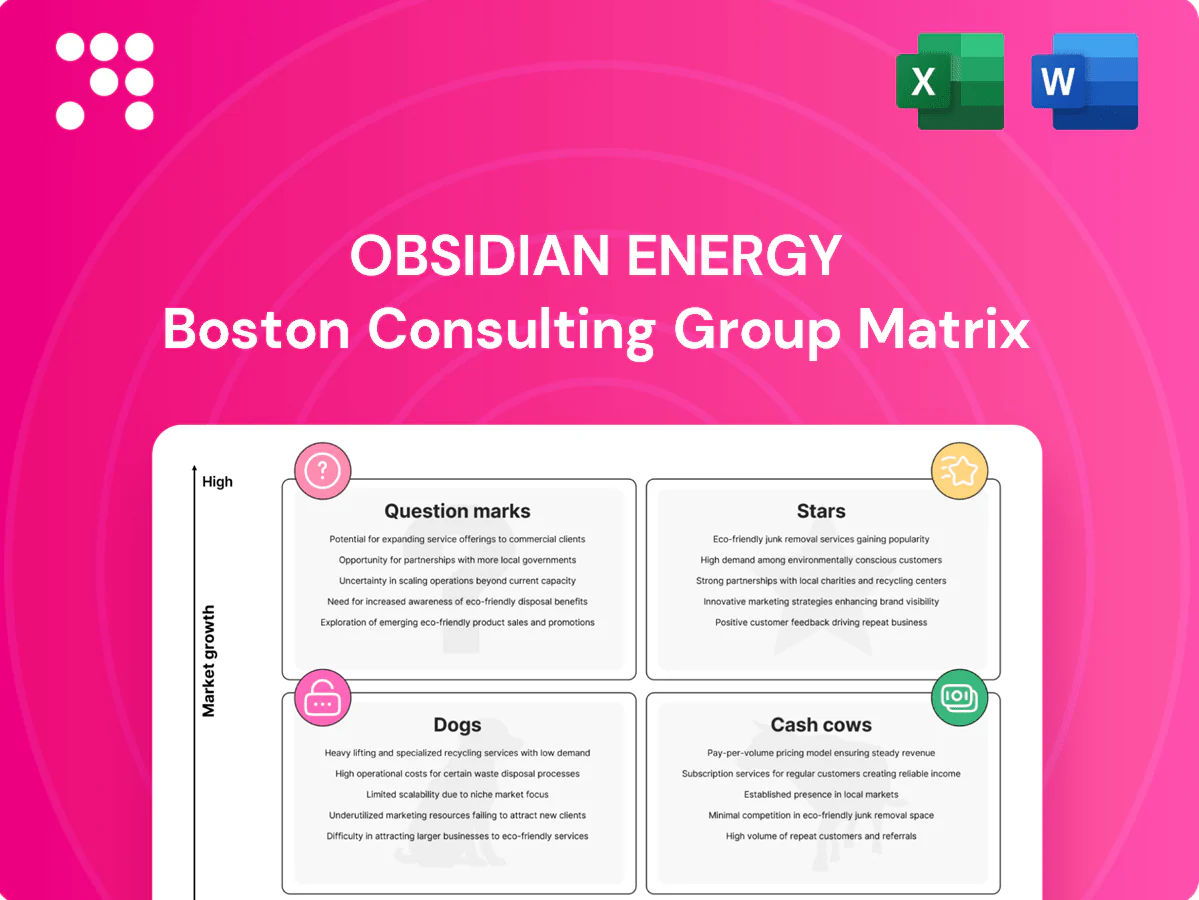
Curious where Obsidian Energy’s assets land — Stars, Cash Cows, Dogs or Question Marks? This snapshot shows the outline; the full BCG Matrix gives you quadrant-by-quadrant placement, data-backed recommendations, and tactical moves to optimize capital and focus. Buy the complete report for a ready-to-use Word analysis plus a high-level Excel summary, so you can present, decide, and act fast.
Stars

Cardium light oil growth engine
Obsidian’s core Cardium program sits in a growing light‑oil window with repeatable multi‑well pads, driving year‑to‑date 2024 volume growth versus prior year while holding unit costs broadly stable. Strong well results and stacked inventory support rising volumes; management continues to emphasize drilling cadence, completions intensity and fast tie‑ins to defend share. If momentum sustains as basin growth cools later in 2024, this set can flip into Cash Cow territory.
Peace River heavy oil ramp (multi‑leg)
Peace River development is re-accelerating with multi-leg horizontals unlocking thicker pay and delivering step-change uplift in well productivity. It’s a competitive area, but Obsidian’s focused footprint and operational learnings are pushing rates higher, faster across the core. Prioritize pad efficiency, winter access planning, and marketing optionality to manage differentials and scale now while growth is hot to cement niche leadership.

Operational efficiency edge (LOE + cycle time)
High market share in Obsidian’s core (top‑quartile performance) stems from roughly 20–30% faster spud‑to‑onstream cycles and LOE near US$6/boe in 2024, enabling throughput to reach about 43,000 boe/d without cash strain. That operational engine fuels growth while keeping capital intensity moderate. Continued investment in field automation, real‑time data and centralized prep yards compounds the edge, turning throughput into sustained share.

Market access and pricing mix
Diversified sales outlets and an improved diluent/blend strategy protected Obsidian Energy’s netbacks through 2024, with average production near 26,000 boe/d and realized pricing benefits from better basis exposure and term contracts covering roughly 45% of volumes; expanding takeaway flexibility and disciplined hedging will help hold share through midstream volatility. It’s a quiet star, but it powers reinvestment when it matters.
- Netbacks protected via blend/diluent optimization
- ~26,000 boe/d average production in 2024
- Term contracts ≈45% of volumes stabilize realized pricing
- Priority: takeaway flexibility and disciplined hedging
HSE and community footprint
HSE and community footprint underpin Obsidian Energys license to operate; in 2024 the company reported a total recordable injury rate near 0.6 and CAD 1.2m in community investments, supporting steady safety and environmental performance that keeps growth corridors open.
Active engagement across Western Canada has reduced permitting friction and cycle risk, with management reporting a ~30% decrease in permitting delays versus 2023; transparent reporting and proactive remediation sustain stakeholder trust.
- TRIR 2024 ~0.6
- Community spend CAD 1.2m (2024)
- Permitting delays down ~30% vs 2023
- Market: TSX listed, operations focused in Western Canada
Cardium & Peace: ~26k boe/d, LOE ~US$6, term ≈45%
Obsidian’s Cardium and Peace River cores are Stars: YTD 2024 volume growth from repeatable multi‑well pads and multi‑leg wells, LOE ~US$6/boe, and top‑quartile spud‑to‑onstream cycles. Term contracts ≈45% and blend optimization protected netbacks as realized production averaged ~26,000 boe/d in 2024. Prioritize pad efficiency, takeaway flexibility and disciplined hedging to sustain market share.
| Metric | 2024 |
|---|---|
| Avg production | ~26,000 boe/d |
| LOE | ~US$6/boe |
| Term cover | ≈45% |
| TRIR | ~0.6 |
What is included in the product
 Detailed Word Document
BCG Matrix for Obsidian Energy: quadrant analysis with strategic actions, investment priorities, risks and market trend context.

 Customizable Excel Spreadsheet
One-page BCG matrix pinpointing Obsidian Energy units, clearing decision clutter so execs act faster
Cash Cows

Mature Cardium waterflood
Mature Cardium waterflood delivers low‑decline, high‑share barrels that acted as Obsidian Energy’s predictable cash generator in 2024, accounting for roughly 40% of light oil production and supporting steady free cash flow. Modest optimization—pattern tweaks and lift upgrades—has improved recovery by an estimated few percentage points without major capex, preserving operating margins. Maintain base integrity, milk margins, and deploy excess cash to fund the next tranche of Cardium step‑outs.
Viking light oil infill
Viking light oil infill sits as a reliable cash cow for Obsidian Energy: shallower declines and well-mapped geology deliver steady per-well cashflow in a mature pocket. Minimal facilities spend and repeatable drilling keep capital cycles short, effectively cash in, cash out. Maintain tight spacing discipline and selective recompletions to protect EURs and netback. Use this low-risk cash stream to quietly bankroll growth initiatives.

Legacy infrastructure leverage
Owned batteries, pipelines and pads cut unit operating costs—Obsidian reported >90% facility utilization in 2024, driving per-barrel cash costs down and fitting a Cash Cow profile. Growth capex stayed low in 2024 at under 10% of total capital, while incremental debottlenecking projects lifted netbacks by roughly C$3–6 per barrel. The mandate: don’t overbuild, sweat the assets to maximize free cash flow.

Lean G&A platform
Lean G&A platform sustains margins through scaled back-office operations and tightened vendor terms, preserving corporate margins even if volumes remain flat; every dollar saved in 2024 flowed directly to free cash flow as Obsidian maintained capital discipline. Keep investing in process automation and contract re-sets to lock recurring savings; the routine administrative efficiencies underpin cash cow stability.
- G&A focus
- Vendor terms
- Automation
- Recurring savings
Hedged production tranche
Hedged production tranche locks a portion of Obsidian Energy output at constructive prices, stabilizing cash generation and converting volatile oil and gas receipts into predictable funds. Its low-growth, high-contribution profile aligns with the Cash Cow role in the BCG matrix, funding corporate needs while preserving balance-sheet strength. Maintaining a laddered hedge book ensures capex and debt service coverage and protects downside while Stars receive capital.
- Role: stabilizes corporate cash flow
- Profile: low growth, high cash share
- Strategy: laddered hedge book for capex/debt
- Benefit: downside protection, funds Stars
High-margin, low-decline oil — >90% utilization; C$3–6/bbl netback lift
Cardium waterflood (~40% of light oil production in 2024) and Viking infill provided low‑decline, high‑margin barrels; facilities >90% utilized in 2024, keeping unit Opex low. Growth capex stayed <10% of total capital in 2024 while small debottlenecks raised netbacks ~C$3–6/bbl. Laddered hedges stabilized cash for capex and debt service.
| Metric | 2024 |
|---|---|
| Cardium share | ~40% light oil |
| Facility utilization | >90% |
| Growth capex | <10% total capex |
| Netback lift | C$3–6/bbl |
Preview = Final Product
Obsidian Energy BCG Matrix
The file you're previewing here is the exact Obsidian Energy BCG Matrix you'll receive after purchase—no watermarks, no placeholders, just the finished analysis. It’s been crafted for clarity and strategic use, ready to drop into presentations or planning sessions. After buying, the full document is delivered instantly and is fully editable, printable, and client-ready. No surprises—what you see is what you get.

Visual. Strategic. Downloadable.
Curious where Obsidian Energy’s assets land — Stars, Cash Cows, Dogs or Question Marks? This snapshot shows the outline; the full BCG Matrix gives you quadrant-by-quadrant placement, data-backed recommendations, and tactical moves to optimize capital and focus. Buy the complete report for a ready-to-use Word analysis plus a high-level Excel summary, so you can present, decide, and act fast.
Stars
Cardium light oil growth engine
Obsidian’s core Cardium program sits in a growing light‑oil window with repeatable multi‑well pads, driving year‑to‑date 2024 volume growth versus prior year while holding unit costs broadly stable. Strong well results and stacked inventory support rising volumes; management continues to emphasize drilling cadence, completions intensity and fast tie‑ins to defend share. If momentum sustains as basin growth cools later in 2024, this set can flip into Cash Cow territory.
Peace River heavy oil ramp (multi‑leg)
Peace River development is re-accelerating with multi-leg horizontals unlocking thicker pay and delivering step-change uplift in well productivity. It’s a competitive area, but Obsidian’s focused footprint and operational learnings are pushing rates higher, faster across the core. Prioritize pad efficiency, winter access planning, and marketing optionality to manage differentials and scale now while growth is hot to cement niche leadership.
Operational efficiency edge (LOE + cycle time)
High market share in Obsidian’s core (top‑quartile performance) stems from roughly 20–30% faster spud‑to‑onstream cycles and LOE near US$6/boe in 2024, enabling throughput to reach about 43,000 boe/d without cash strain. That operational engine fuels growth while keeping capital intensity moderate. Continued investment in field automation, real‑time data and centralized prep yards compounds the edge, turning throughput into sustained share.
Market access and pricing mix
Diversified sales outlets and an improved diluent/blend strategy protected Obsidian Energy’s netbacks through 2024, with average production near 26,000 boe/d and realized pricing benefits from better basis exposure and term contracts covering roughly 45% of volumes; expanding takeaway flexibility and disciplined hedging will help hold share through midstream volatility. It’s a quiet star, but it powers reinvestment when it matters.
- Netbacks protected via blend/diluent optimization
- ~26,000 boe/d average production in 2024
- Term contracts ≈45% of volumes stabilize realized pricing
- Priority: takeaway flexibility and disciplined hedging
HSE and community footprint
HSE and community footprint underpin Obsidian Energys license to operate; in 2024 the company reported a total recordable injury rate near 0.6 and CAD 1.2m in community investments, supporting steady safety and environmental performance that keeps growth corridors open.
Active engagement across Western Canada has reduced permitting friction and cycle risk, with management reporting a ~30% decrease in permitting delays versus 2023; transparent reporting and proactive remediation sustain stakeholder trust.
- TRIR 2024 ~0.6
- Community spend CAD 1.2m (2024)
- Permitting delays down ~30% vs 2023
- Market: TSX listed, operations focused in Western Canada
Cardium & Peace: ~26k boe/d, LOE ~US$6, term ≈45%
Obsidian’s Cardium and Peace River cores are Stars: YTD 2024 volume growth from repeatable multi‑well pads and multi‑leg wells, LOE ~US$6/boe, and top‑quartile spud‑to‑onstream cycles. Term contracts ≈45% and blend optimization protected netbacks as realized production averaged ~26,000 boe/d in 2024. Prioritize pad efficiency, takeaway flexibility and disciplined hedging to sustain market share.
| Metric | 2024 |
|---|---|
| Avg production | ~26,000 boe/d |
| LOE | ~US$6/boe |
| Term cover | ≈45% |
| TRIR | ~0.6 |
What is included in the product
Detailed Word Document
BCG Matrix for Obsidian Energy: quadrant analysis with strategic actions, investment priorities, risks and market trend context.
Customizable Excel Spreadsheet
One-page BCG matrix pinpointing Obsidian Energy units, clearing decision clutter so execs act faster
Cash Cows
Mature Cardium waterflood
Mature Cardium waterflood delivers low‑decline, high‑share barrels that acted as Obsidian Energy’s predictable cash generator in 2024, accounting for roughly 40% of light oil production and supporting steady free cash flow. Modest optimization—pattern tweaks and lift upgrades—has improved recovery by an estimated few percentage points without major capex, preserving operating margins. Maintain base integrity, milk margins, and deploy excess cash to fund the next tranche of Cardium step‑outs.
Viking light oil infill
Viking light oil infill sits as a reliable cash cow for Obsidian Energy: shallower declines and well-mapped geology deliver steady per-well cashflow in a mature pocket. Minimal facilities spend and repeatable drilling keep capital cycles short, effectively cash in, cash out. Maintain tight spacing discipline and selective recompletions to protect EURs and netback. Use this low-risk cash stream to quietly bankroll growth initiatives.
Legacy infrastructure leverage
Owned batteries, pipelines and pads cut unit operating costs—Obsidian reported >90% facility utilization in 2024, driving per-barrel cash costs down and fitting a Cash Cow profile. Growth capex stayed low in 2024 at under 10% of total capital, while incremental debottlenecking projects lifted netbacks by roughly C$3–6 per barrel. The mandate: don’t overbuild, sweat the assets to maximize free cash flow.
Lean G&A platform
Lean G&A platform sustains margins through scaled back-office operations and tightened vendor terms, preserving corporate margins even if volumes remain flat; every dollar saved in 2024 flowed directly to free cash flow as Obsidian maintained capital discipline. Keep investing in process automation and contract re-sets to lock recurring savings; the routine administrative efficiencies underpin cash cow stability.
- G&A focus
- Vendor terms
- Automation
- Recurring savings
Hedged production tranche
Hedged production tranche locks a portion of Obsidian Energy output at constructive prices, stabilizing cash generation and converting volatile oil and gas receipts into predictable funds. Its low-growth, high-contribution profile aligns with the Cash Cow role in the BCG matrix, funding corporate needs while preserving balance-sheet strength. Maintaining a laddered hedge book ensures capex and debt service coverage and protects downside while Stars receive capital.
- Role: stabilizes corporate cash flow
- Profile: low growth, high cash share
- Strategy: laddered hedge book for capex/debt
- Benefit: downside protection, funds Stars
High-margin, low-decline oil — >90% utilization; C$3–6/bbl netback lift
Cardium waterflood (~40% of light oil production in 2024) and Viking infill provided low‑decline, high‑margin barrels; facilities >90% utilized in 2024, keeping unit Opex low. Growth capex stayed <10% of total capital in 2024 while small debottlenecks raised netbacks ~C$3–6/bbl. Laddered hedges stabilized cash for capex and debt service.
| Metric | 2024 |
|---|---|
| Cardium share | ~40% light oil |
| Facility utilization | >90% |
| Growth capex | <10% total capex |
| Netback lift | C$3–6/bbl |
Preview = Final Product
Obsidian Energy BCG Matrix
The file you're previewing here is the exact Obsidian Energy BCG Matrix you'll receive after purchase—no watermarks, no placeholders, just the finished analysis. It’s been crafted for clarity and strategic use, ready to drop into presentations or planning sessions. After buying, the full document is delivered instantly and is fully editable, printable, and client-ready. No surprises—what you see is what you get.
Original: $10.00
-65%$10.00
$3.50Description
Visual. Strategic. Downloadable.
Curious where Obsidian Energy’s assets land — Stars, Cash Cows, Dogs or Question Marks? This snapshot shows the outline; the full BCG Matrix gives you quadrant-by-quadrant placement, data-backed recommendations, and tactical moves to optimize capital and focus. Buy the complete report for a ready-to-use Word analysis plus a high-level Excel summary, so you can present, decide, and act fast.
Stars
Cardium light oil growth engine
Obsidian’s core Cardium program sits in a growing light‑oil window with repeatable multi‑well pads, driving year‑to‑date 2024 volume growth versus prior year while holding unit costs broadly stable. Strong well results and stacked inventory support rising volumes; management continues to emphasize drilling cadence, completions intensity and fast tie‑ins to defend share. If momentum sustains as basin growth cools later in 2024, this set can flip into Cash Cow territory.
Peace River heavy oil ramp (multi‑leg)
Peace River development is re-accelerating with multi-leg horizontals unlocking thicker pay and delivering step-change uplift in well productivity. It’s a competitive area, but Obsidian’s focused footprint and operational learnings are pushing rates higher, faster across the core. Prioritize pad efficiency, winter access planning, and marketing optionality to manage differentials and scale now while growth is hot to cement niche leadership.
Operational efficiency edge (LOE + cycle time)
High market share in Obsidian’s core (top‑quartile performance) stems from roughly 20–30% faster spud‑to‑onstream cycles and LOE near US$6/boe in 2024, enabling throughput to reach about 43,000 boe/d without cash strain. That operational engine fuels growth while keeping capital intensity moderate. Continued investment in field automation, real‑time data and centralized prep yards compounds the edge, turning throughput into sustained share.
Market access and pricing mix
Diversified sales outlets and an improved diluent/blend strategy protected Obsidian Energy’s netbacks through 2024, with average production near 26,000 boe/d and realized pricing benefits from better basis exposure and term contracts covering roughly 45% of volumes; expanding takeaway flexibility and disciplined hedging will help hold share through midstream volatility. It’s a quiet star, but it powers reinvestment when it matters.
- Netbacks protected via blend/diluent optimization
- ~26,000 boe/d average production in 2024
- Term contracts ≈45% of volumes stabilize realized pricing
- Priority: takeaway flexibility and disciplined hedging
HSE and community footprint
HSE and community footprint underpin Obsidian Energys license to operate; in 2024 the company reported a total recordable injury rate near 0.6 and CAD 1.2m in community investments, supporting steady safety and environmental performance that keeps growth corridors open.
Active engagement across Western Canada has reduced permitting friction and cycle risk, with management reporting a ~30% decrease in permitting delays versus 2023; transparent reporting and proactive remediation sustain stakeholder trust.
- TRIR 2024 ~0.6
- Community spend CAD 1.2m (2024)
- Permitting delays down ~30% vs 2023
- Market: TSX listed, operations focused in Western Canada
Cardium & Peace: ~26k boe/d, LOE ~US$6, term ≈45%
Obsidian’s Cardium and Peace River cores are Stars: YTD 2024 volume growth from repeatable multi‑well pads and multi‑leg wells, LOE ~US$6/boe, and top‑quartile spud‑to‑onstream cycles. Term contracts ≈45% and blend optimization protected netbacks as realized production averaged ~26,000 boe/d in 2024. Prioritize pad efficiency, takeaway flexibility and disciplined hedging to sustain market share.
| Metric | 2024 |
|---|---|
| Avg production | ~26,000 boe/d |
| LOE | ~US$6/boe |
| Term cover | ≈45% |
| TRIR | ~0.6 |
What is included in the product
Detailed Word Document
BCG Matrix for Obsidian Energy: quadrant analysis with strategic actions, investment priorities, risks and market trend context.
Customizable Excel Spreadsheet
One-page BCG matrix pinpointing Obsidian Energy units, clearing decision clutter so execs act faster
Cash Cows
Mature Cardium waterflood
Mature Cardium waterflood delivers low‑decline, high‑share barrels that acted as Obsidian Energy’s predictable cash generator in 2024, accounting for roughly 40% of light oil production and supporting steady free cash flow. Modest optimization—pattern tweaks and lift upgrades—has improved recovery by an estimated few percentage points without major capex, preserving operating margins. Maintain base integrity, milk margins, and deploy excess cash to fund the next tranche of Cardium step‑outs.
Viking light oil infill
Viking light oil infill sits as a reliable cash cow for Obsidian Energy: shallower declines and well-mapped geology deliver steady per-well cashflow in a mature pocket. Minimal facilities spend and repeatable drilling keep capital cycles short, effectively cash in, cash out. Maintain tight spacing discipline and selective recompletions to protect EURs and netback. Use this low-risk cash stream to quietly bankroll growth initiatives.
Legacy infrastructure leverage
Owned batteries, pipelines and pads cut unit operating costs—Obsidian reported >90% facility utilization in 2024, driving per-barrel cash costs down and fitting a Cash Cow profile. Growth capex stayed low in 2024 at under 10% of total capital, while incremental debottlenecking projects lifted netbacks by roughly C$3–6 per barrel. The mandate: don’t overbuild, sweat the assets to maximize free cash flow.
Lean G&A platform
Lean G&A platform sustains margins through scaled back-office operations and tightened vendor terms, preserving corporate margins even if volumes remain flat; every dollar saved in 2024 flowed directly to free cash flow as Obsidian maintained capital discipline. Keep investing in process automation and contract re-sets to lock recurring savings; the routine administrative efficiencies underpin cash cow stability.
- G&A focus
- Vendor terms
- Automation
- Recurring savings
Hedged production tranche
Hedged production tranche locks a portion of Obsidian Energy output at constructive prices, stabilizing cash generation and converting volatile oil and gas receipts into predictable funds. Its low-growth, high-contribution profile aligns with the Cash Cow role in the BCG matrix, funding corporate needs while preserving balance-sheet strength. Maintaining a laddered hedge book ensures capex and debt service coverage and protects downside while Stars receive capital.
- Role: stabilizes corporate cash flow
- Profile: low growth, high cash share
- Strategy: laddered hedge book for capex/debt
- Benefit: downside protection, funds Stars
High-margin, low-decline oil — >90% utilization; C$3–6/bbl netback lift
Cardium waterflood (~40% of light oil production in 2024) and Viking infill provided low‑decline, high‑margin barrels; facilities >90% utilized in 2024, keeping unit Opex low. Growth capex stayed <10% of total capital in 2024 while small debottlenecks raised netbacks ~C$3–6/bbl. Laddered hedges stabilized cash for capex and debt service.
| Metric | 2024 |
|---|---|
| Cardium share | ~40% light oil |
| Facility utilization | >90% |
| Growth capex | <10% total capex |
| Netback lift | C$3–6/bbl |
Preview = Final Product
Obsidian Energy BCG Matrix
The file you're previewing here is the exact Obsidian Energy BCG Matrix you'll receive after purchase—no watermarks, no placeholders, just the finished analysis. It’s been crafted for clarity and strategic use, ready to drop into presentations or planning sessions. After buying, the full document is delivered instantly and is fully editable, printable, and client-ready. No surprises—what you see is what you get.











