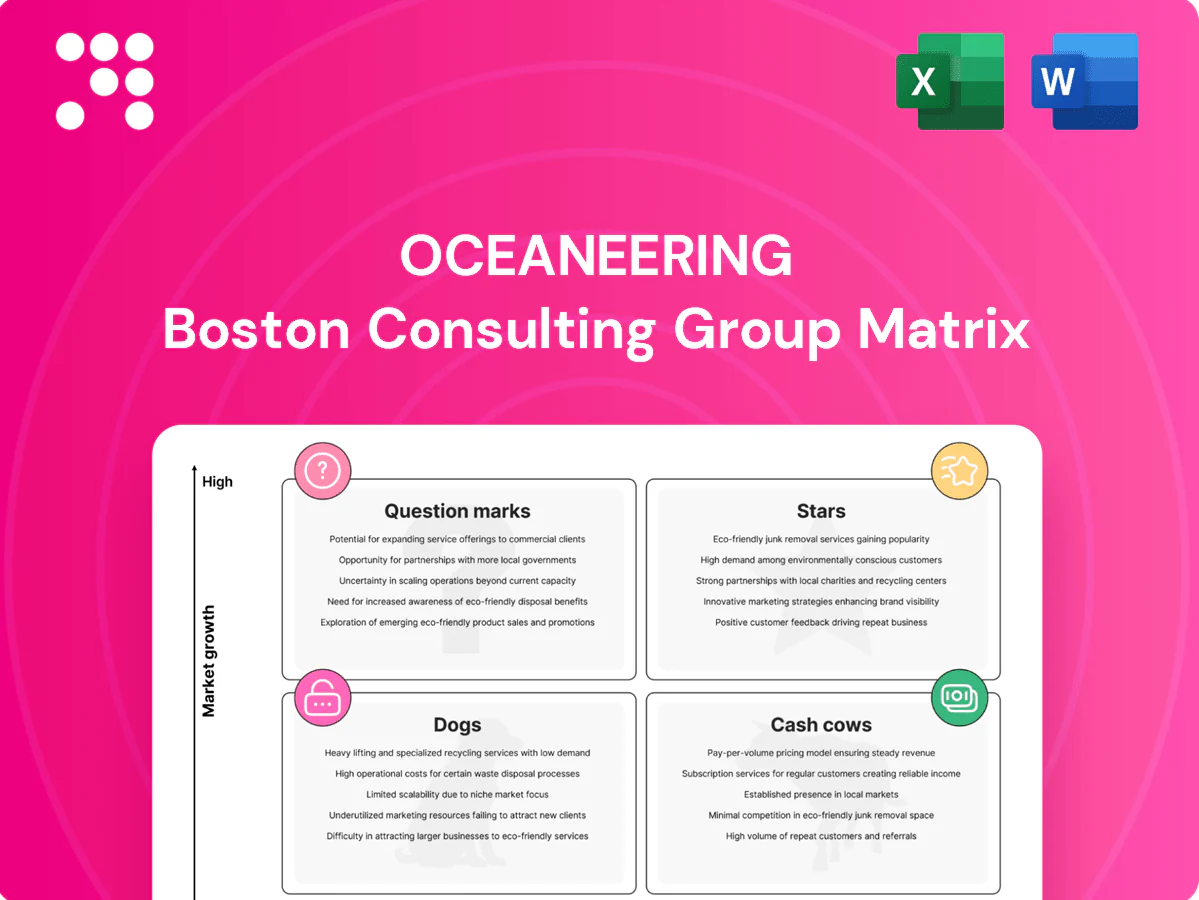
Oceaneering Boston Consulting Group Matrix

Unlock Strategic Clarity
Curious where Oceaneering’s products fall — Stars, Cash Cows, Dogs, or Question Marks? This snapshot hints at positioning, but the full BCG Matrix gives quadrant-level clarity, data-backed takeaways, and practical moves you can act on fast. Buy the complete report (Word + Excel) to skip the guesswork, see exactly which business lines to back or cut, and get a ready-to-present strategic roadmap.
Stars

ROV Services Leadership
Oceaneering's work-class ROV fleet remains market-leading in 2024, supporting rising deepwater drilling and IMR activity with strong contract visibility and premium day rates. Continuous capex in vehicles, tooling, and pilots is required to sustain technological advantage and high utilization. If it holds share through sustained upgrades and contracts, the segment will mature into a consistent cash generator.
Subsea Robotics & Intervention Tooling
Subsea Robotics & Intervention Tooling sits in Stars as demand surges for advanced manipulators, resident robots and specialized intervention kits driven by a double-digit CAGR in subsea robotics through 2024. Oceaneering’s integration with its ROV operations provides a durable moat and faster time-to-solution versus pure-play suppliers. Defending leadership requires heavy engineering spend and rapid iteration cycles. Payoff is sustained dominance as subsea complexity escalates.

Integrated Subsea Services (IMR + Installation)
Integrated subsea services (IMR + Installation) bundle inspection, maintenance, repair and light construction, capturing tailwinds from a 2024 deepwater rebound that Rystad Energy estimated as roughly a 10% spending uptick year-on-year. Customers increasingly prefer one accountable partner, lifting win rates and fleet utilization for integrated providers. Execution remains capex- and labor-intensive, requiring ongoing investment to sustain margins. Scale and contractual stickiness drive momentum toward durable leadership.

Defense Robotics & Remotely Operated Systems
Defense robotics and remotely operated systems support high-priority missions with multi-year programs (typically 3–7 years) and leverage subsea-robotics tech lift; demand remains firm amid DoD modernization priorities and the US FY2024 defense budget of 858 billion, which underpins niche share gains. Development cycles are long and cash-hungry, but sustained program performance can convert this line into a stable cash engine.
- High-priority missions
- Multi-year programs (3–7 yrs)
- Subsea tech lift
- Firm, modernizing demand
- Long, cash-hungry development
- Potential stable cash engine
Autonomous Underwater Solutions (AUV/Resident Systems)
Data-first subsea operations are accelerating as operators chase lower opex and safety, with the AUV market hitting about $3.1B in 2024 and a ~13% CAGR projected to 2030. Oceaneering’s resident platforms and autonomy stack are gaining traction, supported by growing commercial trials and fleet deployments. Scaling this requires heavy software, battery, and docking investments; if adoption keeps climbing, this becomes a crown jewel.
- Market: AUV market ~$3.1B (2024), CAGR ~13% to 2030
- Investment: high capex in software, batteries, docking
- Oceaneering: rising fleet deployments and autonomy trials
- Upside: potential crown-jewel asset with continued adoption
Deepwater ROVs hold premium rates; AUV, IMR, defense upgrades drive next growth
Oceaneering’s work‑class ROVs, buoyed by a 2024 deepwater rebound (~+10% spend), maintain premium day rates and high utilization but need steady capex to defend share.
Subsea robotics/AUVs (AUV market ~$3.1B in 2024, ~13% CAGR to 2030) and IMR integration are growth engines requiring heavy engineering and software spend.
Defense programs (US FY2024 budget $858B) and data-first ops can convert Stars into long-term cash generators if execution and upgrades persist.
| Segment | 2024 metric | Key requirement |
|---|---|---|
| ROV | High utilization; +10% deepwater spend | Capex, tooling |
| AUV/Robotics | $3.1B market; ~13% CAGR | Software, batteries |
| Defense | Backed by $858B FY24 | Long R&D |
What is included in the product
 Detailed Word Document
Oceaneering BCG Matrix: maps Stars, Cash Cows, Question Marks and Dogs with clear invest, hold or divest recommendations.

 Customizable Excel Spreadsheet
One-page Oceaneering BCG matrix mapping units to quadrants, cutting strategic noise for C-level decisions.
Cash Cows

Umbilicals & Subsea Hardware Manufacturing
Umbilicals & subsea hardware are mature Oceaneering cash cows with entrenched qualifications and an installed-base trusted by operators; repeat awards are driven by scale, certifications, and a multi-decade track record. Growth is modest—industry demand up low-single digits in 2024—but margins improved as throughput and lean manufacturing raised segment profitability. Oceaneering reported roughly $1.3B revenue in 2024, enabling steady cash generation; keep plant efficiency tight and milk free cash flow.
Asset Integrity & Inspection Services
Asset integrity and inspection services provide recurring offshore/onshore inspections, NDT and integrity management; the global NDT market reached about $11B in 2024, supporting steady demand. Sticky contracts and predictable volumes drive reliable cash and mid-teens margins when utilization is managed, with cross-sell into robotics lifting wallet share. Investing in digital workflows can boost productivity 5–10% and squeeze incremental cash.

Grayloc and Pressure Containment Components
Grayloc and Pressure Containment Components deliver standardized, qualified connector systems for energy and industrial customers, backed by a legacy of over 40 years in service. As of 2024 the product line is specified by major oil and gas operators and supported by a global parts network across 20+ countries, creating high switching costs. Minimal promotion is required; operational excellence and recurring aftermarket sales drive double-digit contribution margins. A dependable cash fountain for the portfolio.

Onsite Project Services & Staffing
Onsite Project Services & Staffing functions as a cash cow: embedded field support with operator teams drives steady demand tied to annual maintenance budgets rather than sporadic capex cycles; 2024 utilization hovered near 82%, gross margins around 17%, and capex intensity under 3% of service revenue, enabling high repeatability when crews remain utilized.
- Embedded field teams
- Maintenance-driven demand
- Utilization ~82% (2024)
- Gross margin ~17%
- Low capex <3%
- Lean overhead funds bets
Aftermarket Spares & Lifecycle Support
In 2024, Oceaneering's Aftermarket Spares & Lifecycle Support leveraged a large installed base of ROVs, tooling and hardware to generate steady, higher-margin spare-parts and service revenue with low end-market growth; predictable service pull created consistent cash flow and quietly paid core overheads.
- Large installed base of ROVs and tooling drives recurring demand
- Predictable, higher-margin, low-growth cash stream
- Excellent working-capital profile when inventory disciplined
- Core contributor to operational cash generation in 2024
Subsea cash engines — $1.3B base, high utilization and aftermarket to boost FCF
Oceaneering's cash cows—umbilicals & subsea hardware, asset integrity/NDT, Grayloc/pressure components, onsite services and aftermarket spares—generated stable cash in 2024, leveraging a $1.3B company revenue base and large installed assets. Utilization and lean ops drove mid- to double-digit margins; NDT market ~ $11B. Focus: efficiency, aftermarket growth, digital workflows to lift FCF.
| Segment | 2024 metric | Margin/notes |
|---|---|---|
| Company | $1.3B revenue | FCF focus |
| Asset integrity | — | Utilization ~82%, GM ~17% |
Delivered as Shown
Oceaneering BCG Matrix
The Oceaneering BCG Matrix you're previewing is the exact file you'll receive after purchase. No watermarks, no demo text—just the finished, professionally formatted strategic report. It's ready to edit, print, or present to stakeholders immediately. Delivered as-is to your inbox with clear, market-backed analysis and no surprises.

Unlock Strategic Clarity
Curious where Oceaneering’s products fall — Stars, Cash Cows, Dogs, or Question Marks? This snapshot hints at positioning, but the full BCG Matrix gives quadrant-level clarity, data-backed takeaways, and practical moves you can act on fast. Buy the complete report (Word + Excel) to skip the guesswork, see exactly which business lines to back or cut, and get a ready-to-present strategic roadmap.
Stars
ROV Services Leadership
Oceaneering's work-class ROV fleet remains market-leading in 2024, supporting rising deepwater drilling and IMR activity with strong contract visibility and premium day rates. Continuous capex in vehicles, tooling, and pilots is required to sustain technological advantage and high utilization. If it holds share through sustained upgrades and contracts, the segment will mature into a consistent cash generator.
Subsea Robotics & Intervention Tooling
Subsea Robotics & Intervention Tooling sits in Stars as demand surges for advanced manipulators, resident robots and specialized intervention kits driven by a double-digit CAGR in subsea robotics through 2024. Oceaneering’s integration with its ROV operations provides a durable moat and faster time-to-solution versus pure-play suppliers. Defending leadership requires heavy engineering spend and rapid iteration cycles. Payoff is sustained dominance as subsea complexity escalates.
Integrated Subsea Services (IMR + Installation)
Integrated subsea services (IMR + Installation) bundle inspection, maintenance, repair and light construction, capturing tailwinds from a 2024 deepwater rebound that Rystad Energy estimated as roughly a 10% spending uptick year-on-year. Customers increasingly prefer one accountable partner, lifting win rates and fleet utilization for integrated providers. Execution remains capex- and labor-intensive, requiring ongoing investment to sustain margins. Scale and contractual stickiness drive momentum toward durable leadership.
Defense Robotics & Remotely Operated Systems
Defense robotics and remotely operated systems support high-priority missions with multi-year programs (typically 3–7 years) and leverage subsea-robotics tech lift; demand remains firm amid DoD modernization priorities and the US FY2024 defense budget of 858 billion, which underpins niche share gains. Development cycles are long and cash-hungry, but sustained program performance can convert this line into a stable cash engine.
- High-priority missions
- Multi-year programs (3–7 yrs)
- Subsea tech lift
- Firm, modernizing demand
- Long, cash-hungry development
- Potential stable cash engine
Autonomous Underwater Solutions (AUV/Resident Systems)
Data-first subsea operations are accelerating as operators chase lower opex and safety, with the AUV market hitting about $3.1B in 2024 and a ~13% CAGR projected to 2030. Oceaneering’s resident platforms and autonomy stack are gaining traction, supported by growing commercial trials and fleet deployments. Scaling this requires heavy software, battery, and docking investments; if adoption keeps climbing, this becomes a crown jewel.
- Market: AUV market ~$3.1B (2024), CAGR ~13% to 2030
- Investment: high capex in software, batteries, docking
- Oceaneering: rising fleet deployments and autonomy trials
- Upside: potential crown-jewel asset with continued adoption
Deepwater ROVs hold premium rates; AUV, IMR, defense upgrades drive next growth
Oceaneering’s work‑class ROVs, buoyed by a 2024 deepwater rebound (~+10% spend), maintain premium day rates and high utilization but need steady capex to defend share.
Subsea robotics/AUVs (AUV market ~$3.1B in 2024, ~13% CAGR to 2030) and IMR integration are growth engines requiring heavy engineering and software spend.
Defense programs (US FY2024 budget $858B) and data-first ops can convert Stars into long-term cash generators if execution and upgrades persist.
| Segment | 2024 metric | Key requirement |
|---|---|---|
| ROV | High utilization; +10% deepwater spend | Capex, tooling |
| AUV/Robotics | $3.1B market; ~13% CAGR | Software, batteries |
| Defense | Backed by $858B FY24 | Long R&D |
What is included in the product
Detailed Word Document
Oceaneering BCG Matrix: maps Stars, Cash Cows, Question Marks and Dogs with clear invest, hold or divest recommendations.
Customizable Excel Spreadsheet
One-page Oceaneering BCG matrix mapping units to quadrants, cutting strategic noise for C-level decisions.
Cash Cows
Umbilicals & Subsea Hardware Manufacturing
Umbilicals & subsea hardware are mature Oceaneering cash cows with entrenched qualifications and an installed-base trusted by operators; repeat awards are driven by scale, certifications, and a multi-decade track record. Growth is modest—industry demand up low-single digits in 2024—but margins improved as throughput and lean manufacturing raised segment profitability. Oceaneering reported roughly $1.3B revenue in 2024, enabling steady cash generation; keep plant efficiency tight and milk free cash flow.
Asset Integrity & Inspection Services
Asset integrity and inspection services provide recurring offshore/onshore inspections, NDT and integrity management; the global NDT market reached about $11B in 2024, supporting steady demand. Sticky contracts and predictable volumes drive reliable cash and mid-teens margins when utilization is managed, with cross-sell into robotics lifting wallet share. Investing in digital workflows can boost productivity 5–10% and squeeze incremental cash.
Grayloc and Pressure Containment Components
Grayloc and Pressure Containment Components deliver standardized, qualified connector systems for energy and industrial customers, backed by a legacy of over 40 years in service. As of 2024 the product line is specified by major oil and gas operators and supported by a global parts network across 20+ countries, creating high switching costs. Minimal promotion is required; operational excellence and recurring aftermarket sales drive double-digit contribution margins. A dependable cash fountain for the portfolio.
Onsite Project Services & Staffing
Onsite Project Services & Staffing functions as a cash cow: embedded field support with operator teams drives steady demand tied to annual maintenance budgets rather than sporadic capex cycles; 2024 utilization hovered near 82%, gross margins around 17%, and capex intensity under 3% of service revenue, enabling high repeatability when crews remain utilized.
- Embedded field teams
- Maintenance-driven demand
- Utilization ~82% (2024)
- Gross margin ~17%
- Low capex <3%
- Lean overhead funds bets
Aftermarket Spares & Lifecycle Support
In 2024, Oceaneering's Aftermarket Spares & Lifecycle Support leveraged a large installed base of ROVs, tooling and hardware to generate steady, higher-margin spare-parts and service revenue with low end-market growth; predictable service pull created consistent cash flow and quietly paid core overheads.
- Large installed base of ROVs and tooling drives recurring demand
- Predictable, higher-margin, low-growth cash stream
- Excellent working-capital profile when inventory disciplined
- Core contributor to operational cash generation in 2024
Subsea cash engines — $1.3B base, high utilization and aftermarket to boost FCF
Oceaneering's cash cows—umbilicals & subsea hardware, asset integrity/NDT, Grayloc/pressure components, onsite services and aftermarket spares—generated stable cash in 2024, leveraging a $1.3B company revenue base and large installed assets. Utilization and lean ops drove mid- to double-digit margins; NDT market ~ $11B. Focus: efficiency, aftermarket growth, digital workflows to lift FCF.
| Segment | 2024 metric | Margin/notes |
|---|---|---|
| Company | $1.3B revenue | FCF focus |
| Asset integrity | — | Utilization ~82%, GM ~17% |
Delivered as Shown
Oceaneering BCG Matrix
The Oceaneering BCG Matrix you're previewing is the exact file you'll receive after purchase. No watermarks, no demo text—just the finished, professionally formatted strategic report. It's ready to edit, print, or present to stakeholders immediately. Delivered as-is to your inbox with clear, market-backed analysis and no surprises.
Description
Unlock Strategic Clarity
Curious where Oceaneering’s products fall — Stars, Cash Cows, Dogs, or Question Marks? This snapshot hints at positioning, but the full BCG Matrix gives quadrant-level clarity, data-backed takeaways, and practical moves you can act on fast. Buy the complete report (Word + Excel) to skip the guesswork, see exactly which business lines to back or cut, and get a ready-to-present strategic roadmap.
Stars
ROV Services Leadership
Oceaneering's work-class ROV fleet remains market-leading in 2024, supporting rising deepwater drilling and IMR activity with strong contract visibility and premium day rates. Continuous capex in vehicles, tooling, and pilots is required to sustain technological advantage and high utilization. If it holds share through sustained upgrades and contracts, the segment will mature into a consistent cash generator.
Subsea Robotics & Intervention Tooling
Subsea Robotics & Intervention Tooling sits in Stars as demand surges for advanced manipulators, resident robots and specialized intervention kits driven by a double-digit CAGR in subsea robotics through 2024. Oceaneering’s integration with its ROV operations provides a durable moat and faster time-to-solution versus pure-play suppliers. Defending leadership requires heavy engineering spend and rapid iteration cycles. Payoff is sustained dominance as subsea complexity escalates.
Integrated Subsea Services (IMR + Installation)
Integrated subsea services (IMR + Installation) bundle inspection, maintenance, repair and light construction, capturing tailwinds from a 2024 deepwater rebound that Rystad Energy estimated as roughly a 10% spending uptick year-on-year. Customers increasingly prefer one accountable partner, lifting win rates and fleet utilization for integrated providers. Execution remains capex- and labor-intensive, requiring ongoing investment to sustain margins. Scale and contractual stickiness drive momentum toward durable leadership.
Defense Robotics & Remotely Operated Systems
Defense robotics and remotely operated systems support high-priority missions with multi-year programs (typically 3–7 years) and leverage subsea-robotics tech lift; demand remains firm amid DoD modernization priorities and the US FY2024 defense budget of 858 billion, which underpins niche share gains. Development cycles are long and cash-hungry, but sustained program performance can convert this line into a stable cash engine.
- High-priority missions
- Multi-year programs (3–7 yrs)
- Subsea tech lift
- Firm, modernizing demand
- Long, cash-hungry development
- Potential stable cash engine
Autonomous Underwater Solutions (AUV/Resident Systems)
Data-first subsea operations are accelerating as operators chase lower opex and safety, with the AUV market hitting about $3.1B in 2024 and a ~13% CAGR projected to 2030. Oceaneering’s resident platforms and autonomy stack are gaining traction, supported by growing commercial trials and fleet deployments. Scaling this requires heavy software, battery, and docking investments; if adoption keeps climbing, this becomes a crown jewel.
- Market: AUV market ~$3.1B (2024), CAGR ~13% to 2030
- Investment: high capex in software, batteries, docking
- Oceaneering: rising fleet deployments and autonomy trials
- Upside: potential crown-jewel asset with continued adoption
Deepwater ROVs hold premium rates; AUV, IMR, defense upgrades drive next growth
Oceaneering’s work‑class ROVs, buoyed by a 2024 deepwater rebound (~+10% spend), maintain premium day rates and high utilization but need steady capex to defend share.
Subsea robotics/AUVs (AUV market ~$3.1B in 2024, ~13% CAGR to 2030) and IMR integration are growth engines requiring heavy engineering and software spend.
Defense programs (US FY2024 budget $858B) and data-first ops can convert Stars into long-term cash generators if execution and upgrades persist.
| Segment | 2024 metric | Key requirement |
|---|---|---|
| ROV | High utilization; +10% deepwater spend | Capex, tooling |
| AUV/Robotics | $3.1B market; ~13% CAGR | Software, batteries |
| Defense | Backed by $858B FY24 | Long R&D |
What is included in the product
Detailed Word Document
Oceaneering BCG Matrix: maps Stars, Cash Cows, Question Marks and Dogs with clear invest, hold or divest recommendations.
Customizable Excel Spreadsheet
One-page Oceaneering BCG matrix mapping units to quadrants, cutting strategic noise for C-level decisions.
Cash Cows
Umbilicals & Subsea Hardware Manufacturing
Umbilicals & subsea hardware are mature Oceaneering cash cows with entrenched qualifications and an installed-base trusted by operators; repeat awards are driven by scale, certifications, and a multi-decade track record. Growth is modest—industry demand up low-single digits in 2024—but margins improved as throughput and lean manufacturing raised segment profitability. Oceaneering reported roughly $1.3B revenue in 2024, enabling steady cash generation; keep plant efficiency tight and milk free cash flow.
Asset Integrity & Inspection Services
Asset integrity and inspection services provide recurring offshore/onshore inspections, NDT and integrity management; the global NDT market reached about $11B in 2024, supporting steady demand. Sticky contracts and predictable volumes drive reliable cash and mid-teens margins when utilization is managed, with cross-sell into robotics lifting wallet share. Investing in digital workflows can boost productivity 5–10% and squeeze incremental cash.
Grayloc and Pressure Containment Components
Grayloc and Pressure Containment Components deliver standardized, qualified connector systems for energy and industrial customers, backed by a legacy of over 40 years in service. As of 2024 the product line is specified by major oil and gas operators and supported by a global parts network across 20+ countries, creating high switching costs. Minimal promotion is required; operational excellence and recurring aftermarket sales drive double-digit contribution margins. A dependable cash fountain for the portfolio.
Onsite Project Services & Staffing
Onsite Project Services & Staffing functions as a cash cow: embedded field support with operator teams drives steady demand tied to annual maintenance budgets rather than sporadic capex cycles; 2024 utilization hovered near 82%, gross margins around 17%, and capex intensity under 3% of service revenue, enabling high repeatability when crews remain utilized.
- Embedded field teams
- Maintenance-driven demand
- Utilization ~82% (2024)
- Gross margin ~17%
- Low capex <3%
- Lean overhead funds bets
Aftermarket Spares & Lifecycle Support
In 2024, Oceaneering's Aftermarket Spares & Lifecycle Support leveraged a large installed base of ROVs, tooling and hardware to generate steady, higher-margin spare-parts and service revenue with low end-market growth; predictable service pull created consistent cash flow and quietly paid core overheads.
- Large installed base of ROVs and tooling drives recurring demand
- Predictable, higher-margin, low-growth cash stream
- Excellent working-capital profile when inventory disciplined
- Core contributor to operational cash generation in 2024
Subsea cash engines — $1.3B base, high utilization and aftermarket to boost FCF
Oceaneering's cash cows—umbilicals & subsea hardware, asset integrity/NDT, Grayloc/pressure components, onsite services and aftermarket spares—generated stable cash in 2024, leveraging a $1.3B company revenue base and large installed assets. Utilization and lean ops drove mid- to double-digit margins; NDT market ~ $11B. Focus: efficiency, aftermarket growth, digital workflows to lift FCF.
| Segment | 2024 metric | Margin/notes |
|---|---|---|
| Company | $1.3B revenue | FCF focus |
| Asset integrity | — | Utilization ~82%, GM ~17% |
Delivered as Shown
Oceaneering BCG Matrix
The Oceaneering BCG Matrix you're previewing is the exact file you'll receive after purchase. No watermarks, no demo text—just the finished, professionally formatted strategic report. It's ready to edit, print, or present to stakeholders immediately. Delivered as-is to your inbox with clear, market-backed analysis and no surprises.











