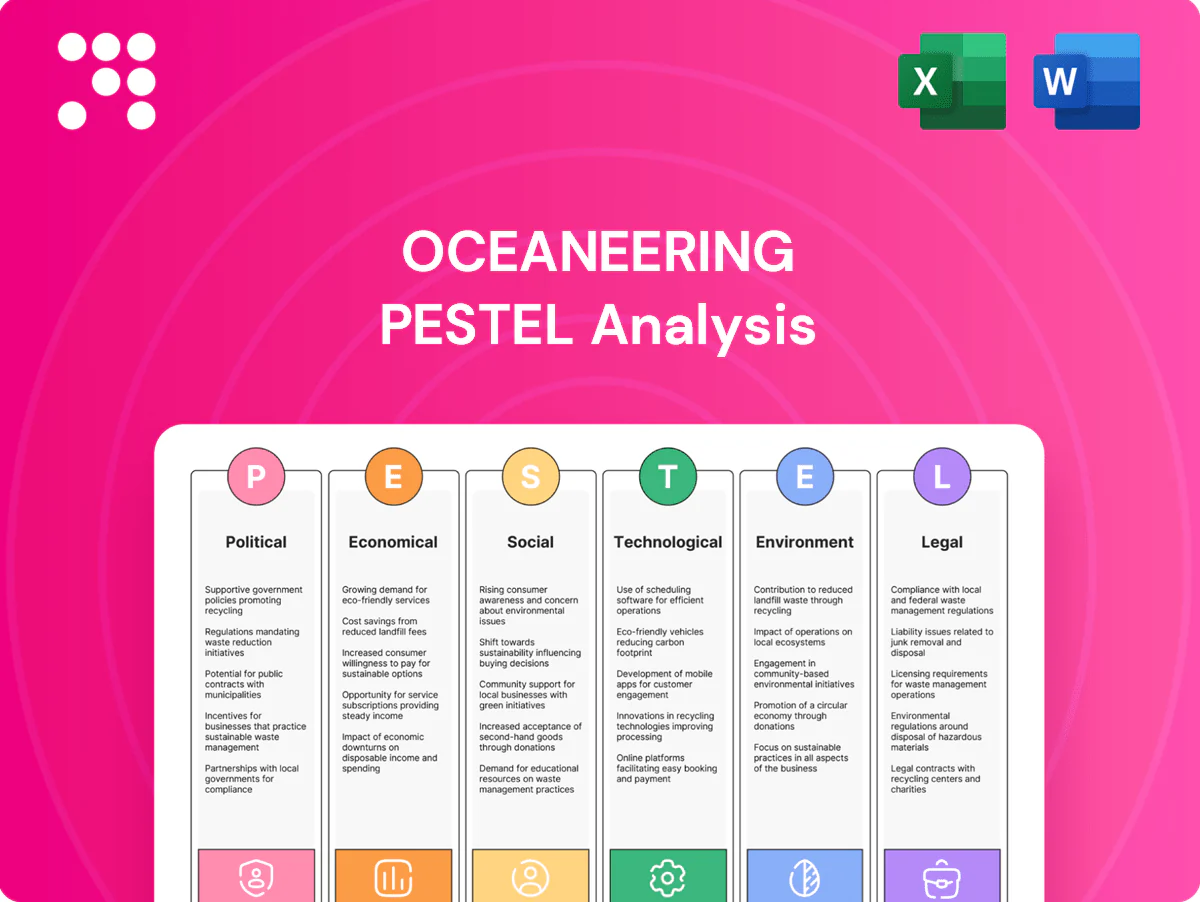
Oceaneering PESTLE Analysis

Your Competitive Advantage Starts with This Report
Unlock how political, economic, social, technological, legal and environmental forces are reshaping Oceaneering’s strategy and risk profile. Our concise PESTLE highlights near-term threats and growth levers across offshore and subsea markets. Ideal for investors and strategists seeking actionable context. Buy the full analysis to access detailed evidence, forecasts, and ready-to-use slides.
Political factors

Offshore energy policy shifts
Offshore licensing moratoriums or accelerated leasing rounds directly reshape subsea project pipelines and vessel utilization, with license cycles typically spanning 3–5 years and project procurement windows driving seasonal fleet demand.
Changes by BOEM/BSEE, North Sea regulators or Brazil’s ANP can swing demand for ROVs and umbilicals, making awarded acreage and round cadence primary demand signals.
Oceaneering must track multiyear regulatory calendars to align backlog and asset positioning, since long-lead manufacturing and vessel mobilization commonly require 12–24 months and benefit from policy stability.
Defense spending priorities
Defense budgets shape robotics, autonomy and asset‑integrity work beyond oil and gas; US defense spending reached about $858 billion in FY2024 and global military expenditure was $2.24 trillion in 2023 (SIPRI). Geopolitical tensions boost naval, undersea and inspection programs, increasing demand for advanced ROVs and AUVs. The shift to unmanned systems favors Oceaneering’s robotics portfolio, while long procurement cycles demand multi‑year capture planning and strict compliance.

Trade, tariffs, and sanctions
Export controls and sanctions (eg. US/EU measures restricting trade with Russia, Iran) directly limit equipment, spares and service access to certain basins and can block subsea deliveries. US Section 232 steel tariffs (25%) and duties on electronics raise COGS for umbilicals and hardware. Oceaneering requires resilient supplier networks and EAR/ITAR licensing capability; rapid rerouting of supply mitigates project delays and liquidated damages.

Local content and industrial policy
Host nations impose local content on fabrication, staffing and vessels, often mandating 30–60% domestic inputs in projects, which increases capex and extends fabrication timelines for Oceaneering; compliance can unlock bid eligibility and fiscal incentives and is material in Brazil, West Africa and the Middle East. Strategic partnerships and in-country bases improve political goodwill and documented win rates; misalignment risks fines or exclusion from tenders.
- Local content mandates: 30–60% typical
- Impact: higher capex, longer delivery
- Benefit: access to bids and tax incentives
- Mitigation: local partnerships, bases
- Risk: penalties or tender exclusion
Energy transition incentives
Energy transition incentives for offshore wind (UK 50 GW by 2030, US 30 GW by 2030), CCUS and decommissioning are shifting capital toward subsea low‑carbon work, enabling Oceaneering to repurpose ROVs, survey and integrity services for projects with multi-year funding streams. Policy carrots accelerate diversification and smooth revenues across cycles; tracking grant timelines optimizes load‑shop and fleet utilization.
- Offshore wind targets: UK 50 GW/2030, US 30 GW/2030
- Repurpose ROVs for CCUS and decommissioning surveys
- Grants create multi‑year contracts → revenue smoothing
- Monitor timelines to schedule fleets and shops
Offshore licensing 3-5 yrs; 12-24 mo mobilization; defense boosts robotics
Offshore licensing cycles (3–5 yrs) and BOEM/BSEE/ANP cadence drive ROV/umbilical demand; vessel mobilization lead times 12–24 months. US defence spend ~$858B FY2024, global military $2.24T (2023) lift robotics work. Local content 30–60% raises capex; UK 50 GW/2030, US 30 GW/2030 enable wind/CCUS diversification.
| Factor | Metric | Impact |
|---|---|---|
| Licensing | 3–5 yrs | Pipeline seasonality |
| Lead times | 12–24 mo | Asset positioning |
| Local content | 30–60% | Higher capex |
What is included in the product
 Detailed Word Document
Explores how macro-environmental factors uniquely affect Oceaneering across Political, Economic, Social, Technological, Environmental, and Legal dimensions, with data-driven insights, forward-looking scenarios, and detailed sub-points to support executives, consultants, and investors in identifying risks, opportunities, and strategy-ready recommendations for reports or pitch decks.

 Customizable Excel Spreadsheet
Clean, summarized Oceaneering PESTLE analysis, visually segmented by category for quick interpretation and easily editable so teams can add region- or business-specific notes for seamless sharing in presentations and planning sessions.
Economic factors

Hydrocarbon price cycles
Brent and gas price volatility—Brent averaged about $85/bbl in 2024—directly drives E&P capex, shifting ROV days, installations and integrity campaigns; high prices expand deepwater FIDs and backlog while lows prompt deferrals. Oceaneering reported ~ $1.9bn revenue in 2024 and its service diversification buffers but does not eliminate cyclicality. A disciplined contract mix and pricing help preserve margins through swings.
Interest rates and financing
Higher interest rates (US fed funds 5.25–5.50% in mid‑2025) raise vessel charter and equipment financing costs and can delay customer projects; refinancing becomes more expensive. Lower rates ease refinancing and stimulate energy and infrastructure capex. Oceaneering must balance fleet and manufacturing capex with ROIC targets, and strong cash conversion supports countercyclical investment.

Currency fluctuations
Oceaneering's multi-currency exposure (USD reporting with significant GBP, NOK, BRL and EUR cashflows) affects revenue recognition, local costs and translation on the balance sheet; natural hedges from local sourcing and local contracts reduce volatility while structured FX hedging programs address residual risk. Sudden devaluations can spike local wage and materials costs, and indexation or pricing clauses in contracts are used to protect profitability.

Supply chain and input costs
Rising costs for steel, polymers and semiconductors in 2024–25 tightened umbilical and robotics margins, while logistics bottlenecks and limited vessel availability pushed project schedules and increased penalty risk; dual-sourcing and targeted inventory planning preserved on-time delivery, and deeper supplier collaboration enabled design-to-cost tradeoffs without quality loss.
- Supply inputs: steel, polymers, electronics, semiconductors
- Logistics: vessel availability, schedule risk
- Mitigation: dual-sourcing, inventory planning
- Supplier strategy: design-to-cost with quality
Diversification and end-market mix
Oceaneering’s end-market diversification—defense, aerospace and entertainment—buffers offshore services volatility, helping offset oil downturns while FY2024 revenue hovered near $1.7B. Cross-sector robotics and automation lift asset utilization and spur higher-margin engineering work. A balanced portfolio supports steadier cash flow and valuation multiples; disciplined capex preserves core subsea capabilities without dilution.
- Defense/aerospace/entertainment: downside protection
- Robotics/automation: higher asset utilization
- Portfolio: stable cash flows, stronger multiples
- Capital allocation: protects subsea core
Offshore licensing 3-5 yrs; 12-24 mo mobilization; defense boosts robotics
Brent at ~$85/bbl in 2024 drives E&P capex and subsea activity; Oceaneering revenue ~$1.9bn in 2024 buffers but cyclicality remains. US rates 5.25–5.50% (mid‑2025) raise financing costs; multi‑currency exposure (GBP, NOK, BRL, EUR) and input inflation (steel, semiconductors) pressure margins.
| Metric | 2024/2025 |
|---|---|
| Revenue | $1.9bn (2024) |
| Brent | $85/bbl (2024) |
| Fed funds | 5.25–5.50% (mid‑2025) |
Full Version Awaits
Oceaneering PESTLE Analysis
The Oceaneering PESTLE Analysis provides a concise, professional assessment of political, economic, social, technological, legal, and environmental factors affecting the company. The preview shown here is the exact document you’ll receive after purchase—fully formatted and ready to use. No placeholders or surprises; download the finished file immediately after payment.

Your Competitive Advantage Starts with This Report
Unlock how political, economic, social, technological, legal and environmental forces are reshaping Oceaneering’s strategy and risk profile. Our concise PESTLE highlights near-term threats and growth levers across offshore and subsea markets. Ideal for investors and strategists seeking actionable context. Buy the full analysis to access detailed evidence, forecasts, and ready-to-use slides.
Political factors
Offshore energy policy shifts
Offshore licensing moratoriums or accelerated leasing rounds directly reshape subsea project pipelines and vessel utilization, with license cycles typically spanning 3–5 years and project procurement windows driving seasonal fleet demand.
Changes by BOEM/BSEE, North Sea regulators or Brazil’s ANP can swing demand for ROVs and umbilicals, making awarded acreage and round cadence primary demand signals.
Oceaneering must track multiyear regulatory calendars to align backlog and asset positioning, since long-lead manufacturing and vessel mobilization commonly require 12–24 months and benefit from policy stability.
Defense spending priorities
Defense budgets shape robotics, autonomy and asset‑integrity work beyond oil and gas; US defense spending reached about $858 billion in FY2024 and global military expenditure was $2.24 trillion in 2023 (SIPRI). Geopolitical tensions boost naval, undersea and inspection programs, increasing demand for advanced ROVs and AUVs. The shift to unmanned systems favors Oceaneering’s robotics portfolio, while long procurement cycles demand multi‑year capture planning and strict compliance.
Trade, tariffs, and sanctions
Export controls and sanctions (eg. US/EU measures restricting trade with Russia, Iran) directly limit equipment, spares and service access to certain basins and can block subsea deliveries. US Section 232 steel tariffs (25%) and duties on electronics raise COGS for umbilicals and hardware. Oceaneering requires resilient supplier networks and EAR/ITAR licensing capability; rapid rerouting of supply mitigates project delays and liquidated damages.
Local content and industrial policy
Host nations impose local content on fabrication, staffing and vessels, often mandating 30–60% domestic inputs in projects, which increases capex and extends fabrication timelines for Oceaneering; compliance can unlock bid eligibility and fiscal incentives and is material in Brazil, West Africa and the Middle East. Strategic partnerships and in-country bases improve political goodwill and documented win rates; misalignment risks fines or exclusion from tenders.
- Local content mandates: 30–60% typical
- Impact: higher capex, longer delivery
- Benefit: access to bids and tax incentives
- Mitigation: local partnerships, bases
- Risk: penalties or tender exclusion
Energy transition incentives
Energy transition incentives for offshore wind (UK 50 GW by 2030, US 30 GW by 2030), CCUS and decommissioning are shifting capital toward subsea low‑carbon work, enabling Oceaneering to repurpose ROVs, survey and integrity services for projects with multi-year funding streams. Policy carrots accelerate diversification and smooth revenues across cycles; tracking grant timelines optimizes load‑shop and fleet utilization.
- Offshore wind targets: UK 50 GW/2030, US 30 GW/2030
- Repurpose ROVs for CCUS and decommissioning surveys
- Grants create multi‑year contracts → revenue smoothing
- Monitor timelines to schedule fleets and shops
Offshore licensing 3-5 yrs; 12-24 mo mobilization; defense boosts robotics
Offshore licensing cycles (3–5 yrs) and BOEM/BSEE/ANP cadence drive ROV/umbilical demand; vessel mobilization lead times 12–24 months. US defence spend ~$858B FY2024, global military $2.24T (2023) lift robotics work. Local content 30–60% raises capex; UK 50 GW/2030, US 30 GW/2030 enable wind/CCUS diversification.
| Factor | Metric | Impact |
|---|---|---|
| Licensing | 3–5 yrs | Pipeline seasonality |
| Lead times | 12–24 mo | Asset positioning |
| Local content | 30–60% | Higher capex |
What is included in the product
Detailed Word Document
Explores how macro-environmental factors uniquely affect Oceaneering across Political, Economic, Social, Technological, Environmental, and Legal dimensions, with data-driven insights, forward-looking scenarios, and detailed sub-points to support executives, consultants, and investors in identifying risks, opportunities, and strategy-ready recommendations for reports or pitch decks.
Customizable Excel Spreadsheet
Clean, summarized Oceaneering PESTLE analysis, visually segmented by category for quick interpretation and easily editable so teams can add region- or business-specific notes for seamless sharing in presentations and planning sessions.
Economic factors
Hydrocarbon price cycles
Brent and gas price volatility—Brent averaged about $85/bbl in 2024—directly drives E&P capex, shifting ROV days, installations and integrity campaigns; high prices expand deepwater FIDs and backlog while lows prompt deferrals. Oceaneering reported ~ $1.9bn revenue in 2024 and its service diversification buffers but does not eliminate cyclicality. A disciplined contract mix and pricing help preserve margins through swings.
Interest rates and financing
Higher interest rates (US fed funds 5.25–5.50% in mid‑2025) raise vessel charter and equipment financing costs and can delay customer projects; refinancing becomes more expensive. Lower rates ease refinancing and stimulate energy and infrastructure capex. Oceaneering must balance fleet and manufacturing capex with ROIC targets, and strong cash conversion supports countercyclical investment.
Currency fluctuations
Oceaneering's multi-currency exposure (USD reporting with significant GBP, NOK, BRL and EUR cashflows) affects revenue recognition, local costs and translation on the balance sheet; natural hedges from local sourcing and local contracts reduce volatility while structured FX hedging programs address residual risk. Sudden devaluations can spike local wage and materials costs, and indexation or pricing clauses in contracts are used to protect profitability.
Supply chain and input costs
Rising costs for steel, polymers and semiconductors in 2024–25 tightened umbilical and robotics margins, while logistics bottlenecks and limited vessel availability pushed project schedules and increased penalty risk; dual-sourcing and targeted inventory planning preserved on-time delivery, and deeper supplier collaboration enabled design-to-cost tradeoffs without quality loss.
- Supply inputs: steel, polymers, electronics, semiconductors
- Logistics: vessel availability, schedule risk
- Mitigation: dual-sourcing, inventory planning
- Supplier strategy: design-to-cost with quality
Diversification and end-market mix
Oceaneering’s end-market diversification—defense, aerospace and entertainment—buffers offshore services volatility, helping offset oil downturns while FY2024 revenue hovered near $1.7B. Cross-sector robotics and automation lift asset utilization and spur higher-margin engineering work. A balanced portfolio supports steadier cash flow and valuation multiples; disciplined capex preserves core subsea capabilities without dilution.
- Defense/aerospace/entertainment: downside protection
- Robotics/automation: higher asset utilization
- Portfolio: stable cash flows, stronger multiples
- Capital allocation: protects subsea core
Offshore licensing 3-5 yrs; 12-24 mo mobilization; defense boosts robotics
Brent at ~$85/bbl in 2024 drives E&P capex and subsea activity; Oceaneering revenue ~$1.9bn in 2024 buffers but cyclicality remains. US rates 5.25–5.50% (mid‑2025) raise financing costs; multi‑currency exposure (GBP, NOK, BRL, EUR) and input inflation (steel, semiconductors) pressure margins.
| Metric | 2024/2025 |
|---|---|
| Revenue | $1.9bn (2024) |
| Brent | $85/bbl (2024) |
| Fed funds | 5.25–5.50% (mid‑2025) |
Full Version Awaits
Oceaneering PESTLE Analysis
The Oceaneering PESTLE Analysis provides a concise, professional assessment of political, economic, social, technological, legal, and environmental factors affecting the company. The preview shown here is the exact document you’ll receive after purchase—fully formatted and ready to use. No placeholders or surprises; download the finished file immediately after payment.
Description
Your Competitive Advantage Starts with This Report
Unlock how political, economic, social, technological, legal and environmental forces are reshaping Oceaneering’s strategy and risk profile. Our concise PESTLE highlights near-term threats and growth levers across offshore and subsea markets. Ideal for investors and strategists seeking actionable context. Buy the full analysis to access detailed evidence, forecasts, and ready-to-use slides.
Political factors
Offshore energy policy shifts
Offshore licensing moratoriums or accelerated leasing rounds directly reshape subsea project pipelines and vessel utilization, with license cycles typically spanning 3–5 years and project procurement windows driving seasonal fleet demand.
Changes by BOEM/BSEE, North Sea regulators or Brazil’s ANP can swing demand for ROVs and umbilicals, making awarded acreage and round cadence primary demand signals.
Oceaneering must track multiyear regulatory calendars to align backlog and asset positioning, since long-lead manufacturing and vessel mobilization commonly require 12–24 months and benefit from policy stability.
Defense spending priorities
Defense budgets shape robotics, autonomy and asset‑integrity work beyond oil and gas; US defense spending reached about $858 billion in FY2024 and global military expenditure was $2.24 trillion in 2023 (SIPRI). Geopolitical tensions boost naval, undersea and inspection programs, increasing demand for advanced ROVs and AUVs. The shift to unmanned systems favors Oceaneering’s robotics portfolio, while long procurement cycles demand multi‑year capture planning and strict compliance.
Trade, tariffs, and sanctions
Export controls and sanctions (eg. US/EU measures restricting trade with Russia, Iran) directly limit equipment, spares and service access to certain basins and can block subsea deliveries. US Section 232 steel tariffs (25%) and duties on electronics raise COGS for umbilicals and hardware. Oceaneering requires resilient supplier networks and EAR/ITAR licensing capability; rapid rerouting of supply mitigates project delays and liquidated damages.
Local content and industrial policy
Host nations impose local content on fabrication, staffing and vessels, often mandating 30–60% domestic inputs in projects, which increases capex and extends fabrication timelines for Oceaneering; compliance can unlock bid eligibility and fiscal incentives and is material in Brazil, West Africa and the Middle East. Strategic partnerships and in-country bases improve political goodwill and documented win rates; misalignment risks fines or exclusion from tenders.
- Local content mandates: 30–60% typical
- Impact: higher capex, longer delivery
- Benefit: access to bids and tax incentives
- Mitigation: local partnerships, bases
- Risk: penalties or tender exclusion
Energy transition incentives
Energy transition incentives for offshore wind (UK 50 GW by 2030, US 30 GW by 2030), CCUS and decommissioning are shifting capital toward subsea low‑carbon work, enabling Oceaneering to repurpose ROVs, survey and integrity services for projects with multi-year funding streams. Policy carrots accelerate diversification and smooth revenues across cycles; tracking grant timelines optimizes load‑shop and fleet utilization.
- Offshore wind targets: UK 50 GW/2030, US 30 GW/2030
- Repurpose ROVs for CCUS and decommissioning surveys
- Grants create multi‑year contracts → revenue smoothing
- Monitor timelines to schedule fleets and shops
Offshore licensing 3-5 yrs; 12-24 mo mobilization; defense boosts robotics
Offshore licensing cycles (3–5 yrs) and BOEM/BSEE/ANP cadence drive ROV/umbilical demand; vessel mobilization lead times 12–24 months. US defence spend ~$858B FY2024, global military $2.24T (2023) lift robotics work. Local content 30–60% raises capex; UK 50 GW/2030, US 30 GW/2030 enable wind/CCUS diversification.
| Factor | Metric | Impact |
|---|---|---|
| Licensing | 3–5 yrs | Pipeline seasonality |
| Lead times | 12–24 mo | Asset positioning |
| Local content | 30–60% | Higher capex |
What is included in the product
Detailed Word Document
Explores how macro-environmental factors uniquely affect Oceaneering across Political, Economic, Social, Technological, Environmental, and Legal dimensions, with data-driven insights, forward-looking scenarios, and detailed sub-points to support executives, consultants, and investors in identifying risks, opportunities, and strategy-ready recommendations for reports or pitch decks.
Customizable Excel Spreadsheet
Clean, summarized Oceaneering PESTLE analysis, visually segmented by category for quick interpretation and easily editable so teams can add region- or business-specific notes for seamless sharing in presentations and planning sessions.
Economic factors
Hydrocarbon price cycles
Brent and gas price volatility—Brent averaged about $85/bbl in 2024—directly drives E&P capex, shifting ROV days, installations and integrity campaigns; high prices expand deepwater FIDs and backlog while lows prompt deferrals. Oceaneering reported ~ $1.9bn revenue in 2024 and its service diversification buffers but does not eliminate cyclicality. A disciplined contract mix and pricing help preserve margins through swings.
Interest rates and financing
Higher interest rates (US fed funds 5.25–5.50% in mid‑2025) raise vessel charter and equipment financing costs and can delay customer projects; refinancing becomes more expensive. Lower rates ease refinancing and stimulate energy and infrastructure capex. Oceaneering must balance fleet and manufacturing capex with ROIC targets, and strong cash conversion supports countercyclical investment.
Currency fluctuations
Oceaneering's multi-currency exposure (USD reporting with significant GBP, NOK, BRL and EUR cashflows) affects revenue recognition, local costs and translation on the balance sheet; natural hedges from local sourcing and local contracts reduce volatility while structured FX hedging programs address residual risk. Sudden devaluations can spike local wage and materials costs, and indexation or pricing clauses in contracts are used to protect profitability.
Supply chain and input costs
Rising costs for steel, polymers and semiconductors in 2024–25 tightened umbilical and robotics margins, while logistics bottlenecks and limited vessel availability pushed project schedules and increased penalty risk; dual-sourcing and targeted inventory planning preserved on-time delivery, and deeper supplier collaboration enabled design-to-cost tradeoffs without quality loss.
- Supply inputs: steel, polymers, electronics, semiconductors
- Logistics: vessel availability, schedule risk
- Mitigation: dual-sourcing, inventory planning
- Supplier strategy: design-to-cost with quality
Diversification and end-market mix
Oceaneering’s end-market diversification—defense, aerospace and entertainment—buffers offshore services volatility, helping offset oil downturns while FY2024 revenue hovered near $1.7B. Cross-sector robotics and automation lift asset utilization and spur higher-margin engineering work. A balanced portfolio supports steadier cash flow and valuation multiples; disciplined capex preserves core subsea capabilities without dilution.
- Defense/aerospace/entertainment: downside protection
- Robotics/automation: higher asset utilization
- Portfolio: stable cash flows, stronger multiples
- Capital allocation: protects subsea core
Offshore licensing 3-5 yrs; 12-24 mo mobilization; defense boosts robotics
Brent at ~$85/bbl in 2024 drives E&P capex and subsea activity; Oceaneering revenue ~$1.9bn in 2024 buffers but cyclicality remains. US rates 5.25–5.50% (mid‑2025) raise financing costs; multi‑currency exposure (GBP, NOK, BRL, EUR) and input inflation (steel, semiconductors) pressure margins.
| Metric | 2024/2025 |
|---|---|
| Revenue | $1.9bn (2024) |
| Brent | $85/bbl (2024) |
| Fed funds | 5.25–5.50% (mid‑2025) |
Full Version Awaits
Oceaneering PESTLE Analysis
The Oceaneering PESTLE Analysis provides a concise, professional assessment of political, economic, social, technological, legal, and environmental factors affecting the company. The preview shown here is the exact document you’ll receive after purchase—fully formatted and ready to use. No placeholders or surprises; download the finished file immediately after payment.











