Oceaneering SWOT Analysis

Dive Deeper Into the Company’s Strategic Blueprint
Explore our Oceaneering SWOT Analysis for a concise view of strengths, vulnerabilities, market opportunities, and competitive threats. This snapshot highlights technical expertise, offshore exposure, and regulatory risks to inform quick decisions. Want the full, research-backed report with editable Word and Excel deliverables? Purchase the complete SWOT to plan, pitch, and invest with confidence.
Strengths

Deepwater robotics leadership
Oceaneering's deepwater robotics leadership rests on a modern fleet of over 200 ROVs and more than 60 years of offshore experience, supporting complex deepwater operations. High utilization and mission-critical uptime create material switching costs for operators. Decades of know-how enable faster intervention cycles and reliable availability, letting brand credibility support premium pricing in the toughest environments.
Diversified end markets
Oceaneering’s exposure beyond oil and gas into defense, aerospace and entertainment smooths revenue swings by linking to less cyclical end markets. Cross-industry robotics and automation work—deployed across ROVs, space actuators and live-event systems—bolster revenue resilience. Large, long-cycle government programs benefit from a US defense budget of about 858 billion in FY2024, widening funded opportunities and customer pipelines.

Engineering and IP depth
Oceaneering's proprietary subsea hardware, umbilicals and tooling form a differentiated product suite supported by systems-integration expertise that has reduced project incidents and improved HSE metrics; the company reported roughly $1.6B revenue in 2023 while ROV and tooling contracts underpin a multi-hundred-million-dollar backlog, and ongoing investment in autonomy and remote operations preserves technical barriers and margin resilience.

Global footprint and assets
Oceaneering leverages a global footprint of bases, vessels and logistics to mobilize quickly in key basins, improving bid competitiveness and execution reliability. Local presence aids regulatory compliance and access to skilled talent, while high asset density delivers operating leverage during upcycles.
- Worldwide bases/vessels enable rapid mobilization
- Scale improves bidding and execution
- Local presence supports compliance and talent
- Asset density drives leverage in upcycles
Recurring services and integrity
Inspection, maintenance, and asset integrity provide Oceaneering predictable, repeatable revenue streams and reduce reliance on one-off projects.
Data-rich services and digital monitoring increase customer stickiness across asset lifecycles and enable cross-sell of hardware and services.
Long-term integrity frameworks smooth cash flows and enhance margin visibility versus lump-sum contracts.
- Recurring services
- Data-driven stickiness
- Stable cash flows
- Cross-sell via digital monitoring
Deepwater robotics: 200+ ROVs, 60+ yrs, $1.6B
Oceaneering leads deepwater robotics with 200+ ROVs and 60+ years of offshore expertise, supporting premium pricing and high uptime. Diversified end markets (defense, aerospace, entertainment) and a ~multi-hundred‑million backlog underpin revenue resilience; 2023 revenue ~1.6B. Global bases and data-driven services create recurring, cross‑sellable cash flows.
| Metric | Value |
|---|---|
| ROV fleet | 200+ |
| Years offshore | 60+ |
| 2023 revenue | $1.6B |
| FY2024 US defense | $858B |
What is included in the product
 Detailed Word Document
Delivers a strategic overview of Oceaneering’s internal and external business factors, outlining strengths, weaknesses, opportunities and threats to assess competitive position and guide strategic decisions.

 Customizable Excel Spreadsheet
Provides a concise, visual SWOT matrix tailored to Oceaneering for fast strategy alignment and stakeholder updates, enabling quick identification of tactical priorities.
Weaknesses

Energy cycle dependency
Oceaneering’s revenue remains closely tied to offshore capex, leaving earnings sensitive to oil-price swings; Brent averaged about $86/bbl in 2024, and price dips have historically led to rapid project deferrals. Project postponements quickly hit utilization and margins, with day-rate-dependent segments showing pronounced volatility. Planning complexity rises as customer budgets fluctuate, and diversification into non-oil markets helps but does not remove exposure.
Capital intensity
Oceaneering (NYSE: OII) is capital intensive—ROV fleets, support vessels and manufacturing assets require ongoing capex and maintenance, often totaling hundreds of millions annually. Working capital can expand sharply during growth phases and large project ramps. Return on invested capital often lags in industry downcycles. Balance-sheet flexibility therefore must be actively managed to weather volatility.

Project execution risk
Long‑lead subsea hardware and umbilicals expose Oceaneering to schedule and cost overrun risk, particularly given a backlog exceeding $1 billion and component lead times often surpassing 12 months. Supply‑chain volatility has compressed margins on fixed‑price projects, contributing to margin variability in recent quarters. Cross‑border integration adds coordination complexity across engineering, fabrication and logistics. Warranty claims and rework have periodically pressured profitability and cash flow.

Customer concentration
Dependence on a handful of major oil and gas operators concentrates bargaining power, leaving Oceaneering exposed when those operators prioritize cost reductions.
Pricing pressure tends to intensify during operator cost-down cycles, compressing service margins and freighting returns toward contractors.
Contract renewals carry utilization risk if key operator contracts are lost, and negotiation leverage can vary significantly by basin and asset class.
- Concentrated customer mix increases revenue vulnerability
- Operator cost-downs drive pricing and margin pressure
- Lost renewals can create utilization shortfalls
- Basin/asset-specific leverage affects contract terms
ESG and perception constraints
Association with fossil projects limits access to sustainability-focused capital as global sustainable assets reached 41.1 trillion USD in 2023 (GSIA), narrowing investor pools; rising disclosure and compliance (eg EU CSRD phasing 2024–25) increase reporting costs; recruiting sustainability-first talent is tougher; management must clearly articulate credible transition alignment and timelines.
- Fossil association limits ESG investors
- Higher compliance/reporting costs (CSRD/ESG rules)
- Talent attraction challenges
- Need clear transition roadmap
Offshore capex risk: Brent $86/bbl, backlog >$1bn, lead >12 months
Revenue tied to offshore capex; Brent averaged about $86/bbl in 2024, making earnings oil‑price sensitive. Capital intensity (capex/maintenance in the hundreds of millions) and >$1bn backlog with component lead times >12 months raise schedule and cash risks. Concentrated major-operator mix and fossil association constrain pricing, renewals and ESG capital access.
| Metric | Value |
|---|---|
| Brent (2024) | $86/bbl |
| Backlog | > $1bn |
| Lead times | > 12 months |
| Sustainable assets (2023, GSIA) | $41.1 trillion |
Preview the Actual Deliverable
Oceaneering SWOT Analysis
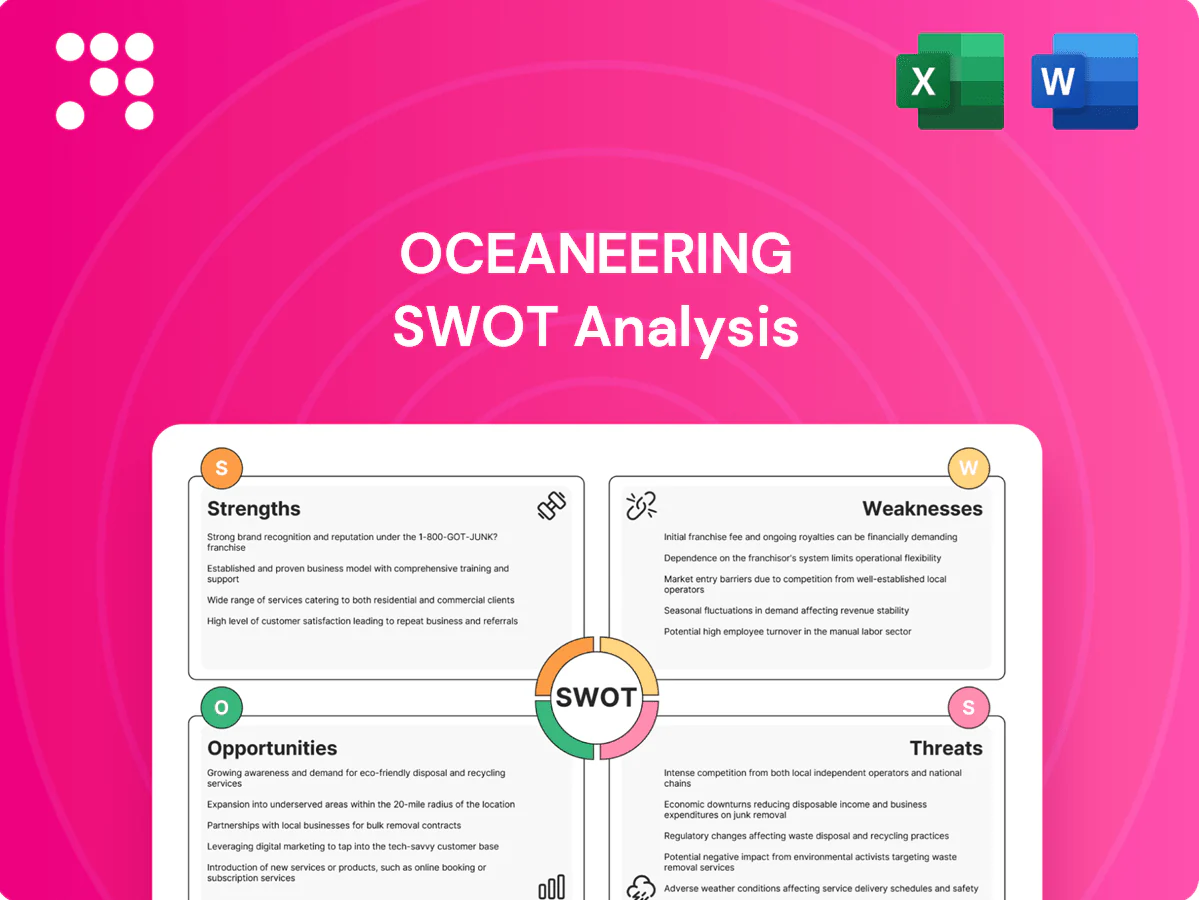
This is the actual SWOT analysis document for Oceaneering you’ll receive upon purchase—no surprises, just professional quality. The preview below is taken directly from the full report and reflects the complete structure and findings. Purchase unlocks the editable, detailed version.

Dive Deeper Into the Company’s Strategic Blueprint
Explore our Oceaneering SWOT Analysis for a concise view of strengths, vulnerabilities, market opportunities, and competitive threats. This snapshot highlights technical expertise, offshore exposure, and regulatory risks to inform quick decisions. Want the full, research-backed report with editable Word and Excel deliverables? Purchase the complete SWOT to plan, pitch, and invest with confidence.
Strengths
Deepwater robotics leadership
Oceaneering's deepwater robotics leadership rests on a modern fleet of over 200 ROVs and more than 60 years of offshore experience, supporting complex deepwater operations. High utilization and mission-critical uptime create material switching costs for operators. Decades of know-how enable faster intervention cycles and reliable availability, letting brand credibility support premium pricing in the toughest environments.
Diversified end markets
Oceaneering’s exposure beyond oil and gas into defense, aerospace and entertainment smooths revenue swings by linking to less cyclical end markets. Cross-industry robotics and automation work—deployed across ROVs, space actuators and live-event systems—bolster revenue resilience. Large, long-cycle government programs benefit from a US defense budget of about 858 billion in FY2024, widening funded opportunities and customer pipelines.
Engineering and IP depth
Oceaneering's proprietary subsea hardware, umbilicals and tooling form a differentiated product suite supported by systems-integration expertise that has reduced project incidents and improved HSE metrics; the company reported roughly $1.6B revenue in 2023 while ROV and tooling contracts underpin a multi-hundred-million-dollar backlog, and ongoing investment in autonomy and remote operations preserves technical barriers and margin resilience.
Global footprint and assets
Oceaneering leverages a global footprint of bases, vessels and logistics to mobilize quickly in key basins, improving bid competitiveness and execution reliability. Local presence aids regulatory compliance and access to skilled talent, while high asset density delivers operating leverage during upcycles.
- Worldwide bases/vessels enable rapid mobilization
- Scale improves bidding and execution
- Local presence supports compliance and talent
- Asset density drives leverage in upcycles
Recurring services and integrity
Inspection, maintenance, and asset integrity provide Oceaneering predictable, repeatable revenue streams and reduce reliance on one-off projects.
Data-rich services and digital monitoring increase customer stickiness across asset lifecycles and enable cross-sell of hardware and services.
Long-term integrity frameworks smooth cash flows and enhance margin visibility versus lump-sum contracts.
- Recurring services
- Data-driven stickiness
- Stable cash flows
- Cross-sell via digital monitoring
Deepwater robotics: 200+ ROVs, 60+ yrs, $1.6B
Oceaneering leads deepwater robotics with 200+ ROVs and 60+ years of offshore expertise, supporting premium pricing and high uptime. Diversified end markets (defense, aerospace, entertainment) and a ~multi-hundred‑million backlog underpin revenue resilience; 2023 revenue ~1.6B. Global bases and data-driven services create recurring, cross‑sellable cash flows.
| Metric | Value |
|---|---|
| ROV fleet | 200+ |
| Years offshore | 60+ |
| 2023 revenue | $1.6B |
| FY2024 US defense | $858B |
What is included in the product
Detailed Word Document
Delivers a strategic overview of Oceaneering’s internal and external business factors, outlining strengths, weaknesses, opportunities and threats to assess competitive position and guide strategic decisions.
Customizable Excel Spreadsheet
Provides a concise, visual SWOT matrix tailored to Oceaneering for fast strategy alignment and stakeholder updates, enabling quick identification of tactical priorities.
Weaknesses
Energy cycle dependency
Oceaneering’s revenue remains closely tied to offshore capex, leaving earnings sensitive to oil-price swings; Brent averaged about $86/bbl in 2024, and price dips have historically led to rapid project deferrals. Project postponements quickly hit utilization and margins, with day-rate-dependent segments showing pronounced volatility. Planning complexity rises as customer budgets fluctuate, and diversification into non-oil markets helps but does not remove exposure.
Capital intensity
Oceaneering (NYSE: OII) is capital intensive—ROV fleets, support vessels and manufacturing assets require ongoing capex and maintenance, often totaling hundreds of millions annually. Working capital can expand sharply during growth phases and large project ramps. Return on invested capital often lags in industry downcycles. Balance-sheet flexibility therefore must be actively managed to weather volatility.
Project execution risk
Long‑lead subsea hardware and umbilicals expose Oceaneering to schedule and cost overrun risk, particularly given a backlog exceeding $1 billion and component lead times often surpassing 12 months. Supply‑chain volatility has compressed margins on fixed‑price projects, contributing to margin variability in recent quarters. Cross‑border integration adds coordination complexity across engineering, fabrication and logistics. Warranty claims and rework have periodically pressured profitability and cash flow.
Customer concentration
Dependence on a handful of major oil and gas operators concentrates bargaining power, leaving Oceaneering exposed when those operators prioritize cost reductions.
Pricing pressure tends to intensify during operator cost-down cycles, compressing service margins and freighting returns toward contractors.
Contract renewals carry utilization risk if key operator contracts are lost, and negotiation leverage can vary significantly by basin and asset class.
- Concentrated customer mix increases revenue vulnerability
- Operator cost-downs drive pricing and margin pressure
- Lost renewals can create utilization shortfalls
- Basin/asset-specific leverage affects contract terms
ESG and perception constraints
Association with fossil projects limits access to sustainability-focused capital as global sustainable assets reached 41.1 trillion USD in 2023 (GSIA), narrowing investor pools; rising disclosure and compliance (eg EU CSRD phasing 2024–25) increase reporting costs; recruiting sustainability-first talent is tougher; management must clearly articulate credible transition alignment and timelines.
- Fossil association limits ESG investors
- Higher compliance/reporting costs (CSRD/ESG rules)
- Talent attraction challenges
- Need clear transition roadmap
Offshore capex risk: Brent $86/bbl, backlog >$1bn, lead >12 months
Revenue tied to offshore capex; Brent averaged about $86/bbl in 2024, making earnings oil‑price sensitive. Capital intensity (capex/maintenance in the hundreds of millions) and >$1bn backlog with component lead times >12 months raise schedule and cash risks. Concentrated major-operator mix and fossil association constrain pricing, renewals and ESG capital access.
| Metric | Value |
|---|---|
| Brent (2024) | $86/bbl |
| Backlog | > $1bn |
| Lead times | > 12 months |
| Sustainable assets (2023, GSIA) | $41.1 trillion |
Preview the Actual Deliverable
Oceaneering SWOT Analysis
This is the actual SWOT analysis document for Oceaneering you’ll receive upon purchase—no surprises, just professional quality. The preview below is taken directly from the full report and reflects the complete structure and findings. Purchase unlocks the editable, detailed version.
Description
Dive Deeper Into the Company’s Strategic Blueprint
Explore our Oceaneering SWOT Analysis for a concise view of strengths, vulnerabilities, market opportunities, and competitive threats. This snapshot highlights technical expertise, offshore exposure, and regulatory risks to inform quick decisions. Want the full, research-backed report with editable Word and Excel deliverables? Purchase the complete SWOT to plan, pitch, and invest with confidence.
Strengths
Deepwater robotics leadership
Oceaneering's deepwater robotics leadership rests on a modern fleet of over 200 ROVs and more than 60 years of offshore experience, supporting complex deepwater operations. High utilization and mission-critical uptime create material switching costs for operators. Decades of know-how enable faster intervention cycles and reliable availability, letting brand credibility support premium pricing in the toughest environments.
Diversified end markets
Oceaneering’s exposure beyond oil and gas into defense, aerospace and entertainment smooths revenue swings by linking to less cyclical end markets. Cross-industry robotics and automation work—deployed across ROVs, space actuators and live-event systems—bolster revenue resilience. Large, long-cycle government programs benefit from a US defense budget of about 858 billion in FY2024, widening funded opportunities and customer pipelines.
Engineering and IP depth
Oceaneering's proprietary subsea hardware, umbilicals and tooling form a differentiated product suite supported by systems-integration expertise that has reduced project incidents and improved HSE metrics; the company reported roughly $1.6B revenue in 2023 while ROV and tooling contracts underpin a multi-hundred-million-dollar backlog, and ongoing investment in autonomy and remote operations preserves technical barriers and margin resilience.
Global footprint and assets
Oceaneering leverages a global footprint of bases, vessels and logistics to mobilize quickly in key basins, improving bid competitiveness and execution reliability. Local presence aids regulatory compliance and access to skilled talent, while high asset density delivers operating leverage during upcycles.
- Worldwide bases/vessels enable rapid mobilization
- Scale improves bidding and execution
- Local presence supports compliance and talent
- Asset density drives leverage in upcycles
Recurring services and integrity
Inspection, maintenance, and asset integrity provide Oceaneering predictable, repeatable revenue streams and reduce reliance on one-off projects.
Data-rich services and digital monitoring increase customer stickiness across asset lifecycles and enable cross-sell of hardware and services.
Long-term integrity frameworks smooth cash flows and enhance margin visibility versus lump-sum contracts.
- Recurring services
- Data-driven stickiness
- Stable cash flows
- Cross-sell via digital monitoring
Deepwater robotics: 200+ ROVs, 60+ yrs, $1.6B
Oceaneering leads deepwater robotics with 200+ ROVs and 60+ years of offshore expertise, supporting premium pricing and high uptime. Diversified end markets (defense, aerospace, entertainment) and a ~multi-hundred‑million backlog underpin revenue resilience; 2023 revenue ~1.6B. Global bases and data-driven services create recurring, cross‑sellable cash flows.
| Metric | Value |
|---|---|
| ROV fleet | 200+ |
| Years offshore | 60+ |
| 2023 revenue | $1.6B |
| FY2024 US defense | $858B |
What is included in the product
Detailed Word Document
Delivers a strategic overview of Oceaneering’s internal and external business factors, outlining strengths, weaknesses, opportunities and threats to assess competitive position and guide strategic decisions.
Customizable Excel Spreadsheet
Provides a concise, visual SWOT matrix tailored to Oceaneering for fast strategy alignment and stakeholder updates, enabling quick identification of tactical priorities.
Weaknesses
Energy cycle dependency
Oceaneering’s revenue remains closely tied to offshore capex, leaving earnings sensitive to oil-price swings; Brent averaged about $86/bbl in 2024, and price dips have historically led to rapid project deferrals. Project postponements quickly hit utilization and margins, with day-rate-dependent segments showing pronounced volatility. Planning complexity rises as customer budgets fluctuate, and diversification into non-oil markets helps but does not remove exposure.
Capital intensity
Oceaneering (NYSE: OII) is capital intensive—ROV fleets, support vessels and manufacturing assets require ongoing capex and maintenance, often totaling hundreds of millions annually. Working capital can expand sharply during growth phases and large project ramps. Return on invested capital often lags in industry downcycles. Balance-sheet flexibility therefore must be actively managed to weather volatility.
Project execution risk
Long‑lead subsea hardware and umbilicals expose Oceaneering to schedule and cost overrun risk, particularly given a backlog exceeding $1 billion and component lead times often surpassing 12 months. Supply‑chain volatility has compressed margins on fixed‑price projects, contributing to margin variability in recent quarters. Cross‑border integration adds coordination complexity across engineering, fabrication and logistics. Warranty claims and rework have periodically pressured profitability and cash flow.
Customer concentration
Dependence on a handful of major oil and gas operators concentrates bargaining power, leaving Oceaneering exposed when those operators prioritize cost reductions.
Pricing pressure tends to intensify during operator cost-down cycles, compressing service margins and freighting returns toward contractors.
Contract renewals carry utilization risk if key operator contracts are lost, and negotiation leverage can vary significantly by basin and asset class.
- Concentrated customer mix increases revenue vulnerability
- Operator cost-downs drive pricing and margin pressure
- Lost renewals can create utilization shortfalls
- Basin/asset-specific leverage affects contract terms
ESG and perception constraints
Association with fossil projects limits access to sustainability-focused capital as global sustainable assets reached 41.1 trillion USD in 2023 (GSIA), narrowing investor pools; rising disclosure and compliance (eg EU CSRD phasing 2024–25) increase reporting costs; recruiting sustainability-first talent is tougher; management must clearly articulate credible transition alignment and timelines.
- Fossil association limits ESG investors
- Higher compliance/reporting costs (CSRD/ESG rules)
- Talent attraction challenges
- Need clear transition roadmap
Offshore capex risk: Brent $86/bbl, backlog >$1bn, lead >12 months
Revenue tied to offshore capex; Brent averaged about $86/bbl in 2024, making earnings oil‑price sensitive. Capital intensity (capex/maintenance in the hundreds of millions) and >$1bn backlog with component lead times >12 months raise schedule and cash risks. Concentrated major-operator mix and fossil association constrain pricing, renewals and ESG capital access.
| Metric | Value |
|---|---|
| Brent (2024) | $86/bbl |
| Backlog | > $1bn |
| Lead times | > 12 months |
| Sustainable assets (2023, GSIA) | $41.1 trillion |
Preview the Actual Deliverable
Oceaneering SWOT Analysis
This is the actual SWOT analysis document for Oceaneering you’ll receive upon purchase—no surprises, just professional quality. The preview below is taken directly from the full report and reflects the complete structure and findings. Purchase unlocks the editable, detailed version.











