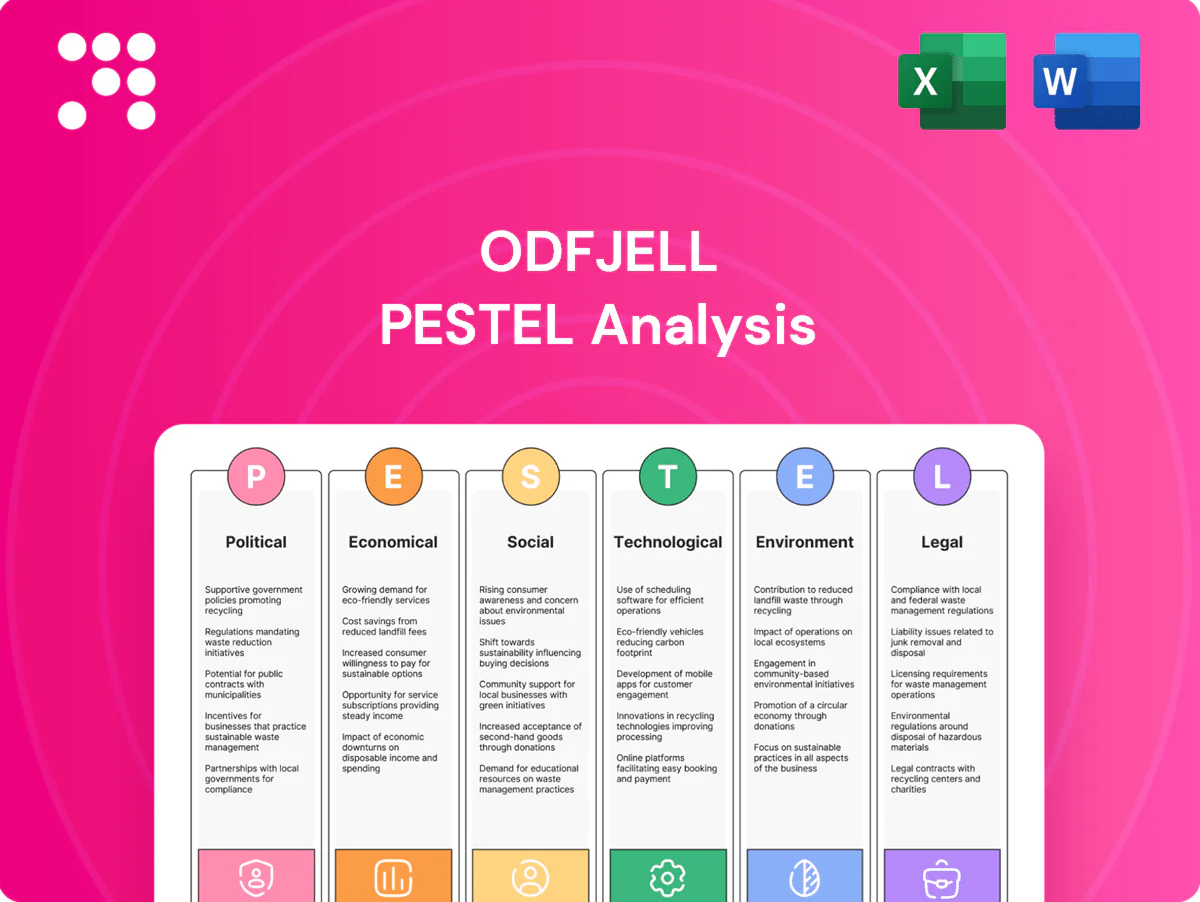
Odfjell PESTLE Analysis

Your Shortcut to Market Insight Starts Here
Explore political, economic, social, technological, legal and environmental forces shaping Odfjell's tanker and chemical logistics business. Our concise PESTLE highlights regulatory risks, market drivers and ESG pressures to inform strategy and investment decisions. Buy the full analysis for detailed, actionable insights and ready-to-use deliverables.
Political factors

Geopolitical trade routes
Shifts in tensions in the Middle East, Black Sea or South China Sea can reroute chemical flows, forcing longer voyages and higher bunker and insurance costs. Corridor closures or heightened naval risk materially extend voyage times and premiums. Odfjell, with an ~80-strong chemical tanker fleet, must dynamically reposition tonnage to retain coverage and schedules. Political stability near chokepoints is a core operational exposure.
Sanctions exposure
Sanctions on producers or buyers reshape cargo eligibility and lanes, forcing Odfjell to reroute shipments and avoid restricted ports; industry-wide shifts since 2022 cut traditional Russian crude flows by roughly 2–3 million barrels per day, altering tanker demand patterns. Compliance limits counterparties and can idle specialized stainless-steel chemical tankers in a fleet of about 80 vessels. Rapid rule changes demand enhanced screening discipline and KYC, raising compliance cost and operational friction. A diversified customer base across regions reduces concentration risk and exposure to single-country sanctions.

Port state policies
Local content rules and cabotage can constrain coastal distribution, increasing operating costs for Odfjell's ~70 chemical tankers and pushing more cargo to deep-sea legs. Port access, pilotage and berth prioritization are politically influenced, with berth delays routinely adding days to schedules and raising voyage costs. Terminal permits hinge on municipal agendas and can take months, so strong stakeholder relations are key to securing operating continuity.

Trade agreements and tariffs
Tariffs on chemicals (commonly 4–6% in key markets) shift origin–destination patterns as shippers reroute to avoid duties, changing Odfjell’s ballast and laden legs and voyage economics. New trade deals since 2023 opened niche, higher-margin lanes for specialized cargoes, while heightened customs friction increasingly adds port time and handling cost. Odfjell benefits from stable, liberal trade regimes that reduce schedule risk and demurrage exposure.
- Tariff impact: 4–6% typical
- Customs delay: raises port time/cost
- Trade deals: open profitable specialized lanes
Subsidies and green incentives
Policy support such as the EU’s inclusion of maritime emissions in the ETS from 2024 and national grants can materially lower Odfjell’s fuel-transition capex, helping its ~80-vessel fleet de-risk alternative fuels and pilots.
- Grants/tax credits accelerate pilots
- Uneven national incentives complicate fleet choices
- Strategic alignment yields first-mover gains
Geopolitics reroute chemicals; ~80-ship fleet faces longer voyages
Geopolitical hotspots reroute chemical flows, raising bunker/insurance and voyage times; Odfjell’s ~80-vessel chemical fleet must frequently reposition tonnage. Sanctions since 2022 removed ~2–3 mbpd of crude flows, altering demand and raising compliance/KYC costs. EU ETS from 2024 plus grants lower fuel-transition capex, though incentives are uneven.
| Metric | Value | Operational impact |
|---|---|---|
| Fleet | ~80 vessels | Repositioning needs |
| Sanctions shift | 2–3 mbpd | Rerouted lanes, higher compliance |
| Tariffs | 4–6% | Alters cargo economics |
| EU ETS | Included 2024 | Reduces transition capex |
What is included in the product
 Detailed Word Document
Explores how external macro-environmental factors uniquely affect Odfjell across Political, Economic, Social, Technological, Environmental and Legal dimensions, with data-backed trends and forward-looking insights tailored to shipping and tank-storage operations; designed for executives, investors and consultants and ready for business plans and scenario planning.

 Customizable Excel Spreadsheet
A concise, PESTLE‑segmented summary of external risks and opportunities for Odfjell that relieves research friction by being presentation‑ready, easily shared across teams, and annotated for regional or business‑line context.
Economic factors

Chemical demand cycle
Downstream industrial output, especially in Asia (about 60% of global chemical production), drives volumes in acids and intermediates, linking Odfjell cargo demand to regional manufacturing cycles. Inventory swings at producers have tightened spot cargo availability intermittently in 2023–24. Regional growth differentials shift trade balances between Asia, Europe and the US. Odfjell’s mix of contract and spot business cushions cyclical volatility.
Freight rate volatility
Freight rate volatility for Odfjell is driven by the balance between supply of coated/SS chemical tankers and demand, with the company operating roughly 70 vessels in 2024 so TCEs swing materially; yard deliveries and increased scrapping in 2023–24 shifted effective utilization quickly, tightening markets. Niche parceling and stainless-steel capability sustain premiums, and tight markets in 2024–25 amplified earnings leverage.

Fuel price dynamics
Bunker costs materially shape Odfjell voyage economics: global average VLSFO traded near $600/mt in 2024 while MGO averaged about $750/mt, squeezing margins on time-charter and spot routes.
The spread between VLSFO, MGO and LNG (LNG bunkers equivalent ~ $9–12/MMBtu in 2024–2025) drives fuel-choice and retrofit decisions for dual-fuel vessels.
Hedging programs and slow steaming remain core tactics to manage price volatility; Odfjell reported fuel hedges covering a material portion of 2024 consumption.
Terminal integration and ownership help smooth bunker procurement costs and gross margins by securing supply and blending flexibility.

Currency fluctuations
Odfjell’s USD-denominated voyage and storage revenues meet costs in NOK, EUR and various emerging market currencies, causing reported earnings to swing with FX moves. Natural hedges from overseas assets and targeted derivatives programs (FX forwards/options) are used to damp volatility. Contractual pricing clauses allow partial pass-through of currency and fuel cost shifts, limiting immediate P&L impact.
- USD revenue vs multi-currency costs
- NOK/EUR/emerging FX drive volatility
- Natural hedges + derivatives reduce swings
- Pricing clauses pass through part of FX/fuel risk
Interest rates and capex
Higher interest rates—with the US Fed funds peaking at 5.25–5.50% in 2023–24—raise Odfjell’s financing costs for fleet renewals and terminals, forcing higher hurdle rates for long‑lived assets and stricter capex discipline.
Lease versus debt choices shape cash‑flow flexibility and covenant risk; maintaining counter‑cyclical ordering (industry chemical tanker orderbook ~9–10% of fleet in 2024, per Clarksons) can lock in long‑term value.
- Higher policy rates: Fed peak 5.25–5.50% (2023–24)
- Orderbook: chemical tanker ~9–10% of fleet (2024, Clarksons)
- Implication: stricter hurdle rates, prefer flexible lease structures
- Strategy: counter‑cyclical ordering to capture value
Geopolitics reroute chemicals; ~80-ship fleet faces longer voyages
Odfjell demand tracks Asian chemical output (~60% global) and inventory swings tightened spot cargoes in 2023–24; fleet ~70 vessels (2024) buffers cycles. Freight TCEs rose in 2024–25 as orderbook ~9–10% (Clarksons) tightened supply; stainless-steel niche keeps premiums. Bunker averages in 2024: VLSFO ~$600/mt, MGO ~$750/mt, LNG ~$9–12/MMBtu; Fed funds peaked 5.25–5.50% (2023–24).
| Metric | 2024–25 |
|---|---|
| Fleet | ~70 vessels |
| Asian chem output | ~60% global |
| Orderbook | 9–10% (Clarksons) |
| Bunker | VLSFO $600/mt; MGO $750/mt |
| Fed funds | 5.25–5.50% |
What You See Is What You Get
Odfjell PESTLE Analysis
The Odfjell PESTLE Analysis preview shown here is the exact document you’ll receive after purchase—fully formatted and ready to use. It contains the complete political, economic, social, technological, legal, and environmental assessment for Odfjell as displayed. What you see is the final, professionally structured file you’ll download immediately after checkout.

Your Shortcut to Market Insight Starts Here
Explore political, economic, social, technological, legal and environmental forces shaping Odfjell's tanker and chemical logistics business. Our concise PESTLE highlights regulatory risks, market drivers and ESG pressures to inform strategy and investment decisions. Buy the full analysis for detailed, actionable insights and ready-to-use deliverables.
Political factors
Geopolitical trade routes
Shifts in tensions in the Middle East, Black Sea or South China Sea can reroute chemical flows, forcing longer voyages and higher bunker and insurance costs. Corridor closures or heightened naval risk materially extend voyage times and premiums. Odfjell, with an ~80-strong chemical tanker fleet, must dynamically reposition tonnage to retain coverage and schedules. Political stability near chokepoints is a core operational exposure.
Sanctions exposure
Sanctions on producers or buyers reshape cargo eligibility and lanes, forcing Odfjell to reroute shipments and avoid restricted ports; industry-wide shifts since 2022 cut traditional Russian crude flows by roughly 2–3 million barrels per day, altering tanker demand patterns. Compliance limits counterparties and can idle specialized stainless-steel chemical tankers in a fleet of about 80 vessels. Rapid rule changes demand enhanced screening discipline and KYC, raising compliance cost and operational friction. A diversified customer base across regions reduces concentration risk and exposure to single-country sanctions.
Port state policies
Local content rules and cabotage can constrain coastal distribution, increasing operating costs for Odfjell's ~70 chemical tankers and pushing more cargo to deep-sea legs. Port access, pilotage and berth prioritization are politically influenced, with berth delays routinely adding days to schedules and raising voyage costs. Terminal permits hinge on municipal agendas and can take months, so strong stakeholder relations are key to securing operating continuity.
Trade agreements and tariffs
Tariffs on chemicals (commonly 4–6% in key markets) shift origin–destination patterns as shippers reroute to avoid duties, changing Odfjell’s ballast and laden legs and voyage economics. New trade deals since 2023 opened niche, higher-margin lanes for specialized cargoes, while heightened customs friction increasingly adds port time and handling cost. Odfjell benefits from stable, liberal trade regimes that reduce schedule risk and demurrage exposure.
- Tariff impact: 4–6% typical
- Customs delay: raises port time/cost
- Trade deals: open profitable specialized lanes
Subsidies and green incentives
Policy support such as the EU’s inclusion of maritime emissions in the ETS from 2024 and national grants can materially lower Odfjell’s fuel-transition capex, helping its ~80-vessel fleet de-risk alternative fuels and pilots.
- Grants/tax credits accelerate pilots
- Uneven national incentives complicate fleet choices
- Strategic alignment yields first-mover gains
Geopolitics reroute chemicals; ~80-ship fleet faces longer voyages
Geopolitical hotspots reroute chemical flows, raising bunker/insurance and voyage times; Odfjell’s ~80-vessel chemical fleet must frequently reposition tonnage. Sanctions since 2022 removed ~2–3 mbpd of crude flows, altering demand and raising compliance/KYC costs. EU ETS from 2024 plus grants lower fuel-transition capex, though incentives are uneven.
| Metric | Value | Operational impact |
|---|---|---|
| Fleet | ~80 vessels | Repositioning needs |
| Sanctions shift | 2–3 mbpd | Rerouted lanes, higher compliance |
| Tariffs | 4–6% | Alters cargo economics |
| EU ETS | Included 2024 | Reduces transition capex |
What is included in the product
Detailed Word Document
Explores how external macro-environmental factors uniquely affect Odfjell across Political, Economic, Social, Technological, Environmental and Legal dimensions, with data-backed trends and forward-looking insights tailored to shipping and tank-storage operations; designed for executives, investors and consultants and ready for business plans and scenario planning.
Customizable Excel Spreadsheet
A concise, PESTLE‑segmented summary of external risks and opportunities for Odfjell that relieves research friction by being presentation‑ready, easily shared across teams, and annotated for regional or business‑line context.
Economic factors
Chemical demand cycle
Downstream industrial output, especially in Asia (about 60% of global chemical production), drives volumes in acids and intermediates, linking Odfjell cargo demand to regional manufacturing cycles. Inventory swings at producers have tightened spot cargo availability intermittently in 2023–24. Regional growth differentials shift trade balances between Asia, Europe and the US. Odfjell’s mix of contract and spot business cushions cyclical volatility.
Freight rate volatility
Freight rate volatility for Odfjell is driven by the balance between supply of coated/SS chemical tankers and demand, with the company operating roughly 70 vessels in 2024 so TCEs swing materially; yard deliveries and increased scrapping in 2023–24 shifted effective utilization quickly, tightening markets. Niche parceling and stainless-steel capability sustain premiums, and tight markets in 2024–25 amplified earnings leverage.
Fuel price dynamics
Bunker costs materially shape Odfjell voyage economics: global average VLSFO traded near $600/mt in 2024 while MGO averaged about $750/mt, squeezing margins on time-charter and spot routes.
The spread between VLSFO, MGO and LNG (LNG bunkers equivalent ~ $9–12/MMBtu in 2024–2025) drives fuel-choice and retrofit decisions for dual-fuel vessels.
Hedging programs and slow steaming remain core tactics to manage price volatility; Odfjell reported fuel hedges covering a material portion of 2024 consumption.
Terminal integration and ownership help smooth bunker procurement costs and gross margins by securing supply and blending flexibility.
Currency fluctuations
Odfjell’s USD-denominated voyage and storage revenues meet costs in NOK, EUR and various emerging market currencies, causing reported earnings to swing with FX moves. Natural hedges from overseas assets and targeted derivatives programs (FX forwards/options) are used to damp volatility. Contractual pricing clauses allow partial pass-through of currency and fuel cost shifts, limiting immediate P&L impact.
- USD revenue vs multi-currency costs
- NOK/EUR/emerging FX drive volatility
- Natural hedges + derivatives reduce swings
- Pricing clauses pass through part of FX/fuel risk
Interest rates and capex
Higher interest rates—with the US Fed funds peaking at 5.25–5.50% in 2023–24—raise Odfjell’s financing costs for fleet renewals and terminals, forcing higher hurdle rates for long‑lived assets and stricter capex discipline.
Lease versus debt choices shape cash‑flow flexibility and covenant risk; maintaining counter‑cyclical ordering (industry chemical tanker orderbook ~9–10% of fleet in 2024, per Clarksons) can lock in long‑term value.
- Higher policy rates: Fed peak 5.25–5.50% (2023–24)
- Orderbook: chemical tanker ~9–10% of fleet (2024, Clarksons)
- Implication: stricter hurdle rates, prefer flexible lease structures
- Strategy: counter‑cyclical ordering to capture value
Geopolitics reroute chemicals; ~80-ship fleet faces longer voyages
Odfjell demand tracks Asian chemical output (~60% global) and inventory swings tightened spot cargoes in 2023–24; fleet ~70 vessels (2024) buffers cycles. Freight TCEs rose in 2024–25 as orderbook ~9–10% (Clarksons) tightened supply; stainless-steel niche keeps premiums. Bunker averages in 2024: VLSFO ~$600/mt, MGO ~$750/mt, LNG ~$9–12/MMBtu; Fed funds peaked 5.25–5.50% (2023–24).
| Metric | 2024–25 |
|---|---|
| Fleet | ~70 vessels |
| Asian chem output | ~60% global |
| Orderbook | 9–10% (Clarksons) |
| Bunker | VLSFO $600/mt; MGO $750/mt |
| Fed funds | 5.25–5.50% |
What You See Is What You Get
Odfjell PESTLE Analysis
The Odfjell PESTLE Analysis preview shown here is the exact document you’ll receive after purchase—fully formatted and ready to use. It contains the complete political, economic, social, technological, legal, and environmental assessment for Odfjell as displayed. What you see is the final, professionally structured file you’ll download immediately after checkout.
Original: $10.00
-65%$10.00
$3.50Description
Your Shortcut to Market Insight Starts Here
Explore political, economic, social, technological, legal and environmental forces shaping Odfjell's tanker and chemical logistics business. Our concise PESTLE highlights regulatory risks, market drivers and ESG pressures to inform strategy and investment decisions. Buy the full analysis for detailed, actionable insights and ready-to-use deliverables.
Political factors
Geopolitical trade routes
Shifts in tensions in the Middle East, Black Sea or South China Sea can reroute chemical flows, forcing longer voyages and higher bunker and insurance costs. Corridor closures or heightened naval risk materially extend voyage times and premiums. Odfjell, with an ~80-strong chemical tanker fleet, must dynamically reposition tonnage to retain coverage and schedules. Political stability near chokepoints is a core operational exposure.
Sanctions exposure
Sanctions on producers or buyers reshape cargo eligibility and lanes, forcing Odfjell to reroute shipments and avoid restricted ports; industry-wide shifts since 2022 cut traditional Russian crude flows by roughly 2–3 million barrels per day, altering tanker demand patterns. Compliance limits counterparties and can idle specialized stainless-steel chemical tankers in a fleet of about 80 vessels. Rapid rule changes demand enhanced screening discipline and KYC, raising compliance cost and operational friction. A diversified customer base across regions reduces concentration risk and exposure to single-country sanctions.
Port state policies
Local content rules and cabotage can constrain coastal distribution, increasing operating costs for Odfjell's ~70 chemical tankers and pushing more cargo to deep-sea legs. Port access, pilotage and berth prioritization are politically influenced, with berth delays routinely adding days to schedules and raising voyage costs. Terminal permits hinge on municipal agendas and can take months, so strong stakeholder relations are key to securing operating continuity.
Trade agreements and tariffs
Tariffs on chemicals (commonly 4–6% in key markets) shift origin–destination patterns as shippers reroute to avoid duties, changing Odfjell’s ballast and laden legs and voyage economics. New trade deals since 2023 opened niche, higher-margin lanes for specialized cargoes, while heightened customs friction increasingly adds port time and handling cost. Odfjell benefits from stable, liberal trade regimes that reduce schedule risk and demurrage exposure.
- Tariff impact: 4–6% typical
- Customs delay: raises port time/cost
- Trade deals: open profitable specialized lanes
Subsidies and green incentives
Policy support such as the EU’s inclusion of maritime emissions in the ETS from 2024 and national grants can materially lower Odfjell’s fuel-transition capex, helping its ~80-vessel fleet de-risk alternative fuels and pilots.
- Grants/tax credits accelerate pilots
- Uneven national incentives complicate fleet choices
- Strategic alignment yields first-mover gains
Geopolitics reroute chemicals; ~80-ship fleet faces longer voyages
Geopolitical hotspots reroute chemical flows, raising bunker/insurance and voyage times; Odfjell’s ~80-vessel chemical fleet must frequently reposition tonnage. Sanctions since 2022 removed ~2–3 mbpd of crude flows, altering demand and raising compliance/KYC costs. EU ETS from 2024 plus grants lower fuel-transition capex, though incentives are uneven.
| Metric | Value | Operational impact |
|---|---|---|
| Fleet | ~80 vessels | Repositioning needs |
| Sanctions shift | 2–3 mbpd | Rerouted lanes, higher compliance |
| Tariffs | 4–6% | Alters cargo economics |
| EU ETS | Included 2024 | Reduces transition capex |
What is included in the product
Detailed Word Document
Explores how external macro-environmental factors uniquely affect Odfjell across Political, Economic, Social, Technological, Environmental and Legal dimensions, with data-backed trends and forward-looking insights tailored to shipping and tank-storage operations; designed for executives, investors and consultants and ready for business plans and scenario planning.
Customizable Excel Spreadsheet
A concise, PESTLE‑segmented summary of external risks and opportunities for Odfjell that relieves research friction by being presentation‑ready, easily shared across teams, and annotated for regional or business‑line context.
Economic factors
Chemical demand cycle
Downstream industrial output, especially in Asia (about 60% of global chemical production), drives volumes in acids and intermediates, linking Odfjell cargo demand to regional manufacturing cycles. Inventory swings at producers have tightened spot cargo availability intermittently in 2023–24. Regional growth differentials shift trade balances between Asia, Europe and the US. Odfjell’s mix of contract and spot business cushions cyclical volatility.
Freight rate volatility
Freight rate volatility for Odfjell is driven by the balance between supply of coated/SS chemical tankers and demand, with the company operating roughly 70 vessels in 2024 so TCEs swing materially; yard deliveries and increased scrapping in 2023–24 shifted effective utilization quickly, tightening markets. Niche parceling and stainless-steel capability sustain premiums, and tight markets in 2024–25 amplified earnings leverage.
Fuel price dynamics
Bunker costs materially shape Odfjell voyage economics: global average VLSFO traded near $600/mt in 2024 while MGO averaged about $750/mt, squeezing margins on time-charter and spot routes.
The spread between VLSFO, MGO and LNG (LNG bunkers equivalent ~ $9–12/MMBtu in 2024–2025) drives fuel-choice and retrofit decisions for dual-fuel vessels.
Hedging programs and slow steaming remain core tactics to manage price volatility; Odfjell reported fuel hedges covering a material portion of 2024 consumption.
Terminal integration and ownership help smooth bunker procurement costs and gross margins by securing supply and blending flexibility.
Currency fluctuations
Odfjell’s USD-denominated voyage and storage revenues meet costs in NOK, EUR and various emerging market currencies, causing reported earnings to swing with FX moves. Natural hedges from overseas assets and targeted derivatives programs (FX forwards/options) are used to damp volatility. Contractual pricing clauses allow partial pass-through of currency and fuel cost shifts, limiting immediate P&L impact.
- USD revenue vs multi-currency costs
- NOK/EUR/emerging FX drive volatility
- Natural hedges + derivatives reduce swings
- Pricing clauses pass through part of FX/fuel risk
Interest rates and capex
Higher interest rates—with the US Fed funds peaking at 5.25–5.50% in 2023–24—raise Odfjell’s financing costs for fleet renewals and terminals, forcing higher hurdle rates for long‑lived assets and stricter capex discipline.
Lease versus debt choices shape cash‑flow flexibility and covenant risk; maintaining counter‑cyclical ordering (industry chemical tanker orderbook ~9–10% of fleet in 2024, per Clarksons) can lock in long‑term value.
- Higher policy rates: Fed peak 5.25–5.50% (2023–24)
- Orderbook: chemical tanker ~9–10% of fleet (2024, Clarksons)
- Implication: stricter hurdle rates, prefer flexible lease structures
- Strategy: counter‑cyclical ordering to capture value
Geopolitics reroute chemicals; ~80-ship fleet faces longer voyages
Odfjell demand tracks Asian chemical output (~60% global) and inventory swings tightened spot cargoes in 2023–24; fleet ~70 vessels (2024) buffers cycles. Freight TCEs rose in 2024–25 as orderbook ~9–10% (Clarksons) tightened supply; stainless-steel niche keeps premiums. Bunker averages in 2024: VLSFO ~$600/mt, MGO ~$750/mt, LNG ~$9–12/MMBtu; Fed funds peaked 5.25–5.50% (2023–24).
| Metric | 2024–25 |
|---|---|
| Fleet | ~70 vessels |
| Asian chem output | ~60% global |
| Orderbook | 9–10% (Clarksons) |
| Bunker | VLSFO $600/mt; MGO $750/mt |
| Fed funds | 5.25–5.50% |
What You See Is What You Get
Odfjell PESTLE Analysis
The Odfjell PESTLE Analysis preview shown here is the exact document you’ll receive after purchase—fully formatted and ready to use. It contains the complete political, economic, social, technological, legal, and environmental assessment for Odfjell as displayed. What you see is the final, professionally structured file you’ll download immediately after checkout.











