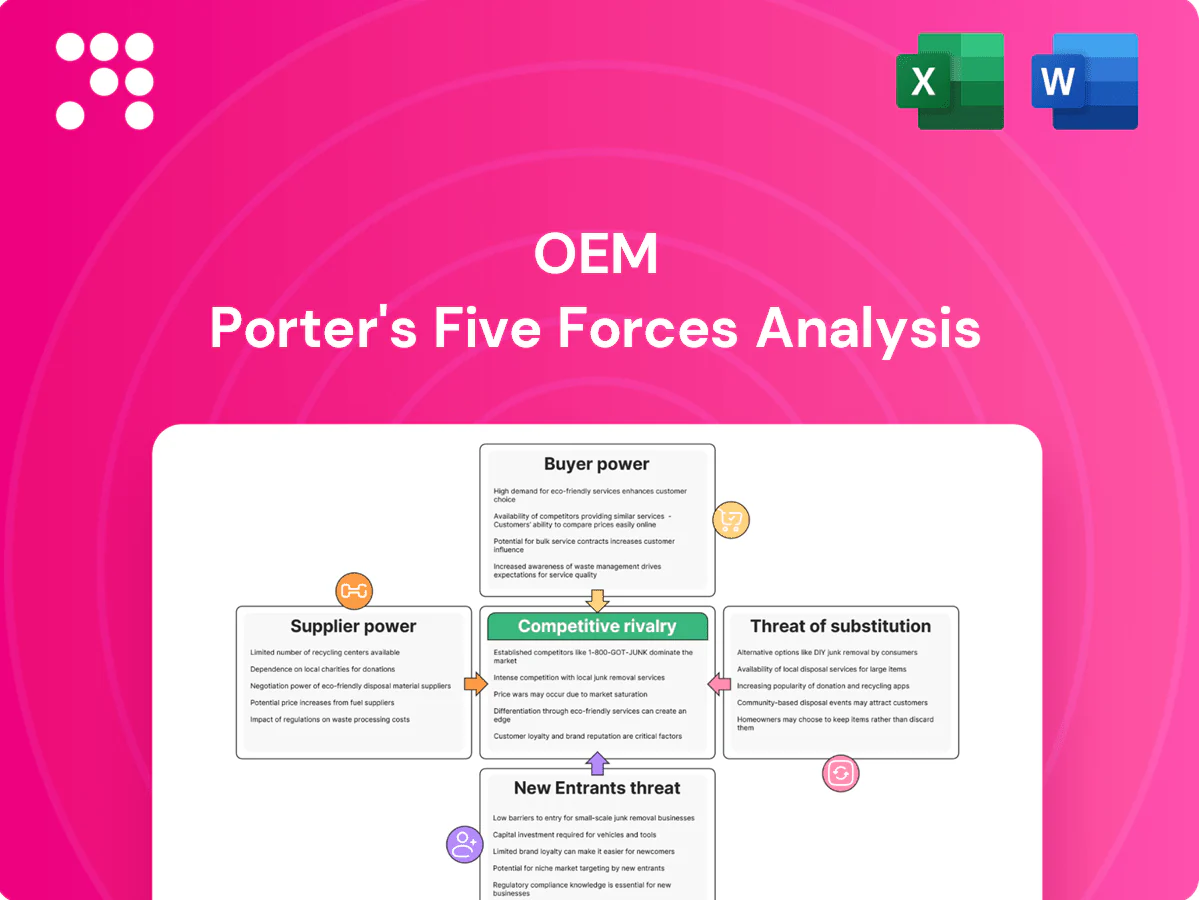
OEM Porter's Five Forces Analysis

From Overview to Strategy Blueprint
This snapshot highlights OEM’s competitive pressures across suppliers, buyers, substitutes and entrants but only scratches the surface. Unlock the full Porter's Five Forces Analysis to see force-by-force ratings, visuals and strategic implications tailored to OEM. Purchase the complete report for a consultant-grade breakdown to inform investment, strategy, or board-ready presentations.
Suppliers Bargaining Power

Concentrated key component OEMs
Many sensors, safety, and motion components come from a handful of global leaders such as Bosch, Continental, and Aptiv, concentrating supply and enabling these OEMs to tighten pricing and allocation during constrained cycles. OEM Automatic offsets leverage through multi-line portfolios but remains exposed on flagship SKUs where single-source suppliers dominate. Dual-sourcing and long-term agreements reduce disruption risk but cannot fully eliminate supplier bargaining power.
Technological differentiation and IP
High-spec OEM products are shielded by patents, certifications, and proprietary firmware, which limits interchangeability and drives switching costs for distributors; industry surveys in 2024 show proprietary IP underpins the majority of premium module value propositions. Suppliers leverage product roadmaps and exclusive features to protect margins and use early-release access as a bargaining chip tied to volume and co-marketing commitments.

Brand pull-through with end users
Industrial customers often lock brands into designs, tender documents and safety cases, giving suppliers leverage over channel partners and forcing distributors to stock leading labels to remain eligible for OEM contracts. Brand-driven demand raises pressure to comply with MAP policies and carry safety-certified inventory, increasing working capital and reducing distributor pricing flexibility in 2024 market dynamics.

Allocation risk and lead times
Selective channel and exclusivity
- Territorial exclusivity: protects margins but increases dependency
- Certification/demo stock: common requirement, ~50% adoption in 2024
- Non-compliance: risk of delisting and compressed bargaining power
High supplier power - 10-20w lead times, ~50% certified
Supplier power is high: key sensors and modules concentrated among Bosch, Continental, and Aptiv, enabling pricing and allocation leverage. Lead times remain elevated at roughly 10–20+ weeks in 2024, with suppliers prioritizing strategic OEMs. About 50% of OEMs had formal certification programs in 2024, raising switching costs; mitigation: dual-sourcing, long-term contracts, S&OP and VMI.
| Metric | 2024 |
|---|---|
| Lead times | 10–20+ weeks |
| Top suppliers | Bosch, Continental, Aptiv |
| OEM certification adoption | ~50% |
What is included in the product
 Detailed Word Document
Uncovers key drivers of competition, buyer and supplier power, and market entry risks specific to OEM, highlighting substitutes and disruptive threats to market share. Detailed, strategic commentary on pricing leverage and barriers to entry, delivered in fully editable Word format for easy integration into investor reports, strategy decks, or academic projects.

 Customizable Excel Spreadsheet
OEM Porter's Five Forces one-sheet visualizes supplier/buyer power, substitutes, entrants and rivalry with customizable pressure sliders and a radar chart—ready to drop into decks, duplicate for scenario analysis, and editable without macros for fast, boardroom-ready strategic decisions.
Customers Bargaining Power

Diverse but price-aware customer base
Customer set spans machine builders, system integrators and plant operators with order sizes from single-unit purchases to multi-year, high-volume contracts, creating diverse negotiation profiles. Aggregated buying power in 2024 continues to exert notable price pressure on commoditized SKUs, compressing margins. Technical value-add on complex solutions allows OEMs to defend premium pricing. Volume rebates and pre-kitted assemblies are routinely used to balance customer cost sensitivity.
Specification and qualification control
Buyers often lock components into designs and site standards, and a 2024 industry survey found 58% of OEM procurement managers cite switching costs as the primary barrier to supplier change once parts are specified. Once specified, replacement cycles can take 12–36 months, reducing buyer power mid-cycle. Pre-spec stages remain leverage points, with 45% of buyers actively evaluating alternatives before qualification. Providing engineering support during design-in boosts supplier stickiness by about 30% in 2024 data.

Information transparency and e-commerce
Online price comparison and datasheets give buyers more leverage on commoditized parts, with ~70% of B2B buyers using digital channels in 2024, pressuring margins on standard items. Buyers now benchmark distributors on lead time, MOQ and logistics; OEM Automatic can counter by bundling services and lifecycle guidance. Self-serve portals with technical filters raise retention and can lift ARPU by improving conversion rates.

Consolidated procurement practices
Service-level sensitivity
Downtime costs drive buyers to prioritize availability, support, and certification: US manufacturers faced an estimated $50 billion in unplanned downtime in 2024, making assured stock and commissioning support worth premiums of 3–7% to many buyers.
Strong aftersales and returns handling cut churn; 59% of OEM customers in 2024 surveys ranked performance KPIs above price when choosing suppliers.
- Availability: $50B 2024 US downtime estimate
- Premiums: buyers pay 3–7% for assured stock/support
- Aftersales: reduces churn, boosts retention
- KPIs: 59% prioritize performance over price (2024)
58% report switching costs; 70% buy digitally - availability earns 3–7% premium
Customer mix from single buys to multi-year contracts creates mixed negotiation power; 58% cite switching costs as main barrier (2024). Commoditized SKUs face price pressure as ~70% of B2B buyers use digital channels (2024), while complex solutions and service bundles sustain 3–7% premiums. KANBAN/VMI cut supplier inventory ~30%, and downtime risk ($50B US, 2024) raises willingness to pay for assured availability.
| Metric | 2024 |
|---|---|
| Switching-costs cited | 58% |
| Buyers using digital | 70% |
| Evaluating alternatives pre-spec | 45% |
| Downtime cost (US) | $50B |
| Premiums for assured stock/support | 3–7% |
| KANBAN/VMI inventory cut | ~30% |
| KPIs over price | 59% |
Same Document Delivered
OEM Porter's Five Forces Analysis
This preview shows the exact OEM Porter’s Five Forces analysis you’ll receive after purchase—no placeholders. The file is fully formatted and ready for immediate download and use. No mockups or samples; this is the final deliverable.

From Overview to Strategy Blueprint
This snapshot highlights OEM’s competitive pressures across suppliers, buyers, substitutes and entrants but only scratches the surface. Unlock the full Porter's Five Forces Analysis to see force-by-force ratings, visuals and strategic implications tailored to OEM. Purchase the complete report for a consultant-grade breakdown to inform investment, strategy, or board-ready presentations.
Suppliers Bargaining Power
Concentrated key component OEMs
Many sensors, safety, and motion components come from a handful of global leaders such as Bosch, Continental, and Aptiv, concentrating supply and enabling these OEMs to tighten pricing and allocation during constrained cycles. OEM Automatic offsets leverage through multi-line portfolios but remains exposed on flagship SKUs where single-source suppliers dominate. Dual-sourcing and long-term agreements reduce disruption risk but cannot fully eliminate supplier bargaining power.
Technological differentiation and IP
High-spec OEM products are shielded by patents, certifications, and proprietary firmware, which limits interchangeability and drives switching costs for distributors; industry surveys in 2024 show proprietary IP underpins the majority of premium module value propositions. Suppliers leverage product roadmaps and exclusive features to protect margins and use early-release access as a bargaining chip tied to volume and co-marketing commitments.
Brand pull-through with end users
Industrial customers often lock brands into designs, tender documents and safety cases, giving suppliers leverage over channel partners and forcing distributors to stock leading labels to remain eligible for OEM contracts. Brand-driven demand raises pressure to comply with MAP policies and carry safety-certified inventory, increasing working capital and reducing distributor pricing flexibility in 2024 market dynamics.
Allocation risk and lead times
Selective channel and exclusivity
- Territorial exclusivity: protects margins but increases dependency
- Certification/demo stock: common requirement, ~50% adoption in 2024
- Non-compliance: risk of delisting and compressed bargaining power
High supplier power - 10-20w lead times, ~50% certified
Supplier power is high: key sensors and modules concentrated among Bosch, Continental, and Aptiv, enabling pricing and allocation leverage. Lead times remain elevated at roughly 10–20+ weeks in 2024, with suppliers prioritizing strategic OEMs. About 50% of OEMs had formal certification programs in 2024, raising switching costs; mitigation: dual-sourcing, long-term contracts, S&OP and VMI.
| Metric | 2024 |
|---|---|
| Lead times | 10–20+ weeks |
| Top suppliers | Bosch, Continental, Aptiv |
| OEM certification adoption | ~50% |
What is included in the product
Detailed Word Document
Uncovers key drivers of competition, buyer and supplier power, and market entry risks specific to OEM, highlighting substitutes and disruptive threats to market share. Detailed, strategic commentary on pricing leverage and barriers to entry, delivered in fully editable Word format for easy integration into investor reports, strategy decks, or academic projects.
Customizable Excel Spreadsheet
OEM Porter's Five Forces one-sheet visualizes supplier/buyer power, substitutes, entrants and rivalry with customizable pressure sliders and a radar chart—ready to drop into decks, duplicate for scenario analysis, and editable without macros for fast, boardroom-ready strategic decisions.
Customers Bargaining Power
Diverse but price-aware customer base
Customer set spans machine builders, system integrators and plant operators with order sizes from single-unit purchases to multi-year, high-volume contracts, creating diverse negotiation profiles. Aggregated buying power in 2024 continues to exert notable price pressure on commoditized SKUs, compressing margins. Technical value-add on complex solutions allows OEMs to defend premium pricing. Volume rebates and pre-kitted assemblies are routinely used to balance customer cost sensitivity.
Specification and qualification control
Buyers often lock components into designs and site standards, and a 2024 industry survey found 58% of OEM procurement managers cite switching costs as the primary barrier to supplier change once parts are specified. Once specified, replacement cycles can take 12–36 months, reducing buyer power mid-cycle. Pre-spec stages remain leverage points, with 45% of buyers actively evaluating alternatives before qualification. Providing engineering support during design-in boosts supplier stickiness by about 30% in 2024 data.
Information transparency and e-commerce
Online price comparison and datasheets give buyers more leverage on commoditized parts, with ~70% of B2B buyers using digital channels in 2024, pressuring margins on standard items. Buyers now benchmark distributors on lead time, MOQ and logistics; OEM Automatic can counter by bundling services and lifecycle guidance. Self-serve portals with technical filters raise retention and can lift ARPU by improving conversion rates.
Consolidated procurement practices
Service-level sensitivity
Downtime costs drive buyers to prioritize availability, support, and certification: US manufacturers faced an estimated $50 billion in unplanned downtime in 2024, making assured stock and commissioning support worth premiums of 3–7% to many buyers.
Strong aftersales and returns handling cut churn; 59% of OEM customers in 2024 surveys ranked performance KPIs above price when choosing suppliers.
- Availability: $50B 2024 US downtime estimate
- Premiums: buyers pay 3–7% for assured stock/support
- Aftersales: reduces churn, boosts retention
- KPIs: 59% prioritize performance over price (2024)
58% report switching costs; 70% buy digitally - availability earns 3–7% premium
Customer mix from single buys to multi-year contracts creates mixed negotiation power; 58% cite switching costs as main barrier (2024). Commoditized SKUs face price pressure as ~70% of B2B buyers use digital channels (2024), while complex solutions and service bundles sustain 3–7% premiums. KANBAN/VMI cut supplier inventory ~30%, and downtime risk ($50B US, 2024) raises willingness to pay for assured availability.
| Metric | 2024 |
|---|---|
| Switching-costs cited | 58% |
| Buyers using digital | 70% |
| Evaluating alternatives pre-spec | 45% |
| Downtime cost (US) | $50B |
| Premiums for assured stock/support | 3–7% |
| KANBAN/VMI inventory cut | ~30% |
| KPIs over price | 59% |
Same Document Delivered
OEM Porter's Five Forces Analysis
This preview shows the exact OEM Porter’s Five Forces analysis you’ll receive after purchase—no placeholders. The file is fully formatted and ready for immediate download and use. No mockups or samples; this is the final deliverable.
Original: $10.00
-65%$10.00
$3.50Description
From Overview to Strategy Blueprint
This snapshot highlights OEM’s competitive pressures across suppliers, buyers, substitutes and entrants but only scratches the surface. Unlock the full Porter's Five Forces Analysis to see force-by-force ratings, visuals and strategic implications tailored to OEM. Purchase the complete report for a consultant-grade breakdown to inform investment, strategy, or board-ready presentations.
Suppliers Bargaining Power
Concentrated key component OEMs
Many sensors, safety, and motion components come from a handful of global leaders such as Bosch, Continental, and Aptiv, concentrating supply and enabling these OEMs to tighten pricing and allocation during constrained cycles. OEM Automatic offsets leverage through multi-line portfolios but remains exposed on flagship SKUs where single-source suppliers dominate. Dual-sourcing and long-term agreements reduce disruption risk but cannot fully eliminate supplier bargaining power.
Technological differentiation and IP
High-spec OEM products are shielded by patents, certifications, and proprietary firmware, which limits interchangeability and drives switching costs for distributors; industry surveys in 2024 show proprietary IP underpins the majority of premium module value propositions. Suppliers leverage product roadmaps and exclusive features to protect margins and use early-release access as a bargaining chip tied to volume and co-marketing commitments.
Brand pull-through with end users
Industrial customers often lock brands into designs, tender documents and safety cases, giving suppliers leverage over channel partners and forcing distributors to stock leading labels to remain eligible for OEM contracts. Brand-driven demand raises pressure to comply with MAP policies and carry safety-certified inventory, increasing working capital and reducing distributor pricing flexibility in 2024 market dynamics.
Allocation risk and lead times
Selective channel and exclusivity
- Territorial exclusivity: protects margins but increases dependency
- Certification/demo stock: common requirement, ~50% adoption in 2024
- Non-compliance: risk of delisting and compressed bargaining power
High supplier power - 10-20w lead times, ~50% certified
Supplier power is high: key sensors and modules concentrated among Bosch, Continental, and Aptiv, enabling pricing and allocation leverage. Lead times remain elevated at roughly 10–20+ weeks in 2024, with suppliers prioritizing strategic OEMs. About 50% of OEMs had formal certification programs in 2024, raising switching costs; mitigation: dual-sourcing, long-term contracts, S&OP and VMI.
| Metric | 2024 |
|---|---|
| Lead times | 10–20+ weeks |
| Top suppliers | Bosch, Continental, Aptiv |
| OEM certification adoption | ~50% |
What is included in the product
Detailed Word Document
Uncovers key drivers of competition, buyer and supplier power, and market entry risks specific to OEM, highlighting substitutes and disruptive threats to market share. Detailed, strategic commentary on pricing leverage and barriers to entry, delivered in fully editable Word format for easy integration into investor reports, strategy decks, or academic projects.
Customizable Excel Spreadsheet
OEM Porter's Five Forces one-sheet visualizes supplier/buyer power, substitutes, entrants and rivalry with customizable pressure sliders and a radar chart—ready to drop into decks, duplicate for scenario analysis, and editable without macros for fast, boardroom-ready strategic decisions.
Customers Bargaining Power
Diverse but price-aware customer base
Customer set spans machine builders, system integrators and plant operators with order sizes from single-unit purchases to multi-year, high-volume contracts, creating diverse negotiation profiles. Aggregated buying power in 2024 continues to exert notable price pressure on commoditized SKUs, compressing margins. Technical value-add on complex solutions allows OEMs to defend premium pricing. Volume rebates and pre-kitted assemblies are routinely used to balance customer cost sensitivity.
Specification and qualification control
Buyers often lock components into designs and site standards, and a 2024 industry survey found 58% of OEM procurement managers cite switching costs as the primary barrier to supplier change once parts are specified. Once specified, replacement cycles can take 12–36 months, reducing buyer power mid-cycle. Pre-spec stages remain leverage points, with 45% of buyers actively evaluating alternatives before qualification. Providing engineering support during design-in boosts supplier stickiness by about 30% in 2024 data.
Information transparency and e-commerce
Online price comparison and datasheets give buyers more leverage on commoditized parts, with ~70% of B2B buyers using digital channels in 2024, pressuring margins on standard items. Buyers now benchmark distributors on lead time, MOQ and logistics; OEM Automatic can counter by bundling services and lifecycle guidance. Self-serve portals with technical filters raise retention and can lift ARPU by improving conversion rates.
Consolidated procurement practices
Service-level sensitivity
Downtime costs drive buyers to prioritize availability, support, and certification: US manufacturers faced an estimated $50 billion in unplanned downtime in 2024, making assured stock and commissioning support worth premiums of 3–7% to many buyers.
Strong aftersales and returns handling cut churn; 59% of OEM customers in 2024 surveys ranked performance KPIs above price when choosing suppliers.
- Availability: $50B 2024 US downtime estimate
- Premiums: buyers pay 3–7% for assured stock/support
- Aftersales: reduces churn, boosts retention
- KPIs: 59% prioritize performance over price (2024)
58% report switching costs; 70% buy digitally - availability earns 3–7% premium
Customer mix from single buys to multi-year contracts creates mixed negotiation power; 58% cite switching costs as main barrier (2024). Commoditized SKUs face price pressure as ~70% of B2B buyers use digital channels (2024), while complex solutions and service bundles sustain 3–7% premiums. KANBAN/VMI cut supplier inventory ~30%, and downtime risk ($50B US, 2024) raises willingness to pay for assured availability.
| Metric | 2024 |
|---|---|
| Switching-costs cited | 58% |
| Buyers using digital | 70% |
| Evaluating alternatives pre-spec | 45% |
| Downtime cost (US) | $50B |
| Premiums for assured stock/support | 3–7% |
| KANBAN/VMI inventory cut | ~30% |
| KPIs over price | 59% |
Same Document Delivered
OEM Porter's Five Forces Analysis
This preview shows the exact OEM Porter’s Five Forces analysis you’ll receive after purchase—no placeholders. The file is fully formatted and ready for immediate download and use. No mockups or samples; this is the final deliverable.











