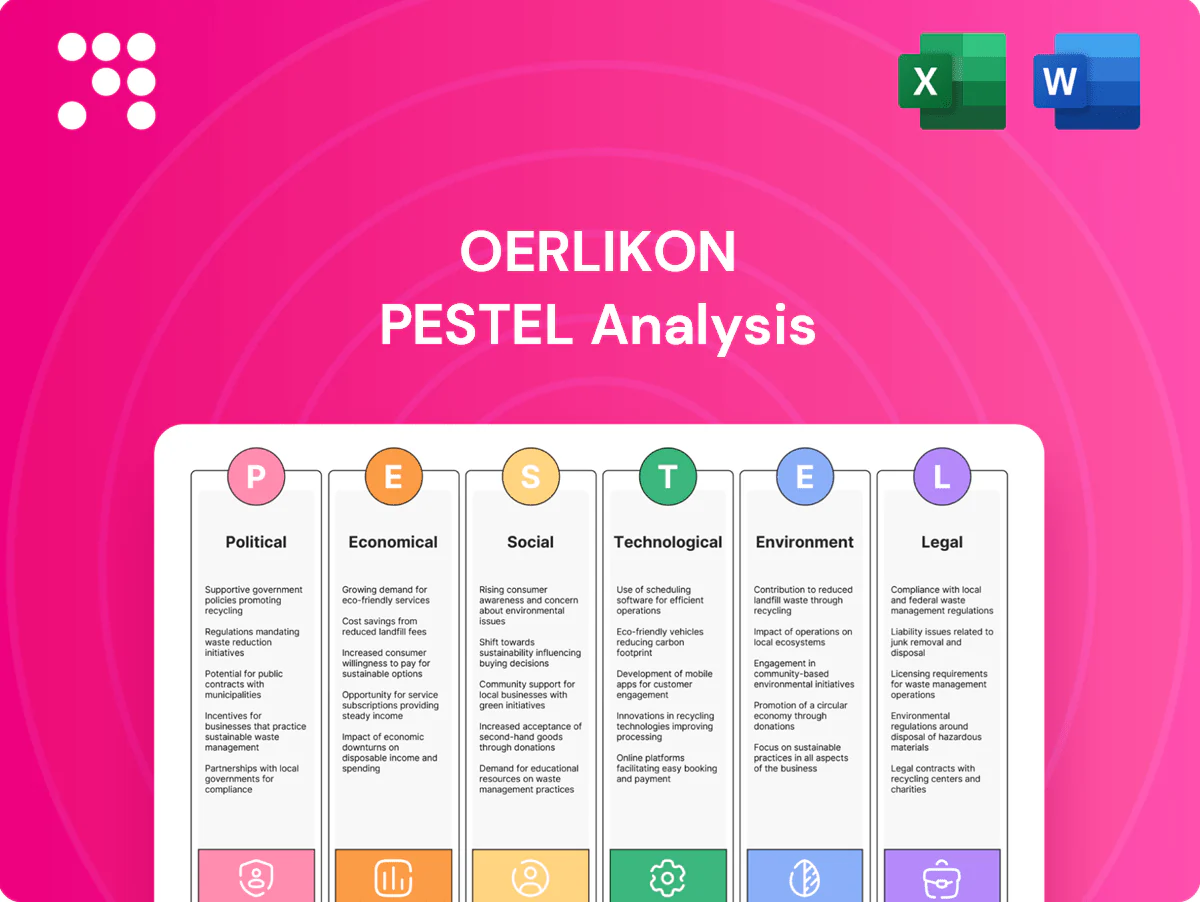
Oerlikon PESTLE Analysis

Your Shortcut to Market Insight Starts Here
Our PESTLE Analysis of Oerlikon maps political, economic, social, technological, legal and environmental forces shaping its future. Ideal for investors and strategists, it turns trends into actionable risks and opportunities. Buy the full, editable report now for instant, board‑ready intelligence.
Political factors

Trade policy and tariffs
Changes in tariffs and trade agreements materially affect cross-border sales of coating equipment, powders and spare parts, raising landed costs and complicating after-sales margins. Supply chains spanning Europe, the U.S. and Asia face customs friction and lead-time uncertainty, with WTO July 2024 forecasting world merchandise trade volume growth of 1.0% in 2024 and 2.7% in 2025. Favorable agreements lower cost-to-serve while protectionism raises pricing pressure; Oerlikon must diversify logistics routes and nearshore where feasible.
Industrial policy and subsidies
Government incentives—EU Chips Act mobilizing about €43 billion to 2030, US CHIPS Act $52 billion and IRA ~€340 billion energy/climate funding—can boost demand for Oerlikon surface solutions and polymer processing in advanced manufacturing, semiconductors and green industries. Accessing grants often requires local presence and strict compliance with state aid rules. Competing vendors may leverage subsidies to undercut prices. Proactive engagement with EU, US and Asian programs can secure co-financing for innovation.

Geopolitical tensions and sanctions
Sanctions regimes since 2022 have constrained aerospace, energy and defense-linked orders and service contracts, increasing contract reviews and deferrals for suppliers in affected regions. Export restrictions on high-performance materials and precision machine tools have forced shipment delays and re-routing of supply chains. Regional conflicts have driven higher energy prices and logistics risks, making rigorous screening and dual-use controls essential to protect export licenses and corporate reputation.

Public procurement and defense
Defense and public aerospace procurements demand strict compliance, offsets and local content (often 30–50%), while political priorities can shift budgets between civil and defense programs; SIPRI reports global military spending near $2.3 trillion in 2024. Long certification cycles (3–10 years) and qualification costs in the tens of millions create revenue visibility but high upfront investment; local partnerships improve tender success and policy compliance.
- Offsets/local content: 30–50%
- Global military spend: ~$2.3T (2024, SIPRI)
- Certification: 3–10 years, tens of millions USD
- Local partnerships: key to win tenders and meet policy
Regulatory stability in key markets
Policy predictability in Switzerland, the EU, U.S., China and India shapes Oerlikon investment planning: Switzerland scores in the top decile on World Bank governance indicators, the EU targets 55% emissions cuts by 2030, the U.S. Inflation Reduction Act allocates about 369 billion USD for clean energy, China targets carbon neutrality by 2060 and India runs PLI schemes ~20 billion USD—shifts alter product roadmaps and capex timing.
- Monitor policy pipelines to avoid surprise compliance costs
- Stable regimes encourage coating center and plant capex
- Regulatory shifts can force product roadmap changes
Risk and subsidies hit trade: +1.0% (2024) +2.7% (2025)
Political risks—trade barriers, sanctions and localization rules—raise landed costs, extend lead times and force supply‑chain re‑routing; WTO forecasts +1.0% trade volume (2024) and +2.7% (2025). Subsidy programs (EU Chips €43bn, US CHIPS $52bn, IRA ~$369bn) boost demand but require local presence. Defense tenders (offsets 30–50%) and global military spend ~$2.3T (2024) affect qualification costs and bidding.
| Metric | Value |
|---|---|
| World trade growth | +1.0% (2024), +2.7% (2025) |
| EU Chips | €43bn to 2030 |
| US CHIPS | $52bn |
| IRA | ~$369bn |
| Global military spend | ~$2.3T (2024) |
| Offsets/local content | 30–50% |
What is included in the product
 Detailed Word Document
Explores how macro-environmental forces uniquely impact Oerlikon across Political, Economic, Social, Technological, Environmental and Legal dimensions, with data-driven insights, scenario foresight and industry-specific examples to support strategic planning and investor-ready reporting.

 Customizable Excel Spreadsheet
Concise, visually segmented Oerlikon PESTLE summary that can be dropped into presentations or shared across teams, editable for region or business line to support quick alignment and focused external risk discussions during planning sessions.
Economic factors

Cyclical demand in end-markets
End-market cyclicality — automotive (global vehicle production ~78.6m in 2023), aerospace recovery (air travel near pre‑pandemic levels 2024), energy project timing and textile industry swings — drives Oerlikon order volatility; coatings and polymer processing follow capex cycles while services (aftermarket/service revenues ~30% of group mix) cushion downturns, with downturns compressing utilization/pricing and upturns creating capacity strain.
FX exposure and cost base
Oerlikon earns significant revenue in USD, EUR and CNY while a large portion of its cost base and reporting currency is CHF, creating translation and transaction risk that affects Swiss-franc-denominated margins. Currency swings, notably on exports of industrial equipment and metal powders, can compress margins on sales billed in weaker currencies. The firm uses hedging programs and increasing local production footprints to create natural offsets and reduce volatility. Pricing discipline and contract clauses (indexation/FX pass-through) further protect profitability.

Input costs and energy prices
Metal powders, specialty chemicals and energy are core cost drivers for Oerlikon; the global metal-powder market was roughly USD 8 billion in 2023, and energy can represent 15–25% of manufacturing costs in powder and coating businesses. Commodity price spikes (e.g., base metals) compress margins and disrupt supply chains, while long-term contracts and supplier diversification materially reduce exposure. Energy-efficiency investments (typical payback 3–7 years) lower unit costs over time.

Customer consolidation and bargaining power
- OEM duopoly: Airbus+Boeing ~90%
- Top automakers ~80% production
- Frameworks: 3–7 years, price caps
- SLAs: performance/service as margin lever
Investment and interest rate environment
Higher policy rates (Fed funds 5.25–5.50% and ECB deposit ~4.00–4.50% in 2024–2025) raise customers’ hurdle rates for new equipment and factories, slowing order cadence; Oerlikon’s own borrowing costs and weighted average cost of capital rise, constraining capex and M&A flexibility. Easing rates can unlock deferred textile and additive projects, while flexible financing offers accelerate customer conversions.
- Rates: Fed 5.25–5.50% / ECB ~4.00–4.50%
- Higher rates = higher customer hurdle rates
- Financing impacts Oerlikon capex & M&A
- Easing + flexible finance → unlock conversions
Risk and subsidies hit trade: +1.0% (2024) +2.7% (2025)
End-market cyclicality (global vehicle prod ~78.6m 2023; air travel ~pre‑pandemic 2024) and commodity/energy swings (metal powder market ~$8bn 2023; energy 15–25% of costs) drive order volatility; FX (CHF vs USD/EUR/CNY), higher rates (Fed 5.25–5.50% / ECB ~4.00–4.50% 2024–25) and customer concentration compress margins but services (~30% group mix) cushion revenue.
| Metric | Value |
|---|---|
| Vehicle prod | 78.6m (2023) |
| Metal powder | $8bn (2023) |
| Energy share | 15–25% |
| Services | ~30% |
| Rates | Fed 5.25–5.50% / ECB ~4.00–4.50% |
Full Version Awaits
Oerlikon PESTLE Analysis
The preview shown here is the exact Oerlikon PESTLE Analysis document you’ll receive after purchase—fully formatted and ready to use. It includes the complete political, economic, social, technological, legal and environmental assessment, tables and strategic insights. No placeholders or teasers—this is the final file you’ll download immediately after payment.

Your Shortcut to Market Insight Starts Here
Our PESTLE Analysis of Oerlikon maps political, economic, social, technological, legal and environmental forces shaping its future. Ideal for investors and strategists, it turns trends into actionable risks and opportunities. Buy the full, editable report now for instant, board‑ready intelligence.
Political factors
Trade policy and tariffs
Changes in tariffs and trade agreements materially affect cross-border sales of coating equipment, powders and spare parts, raising landed costs and complicating after-sales margins. Supply chains spanning Europe, the U.S. and Asia face customs friction and lead-time uncertainty, with WTO July 2024 forecasting world merchandise trade volume growth of 1.0% in 2024 and 2.7% in 2025. Favorable agreements lower cost-to-serve while protectionism raises pricing pressure; Oerlikon must diversify logistics routes and nearshore where feasible.
Industrial policy and subsidies
Government incentives—EU Chips Act mobilizing about €43 billion to 2030, US CHIPS Act $52 billion and IRA ~€340 billion energy/climate funding—can boost demand for Oerlikon surface solutions and polymer processing in advanced manufacturing, semiconductors and green industries. Accessing grants often requires local presence and strict compliance with state aid rules. Competing vendors may leverage subsidies to undercut prices. Proactive engagement with EU, US and Asian programs can secure co-financing for innovation.
Geopolitical tensions and sanctions
Sanctions regimes since 2022 have constrained aerospace, energy and defense-linked orders and service contracts, increasing contract reviews and deferrals for suppliers in affected regions. Export restrictions on high-performance materials and precision machine tools have forced shipment delays and re-routing of supply chains. Regional conflicts have driven higher energy prices and logistics risks, making rigorous screening and dual-use controls essential to protect export licenses and corporate reputation.
Public procurement and defense
Defense and public aerospace procurements demand strict compliance, offsets and local content (often 30–50%), while political priorities can shift budgets between civil and defense programs; SIPRI reports global military spending near $2.3 trillion in 2024. Long certification cycles (3–10 years) and qualification costs in the tens of millions create revenue visibility but high upfront investment; local partnerships improve tender success and policy compliance.
- Offsets/local content: 30–50%
- Global military spend: ~$2.3T (2024, SIPRI)
- Certification: 3–10 years, tens of millions USD
- Local partnerships: key to win tenders and meet policy
Regulatory stability in key markets
Policy predictability in Switzerland, the EU, U.S., China and India shapes Oerlikon investment planning: Switzerland scores in the top decile on World Bank governance indicators, the EU targets 55% emissions cuts by 2030, the U.S. Inflation Reduction Act allocates about 369 billion USD for clean energy, China targets carbon neutrality by 2060 and India runs PLI schemes ~20 billion USD—shifts alter product roadmaps and capex timing.
- Monitor policy pipelines to avoid surprise compliance costs
- Stable regimes encourage coating center and plant capex
- Regulatory shifts can force product roadmap changes
Risk and subsidies hit trade: +1.0% (2024) +2.7% (2025)
Political risks—trade barriers, sanctions and localization rules—raise landed costs, extend lead times and force supply‑chain re‑routing; WTO forecasts +1.0% trade volume (2024) and +2.7% (2025). Subsidy programs (EU Chips €43bn, US CHIPS $52bn, IRA ~$369bn) boost demand but require local presence. Defense tenders (offsets 30–50%) and global military spend ~$2.3T (2024) affect qualification costs and bidding.
| Metric | Value |
|---|---|
| World trade growth | +1.0% (2024), +2.7% (2025) |
| EU Chips | €43bn to 2030 |
| US CHIPS | $52bn |
| IRA | ~$369bn |
| Global military spend | ~$2.3T (2024) |
| Offsets/local content | 30–50% |
What is included in the product
Detailed Word Document
Explores how macro-environmental forces uniquely impact Oerlikon across Political, Economic, Social, Technological, Environmental and Legal dimensions, with data-driven insights, scenario foresight and industry-specific examples to support strategic planning and investor-ready reporting.
Customizable Excel Spreadsheet
Concise, visually segmented Oerlikon PESTLE summary that can be dropped into presentations or shared across teams, editable for region or business line to support quick alignment and focused external risk discussions during planning sessions.
Economic factors
Cyclical demand in end-markets
End-market cyclicality — automotive (global vehicle production ~78.6m in 2023), aerospace recovery (air travel near pre‑pandemic levels 2024), energy project timing and textile industry swings — drives Oerlikon order volatility; coatings and polymer processing follow capex cycles while services (aftermarket/service revenues ~30% of group mix) cushion downturns, with downturns compressing utilization/pricing and upturns creating capacity strain.
FX exposure and cost base
Oerlikon earns significant revenue in USD, EUR and CNY while a large portion of its cost base and reporting currency is CHF, creating translation and transaction risk that affects Swiss-franc-denominated margins. Currency swings, notably on exports of industrial equipment and metal powders, can compress margins on sales billed in weaker currencies. The firm uses hedging programs and increasing local production footprints to create natural offsets and reduce volatility. Pricing discipline and contract clauses (indexation/FX pass-through) further protect profitability.
Input costs and energy prices
Metal powders, specialty chemicals and energy are core cost drivers for Oerlikon; the global metal-powder market was roughly USD 8 billion in 2023, and energy can represent 15–25% of manufacturing costs in powder and coating businesses. Commodity price spikes (e.g., base metals) compress margins and disrupt supply chains, while long-term contracts and supplier diversification materially reduce exposure. Energy-efficiency investments (typical payback 3–7 years) lower unit costs over time.
Customer consolidation and bargaining power
- OEM duopoly: Airbus+Boeing ~90%
- Top automakers ~80% production
- Frameworks: 3–7 years, price caps
- SLAs: performance/service as margin lever
Investment and interest rate environment
Higher policy rates (Fed funds 5.25–5.50% and ECB deposit ~4.00–4.50% in 2024–2025) raise customers’ hurdle rates for new equipment and factories, slowing order cadence; Oerlikon’s own borrowing costs and weighted average cost of capital rise, constraining capex and M&A flexibility. Easing rates can unlock deferred textile and additive projects, while flexible financing offers accelerate customer conversions.
- Rates: Fed 5.25–5.50% / ECB ~4.00–4.50%
- Higher rates = higher customer hurdle rates
- Financing impacts Oerlikon capex & M&A
- Easing + flexible finance → unlock conversions
Risk and subsidies hit trade: +1.0% (2024) +2.7% (2025)
End-market cyclicality (global vehicle prod ~78.6m 2023; air travel ~pre‑pandemic 2024) and commodity/energy swings (metal powder market ~$8bn 2023; energy 15–25% of costs) drive order volatility; FX (CHF vs USD/EUR/CNY), higher rates (Fed 5.25–5.50% / ECB ~4.00–4.50% 2024–25) and customer concentration compress margins but services (~30% group mix) cushion revenue.
| Metric | Value |
|---|---|
| Vehicle prod | 78.6m (2023) |
| Metal powder | $8bn (2023) |
| Energy share | 15–25% |
| Services | ~30% |
| Rates | Fed 5.25–5.50% / ECB ~4.00–4.50% |
Full Version Awaits
Oerlikon PESTLE Analysis
The preview shown here is the exact Oerlikon PESTLE Analysis document you’ll receive after purchase—fully formatted and ready to use. It includes the complete political, economic, social, technological, legal and environmental assessment, tables and strategic insights. No placeholders or teasers—this is the final file you’ll download immediately after payment.
Description
Your Shortcut to Market Insight Starts Here
Our PESTLE Analysis of Oerlikon maps political, economic, social, technological, legal and environmental forces shaping its future. Ideal for investors and strategists, it turns trends into actionable risks and opportunities. Buy the full, editable report now for instant, board‑ready intelligence.
Political factors
Trade policy and tariffs
Changes in tariffs and trade agreements materially affect cross-border sales of coating equipment, powders and spare parts, raising landed costs and complicating after-sales margins. Supply chains spanning Europe, the U.S. and Asia face customs friction and lead-time uncertainty, with WTO July 2024 forecasting world merchandise trade volume growth of 1.0% in 2024 and 2.7% in 2025. Favorable agreements lower cost-to-serve while protectionism raises pricing pressure; Oerlikon must diversify logistics routes and nearshore where feasible.
Industrial policy and subsidies
Government incentives—EU Chips Act mobilizing about €43 billion to 2030, US CHIPS Act $52 billion and IRA ~€340 billion energy/climate funding—can boost demand for Oerlikon surface solutions and polymer processing in advanced manufacturing, semiconductors and green industries. Accessing grants often requires local presence and strict compliance with state aid rules. Competing vendors may leverage subsidies to undercut prices. Proactive engagement with EU, US and Asian programs can secure co-financing for innovation.
Geopolitical tensions and sanctions
Sanctions regimes since 2022 have constrained aerospace, energy and defense-linked orders and service contracts, increasing contract reviews and deferrals for suppliers in affected regions. Export restrictions on high-performance materials and precision machine tools have forced shipment delays and re-routing of supply chains. Regional conflicts have driven higher energy prices and logistics risks, making rigorous screening and dual-use controls essential to protect export licenses and corporate reputation.
Public procurement and defense
Defense and public aerospace procurements demand strict compliance, offsets and local content (often 30–50%), while political priorities can shift budgets between civil and defense programs; SIPRI reports global military spending near $2.3 trillion in 2024. Long certification cycles (3–10 years) and qualification costs in the tens of millions create revenue visibility but high upfront investment; local partnerships improve tender success and policy compliance.
- Offsets/local content: 30–50%
- Global military spend: ~$2.3T (2024, SIPRI)
- Certification: 3–10 years, tens of millions USD
- Local partnerships: key to win tenders and meet policy
Regulatory stability in key markets
Policy predictability in Switzerland, the EU, U.S., China and India shapes Oerlikon investment planning: Switzerland scores in the top decile on World Bank governance indicators, the EU targets 55% emissions cuts by 2030, the U.S. Inflation Reduction Act allocates about 369 billion USD for clean energy, China targets carbon neutrality by 2060 and India runs PLI schemes ~20 billion USD—shifts alter product roadmaps and capex timing.
- Monitor policy pipelines to avoid surprise compliance costs
- Stable regimes encourage coating center and plant capex
- Regulatory shifts can force product roadmap changes
Risk and subsidies hit trade: +1.0% (2024) +2.7% (2025)
Political risks—trade barriers, sanctions and localization rules—raise landed costs, extend lead times and force supply‑chain re‑routing; WTO forecasts +1.0% trade volume (2024) and +2.7% (2025). Subsidy programs (EU Chips €43bn, US CHIPS $52bn, IRA ~$369bn) boost demand but require local presence. Defense tenders (offsets 30–50%) and global military spend ~$2.3T (2024) affect qualification costs and bidding.
| Metric | Value |
|---|---|
| World trade growth | +1.0% (2024), +2.7% (2025) |
| EU Chips | €43bn to 2030 |
| US CHIPS | $52bn |
| IRA | ~$369bn |
| Global military spend | ~$2.3T (2024) |
| Offsets/local content | 30–50% |
What is included in the product
Detailed Word Document
Explores how macro-environmental forces uniquely impact Oerlikon across Political, Economic, Social, Technological, Environmental and Legal dimensions, with data-driven insights, scenario foresight and industry-specific examples to support strategic planning and investor-ready reporting.
Customizable Excel Spreadsheet
Concise, visually segmented Oerlikon PESTLE summary that can be dropped into presentations or shared across teams, editable for region or business line to support quick alignment and focused external risk discussions during planning sessions.
Economic factors
Cyclical demand in end-markets
End-market cyclicality — automotive (global vehicle production ~78.6m in 2023), aerospace recovery (air travel near pre‑pandemic levels 2024), energy project timing and textile industry swings — drives Oerlikon order volatility; coatings and polymer processing follow capex cycles while services (aftermarket/service revenues ~30% of group mix) cushion downturns, with downturns compressing utilization/pricing and upturns creating capacity strain.
FX exposure and cost base
Oerlikon earns significant revenue in USD, EUR and CNY while a large portion of its cost base and reporting currency is CHF, creating translation and transaction risk that affects Swiss-franc-denominated margins. Currency swings, notably on exports of industrial equipment and metal powders, can compress margins on sales billed in weaker currencies. The firm uses hedging programs and increasing local production footprints to create natural offsets and reduce volatility. Pricing discipline and contract clauses (indexation/FX pass-through) further protect profitability.
Input costs and energy prices
Metal powders, specialty chemicals and energy are core cost drivers for Oerlikon; the global metal-powder market was roughly USD 8 billion in 2023, and energy can represent 15–25% of manufacturing costs in powder and coating businesses. Commodity price spikes (e.g., base metals) compress margins and disrupt supply chains, while long-term contracts and supplier diversification materially reduce exposure. Energy-efficiency investments (typical payback 3–7 years) lower unit costs over time.
Customer consolidation and bargaining power
- OEM duopoly: Airbus+Boeing ~90%
- Top automakers ~80% production
- Frameworks: 3–7 years, price caps
- SLAs: performance/service as margin lever
Investment and interest rate environment
Higher policy rates (Fed funds 5.25–5.50% and ECB deposit ~4.00–4.50% in 2024–2025) raise customers’ hurdle rates for new equipment and factories, slowing order cadence; Oerlikon’s own borrowing costs and weighted average cost of capital rise, constraining capex and M&A flexibility. Easing rates can unlock deferred textile and additive projects, while flexible financing offers accelerate customer conversions.
- Rates: Fed 5.25–5.50% / ECB ~4.00–4.50%
- Higher rates = higher customer hurdle rates
- Financing impacts Oerlikon capex & M&A
- Easing + flexible finance → unlock conversions
Risk and subsidies hit trade: +1.0% (2024) +2.7% (2025)
End-market cyclicality (global vehicle prod ~78.6m 2023; air travel ~pre‑pandemic 2024) and commodity/energy swings (metal powder market ~$8bn 2023; energy 15–25% of costs) drive order volatility; FX (CHF vs USD/EUR/CNY), higher rates (Fed 5.25–5.50% / ECB ~4.00–4.50% 2024–25) and customer concentration compress margins but services (~30% group mix) cushion revenue.
| Metric | Value |
|---|---|
| Vehicle prod | 78.6m (2023) |
| Metal powder | $8bn (2023) |
| Energy share | 15–25% |
| Services | ~30% |
| Rates | Fed 5.25–5.50% / ECB ~4.00–4.50% |
Full Version Awaits
Oerlikon PESTLE Analysis
The preview shown here is the exact Oerlikon PESTLE Analysis document you’ll receive after purchase—fully formatted and ready to use. It includes the complete political, economic, social, technological, legal and environmental assessment, tables and strategic insights. No placeholders or teasers—this is the final file you’ll download immediately after payment.











