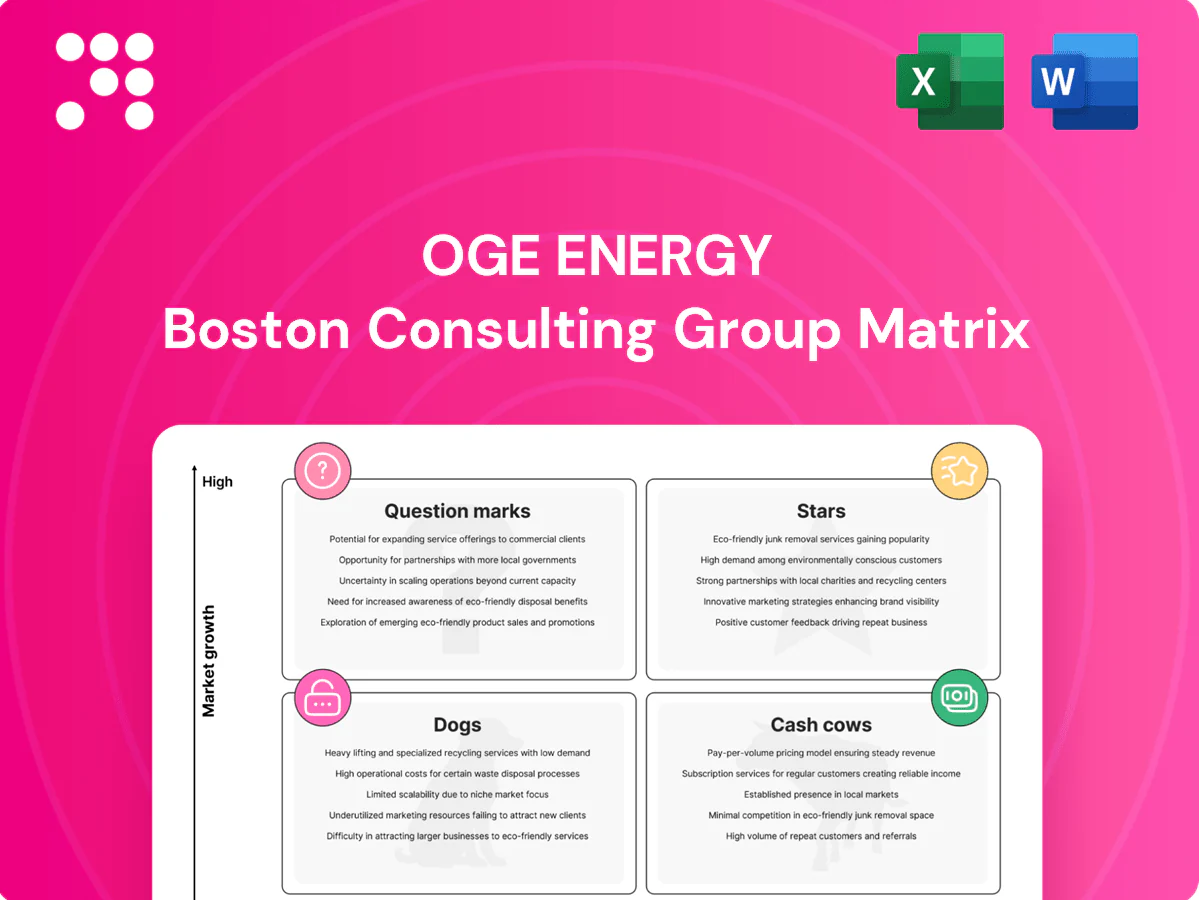
OGE Energy Boston Consulting Group Matrix

Actionable Strategy Starts Here
OGE Energy’s BCG Matrix snapshot shows where its business lines likely sit—some steady cash cows, a few question marks worth watching, and the occasional dog dragging returns. Want the full picture with quadrant-by-quadrant placement, data-backed recommendations, and clear strategic next steps? Purchase the complete BCG Matrix for a ready-to-use Word report plus an Excel summary that lets you present and act fast. Get instant access and stop guessing where to invest your capital next.
Stars

Regulated OG&E service in fast-growing metros
OGE Energy’s regulated OG&E footprint in the fast-growing Oklahoma City metro—about 1.4 million people (2023 Census estimate)—continues adding meters and load as population and industry expand. The utility, serving roughly 860,000 meters, holds high share by default but must invest for capacity, reliability, and customer programs. Maintain share and capital spend: this core is the cash-generating engine that can scale into larger free cash flow with disciplined investment.
Grid modernization and transmission build-out
Grid modernization and transmission build-out is a high-growth Star for OGE (ticker OGE), driven by needs for reliability, interconnection, renewables and resiliency amid a US interconnection queue exceeding 1,000 GW in 2024. OG&E’s ownership of assets and rights-of-way provides scale and regulatory support. Heavy CapEx today funds rate-base growth that locks in future earnings; fund it like a Star to secure tomorrow’s returns.

Utility-scale renewables tied to load growth
Wind and solar additions (owned or contracted) align with growing load and state/federal policy tailwinds in 2024. Market demand is rising; OG&E is the dominant investor-owned utility in its service territory, serving over 850,000 customers per OGE 2024 disclosures. Heavy build-era capex means cash in equals cash out for several years, but sustained deployment turns these assets into stable earners.

Industrial electrification and data-center load
Manufacturing, logistics and hyperscale compute are migrating to low-cost power hubs; OGE Energy (NYSE: OGE) serves roughly 875,000 electric customers across Oklahoma and western Arkansas, putting most incremental load within its footprint.
Growth in industrial electrification and data-center load is measurable but requires heavy upfront infrastructure spend—OGE’s multi-hundred-million-dollar substation and transmission programs in 2024 illustrate this.
Nailing interconnections and rate design compounds returns: streamlined interconnect queues and competitive industrial rates convert one-time infrastructure outlays into durable revenue.
- regional footprint: ~875,000 customers
- 2024 capex focus: multi-hundred-million $ transmission/substation projects
- key levers: interconnection speed, industrial/CT rate design
Energy efficiency and demand flexibility platforms
Programs that shave peaks and defer capacity are scaling fast; OG&E, serving about 860,000 customers, already controls the customer relationship so adoption can spread quickly. These platforms require promotion and integrations with meters, AMI and DER control systems, making them cash hungry in the near term. Over time they stabilize grid operations and increase regulated earned returns through lower peak-driven capital spend.
- Scale advantage: existing ~860,000-customer footprint
- Near-term cost: marketing, AMI/IT and integration capex
- System impact: reduced peak capacity needs, lower O&M and deferment value
- Long-term finance: more stable load profiles, higher earned ROE
Grid upgrades fuel multi-hundred-million capex and rate-base growth amid >1,000 GW queue
OGE Energy’s grid modernization, renewables and interconnection work are Stars: serving ~875,000 customers (OGE 2024 disclosures) in a fast-growing Oklahoma City metro, the utility must sustain multi-hundred-million-dollar 2024 transmission/substation capex to capture rising industrial and data-center load; US interconnection queue >1,000 GW (2024) underpins growth and rate-base expansion.
| Metric | 2024 |
|---|---|
| Customers | ~875,000 |
| CapEx focus | multi-hundred-million $ |
| Interconnection queue | >1,000 GW |
What is included in the product
 Detailed Word Document
Comprehensive BCG Matrix for OGE Energy, detailing Stars, Cash Cows, Question Marks, and Dogs with investment recommendations.

 Customizable Excel Spreadsheet
One-page OGE Energy BCG Matrix placing each business unit in a quadrant for fast strategic clarity and investor-ready slides.
Cash Cows

Legacy regulated distribution network
Legacy regulated distribution network is a mature, essential business with high market share by design, forming the backbone of OGE Energy’s utility earnings. Predictable cost recovery through rate cases and modest growth capex keep cash flows stable. Low marketing needs and steady opex improvements lift free cash generation. This reliable cash engine funds OGE’s growth and nonregulated activities.
Depreciated gas-fired generation
Older gas-fired units at OGE Energy remain cash cows: sunk capital is amortized while dispatch and capacity payments sustain steady cash flow. U.S. gas generation supplied roughly 38% of electricity in 2024 (EIA), supporting utilization in mature markets. Maintenance is measured, growth prospects low, but margins stay solid; prioritize efficiency gains and high availability to maximize free cash flow.

Residential customer base
OGE Energy’s residential base—about 860,000 customers in 2024—delivers stable usage, sticky customer relationships and routine monthly billing, producing low-growth, high-share cash flows with dependable cash conversion. Minimal promotional spend is required, and the segment accounted for roughly 60% of regulated utility revenues in 2024, freeing cash to underwrite growth investments.

Transmission assets with established tariffs
Transmission assets with established tariffs deliver steady regulated returns (allowed ROE ~9–10% in 2024), very low customer churn and are system-critical; incremental upgrades (capex) boost earning capacity while base tariffs already cover recovery and cash flow, requiring minimal “selling” and mostly execution and compliance—a classic cash generator for OGE Energy.
- Regulated returns ~9–10% (2024)
- Low churn, essential grid role
- Upgrades add earnings
- Base tariffs pay, minimal sales
Dividend capacity from regulated earnings
OGE Energy’s regulated utility generates steady free cash that underpins a reliable dividend and payout policy, with modest growth and high predictability in earnings. The board can prioritize returns over aggressive reinvestment here, treating the utility as the cash reservoir to fund Stars and selective growth bets.
- Dividend stability
- Modest growth, high predictability
- Capital source for growth
Regulated cash engine: 860,000 customers, ~60% rev
Legacy regulated distribution and transmission are OGE Energy cash cows: ~860,000 customers (2024), ~60% of regulated revenues, allowed ROE ~9–10% (2024), steady rate recovery and low growth capex sustain predictable free cash flow used for dividends and growth.
| Metric | 2024 |
|---|---|
| Customers | 860,000 |
| Regulated rev share | ~60% |
| Allowed ROE | 9–10% |
Preview = Final Product
OGE Energy BCG Matrix
The OGE Energy BCG Matrix you're previewing here is the exact same polished file you'll receive after purchase — no watermarks, no demo placeholders, just the finished strategic report. Built for clarity and quick decision-making, it maps OGE Energy’s business units with market-backed analysis and clean visuals. After buying, the full document is immediately downloadable and editable so you can present or plug it into planning without extra work. This is the real deliverable — ready to use, right away.

Actionable Strategy Starts Here
OGE Energy’s BCG Matrix snapshot shows where its business lines likely sit—some steady cash cows, a few question marks worth watching, and the occasional dog dragging returns. Want the full picture with quadrant-by-quadrant placement, data-backed recommendations, and clear strategic next steps? Purchase the complete BCG Matrix for a ready-to-use Word report plus an Excel summary that lets you present and act fast. Get instant access and stop guessing where to invest your capital next.
Stars
Regulated OG&E service in fast-growing metros
OGE Energy’s regulated OG&E footprint in the fast-growing Oklahoma City metro—about 1.4 million people (2023 Census estimate)—continues adding meters and load as population and industry expand. The utility, serving roughly 860,000 meters, holds high share by default but must invest for capacity, reliability, and customer programs. Maintain share and capital spend: this core is the cash-generating engine that can scale into larger free cash flow with disciplined investment.
Grid modernization and transmission build-out
Grid modernization and transmission build-out is a high-growth Star for OGE (ticker OGE), driven by needs for reliability, interconnection, renewables and resiliency amid a US interconnection queue exceeding 1,000 GW in 2024. OG&E’s ownership of assets and rights-of-way provides scale and regulatory support. Heavy CapEx today funds rate-base growth that locks in future earnings; fund it like a Star to secure tomorrow’s returns.
Utility-scale renewables tied to load growth
Wind and solar additions (owned or contracted) align with growing load and state/federal policy tailwinds in 2024. Market demand is rising; OG&E is the dominant investor-owned utility in its service territory, serving over 850,000 customers per OGE 2024 disclosures. Heavy build-era capex means cash in equals cash out for several years, but sustained deployment turns these assets into stable earners.
Industrial electrification and data-center load
Manufacturing, logistics and hyperscale compute are migrating to low-cost power hubs; OGE Energy (NYSE: OGE) serves roughly 875,000 electric customers across Oklahoma and western Arkansas, putting most incremental load within its footprint.
Growth in industrial electrification and data-center load is measurable but requires heavy upfront infrastructure spend—OGE’s multi-hundred-million-dollar substation and transmission programs in 2024 illustrate this.
Nailing interconnections and rate design compounds returns: streamlined interconnect queues and competitive industrial rates convert one-time infrastructure outlays into durable revenue.
- regional footprint: ~875,000 customers
- 2024 capex focus: multi-hundred-million $ transmission/substation projects
- key levers: interconnection speed, industrial/CT rate design
Energy efficiency and demand flexibility platforms
Programs that shave peaks and defer capacity are scaling fast; OG&E, serving about 860,000 customers, already controls the customer relationship so adoption can spread quickly. These platforms require promotion and integrations with meters, AMI and DER control systems, making them cash hungry in the near term. Over time they stabilize grid operations and increase regulated earned returns through lower peak-driven capital spend.
- Scale advantage: existing ~860,000-customer footprint
- Near-term cost: marketing, AMI/IT and integration capex
- System impact: reduced peak capacity needs, lower O&M and deferment value
- Long-term finance: more stable load profiles, higher earned ROE
Grid upgrades fuel multi-hundred-million capex and rate-base growth amid >1,000 GW queue
OGE Energy’s grid modernization, renewables and interconnection work are Stars: serving ~875,000 customers (OGE 2024 disclosures) in a fast-growing Oklahoma City metro, the utility must sustain multi-hundred-million-dollar 2024 transmission/substation capex to capture rising industrial and data-center load; US interconnection queue >1,000 GW (2024) underpins growth and rate-base expansion.
| Metric | 2024 |
|---|---|
| Customers | ~875,000 |
| CapEx focus | multi-hundred-million $ |
| Interconnection queue | >1,000 GW |
What is included in the product
Detailed Word Document
Comprehensive BCG Matrix for OGE Energy, detailing Stars, Cash Cows, Question Marks, and Dogs with investment recommendations.
Customizable Excel Spreadsheet
One-page OGE Energy BCG Matrix placing each business unit in a quadrant for fast strategic clarity and investor-ready slides.
Cash Cows
Legacy regulated distribution network
Legacy regulated distribution network is a mature, essential business with high market share by design, forming the backbone of OGE Energy’s utility earnings. Predictable cost recovery through rate cases and modest growth capex keep cash flows stable. Low marketing needs and steady opex improvements lift free cash generation. This reliable cash engine funds OGE’s growth and nonregulated activities.
Depreciated gas-fired generation
Older gas-fired units at OGE Energy remain cash cows: sunk capital is amortized while dispatch and capacity payments sustain steady cash flow. U.S. gas generation supplied roughly 38% of electricity in 2024 (EIA), supporting utilization in mature markets. Maintenance is measured, growth prospects low, but margins stay solid; prioritize efficiency gains and high availability to maximize free cash flow.
Residential customer base
OGE Energy’s residential base—about 860,000 customers in 2024—delivers stable usage, sticky customer relationships and routine monthly billing, producing low-growth, high-share cash flows with dependable cash conversion. Minimal promotional spend is required, and the segment accounted for roughly 60% of regulated utility revenues in 2024, freeing cash to underwrite growth investments.
Transmission assets with established tariffs
Transmission assets with established tariffs deliver steady regulated returns (allowed ROE ~9–10% in 2024), very low customer churn and are system-critical; incremental upgrades (capex) boost earning capacity while base tariffs already cover recovery and cash flow, requiring minimal “selling” and mostly execution and compliance—a classic cash generator for OGE Energy.
- Regulated returns ~9–10% (2024)
- Low churn, essential grid role
- Upgrades add earnings
- Base tariffs pay, minimal sales
Dividend capacity from regulated earnings
OGE Energy’s regulated utility generates steady free cash that underpins a reliable dividend and payout policy, with modest growth and high predictability in earnings. The board can prioritize returns over aggressive reinvestment here, treating the utility as the cash reservoir to fund Stars and selective growth bets.
- Dividend stability
- Modest growth, high predictability
- Capital source for growth
Regulated cash engine: 860,000 customers, ~60% rev
Legacy regulated distribution and transmission are OGE Energy cash cows: ~860,000 customers (2024), ~60% of regulated revenues, allowed ROE ~9–10% (2024), steady rate recovery and low growth capex sustain predictable free cash flow used for dividends and growth.
| Metric | 2024 |
|---|---|
| Customers | 860,000 |
| Regulated rev share | ~60% |
| Allowed ROE | 9–10% |
Preview = Final Product
OGE Energy BCG Matrix
The OGE Energy BCG Matrix you're previewing here is the exact same polished file you'll receive after purchase — no watermarks, no demo placeholders, just the finished strategic report. Built for clarity and quick decision-making, it maps OGE Energy’s business units with market-backed analysis and clean visuals. After buying, the full document is immediately downloadable and editable so you can present or plug it into planning without extra work. This is the real deliverable — ready to use, right away.
Description
Actionable Strategy Starts Here
OGE Energy’s BCG Matrix snapshot shows where its business lines likely sit—some steady cash cows, a few question marks worth watching, and the occasional dog dragging returns. Want the full picture with quadrant-by-quadrant placement, data-backed recommendations, and clear strategic next steps? Purchase the complete BCG Matrix for a ready-to-use Word report plus an Excel summary that lets you present and act fast. Get instant access and stop guessing where to invest your capital next.
Stars
Regulated OG&E service in fast-growing metros
OGE Energy’s regulated OG&E footprint in the fast-growing Oklahoma City metro—about 1.4 million people (2023 Census estimate)—continues adding meters and load as population and industry expand. The utility, serving roughly 860,000 meters, holds high share by default but must invest for capacity, reliability, and customer programs. Maintain share and capital spend: this core is the cash-generating engine that can scale into larger free cash flow with disciplined investment.
Grid modernization and transmission build-out
Grid modernization and transmission build-out is a high-growth Star for OGE (ticker OGE), driven by needs for reliability, interconnection, renewables and resiliency amid a US interconnection queue exceeding 1,000 GW in 2024. OG&E’s ownership of assets and rights-of-way provides scale and regulatory support. Heavy CapEx today funds rate-base growth that locks in future earnings; fund it like a Star to secure tomorrow’s returns.
Utility-scale renewables tied to load growth
Wind and solar additions (owned or contracted) align with growing load and state/federal policy tailwinds in 2024. Market demand is rising; OG&E is the dominant investor-owned utility in its service territory, serving over 850,000 customers per OGE 2024 disclosures. Heavy build-era capex means cash in equals cash out for several years, but sustained deployment turns these assets into stable earners.
Industrial electrification and data-center load
Manufacturing, logistics and hyperscale compute are migrating to low-cost power hubs; OGE Energy (NYSE: OGE) serves roughly 875,000 electric customers across Oklahoma and western Arkansas, putting most incremental load within its footprint.
Growth in industrial electrification and data-center load is measurable but requires heavy upfront infrastructure spend—OGE’s multi-hundred-million-dollar substation and transmission programs in 2024 illustrate this.
Nailing interconnections and rate design compounds returns: streamlined interconnect queues and competitive industrial rates convert one-time infrastructure outlays into durable revenue.
- regional footprint: ~875,000 customers
- 2024 capex focus: multi-hundred-million $ transmission/substation projects
- key levers: interconnection speed, industrial/CT rate design
Energy efficiency and demand flexibility platforms
Programs that shave peaks and defer capacity are scaling fast; OG&E, serving about 860,000 customers, already controls the customer relationship so adoption can spread quickly. These platforms require promotion and integrations with meters, AMI and DER control systems, making them cash hungry in the near term. Over time they stabilize grid operations and increase regulated earned returns through lower peak-driven capital spend.
- Scale advantage: existing ~860,000-customer footprint
- Near-term cost: marketing, AMI/IT and integration capex
- System impact: reduced peak capacity needs, lower O&M and deferment value
- Long-term finance: more stable load profiles, higher earned ROE
Grid upgrades fuel multi-hundred-million capex and rate-base growth amid >1,000 GW queue
OGE Energy’s grid modernization, renewables and interconnection work are Stars: serving ~875,000 customers (OGE 2024 disclosures) in a fast-growing Oklahoma City metro, the utility must sustain multi-hundred-million-dollar 2024 transmission/substation capex to capture rising industrial and data-center load; US interconnection queue >1,000 GW (2024) underpins growth and rate-base expansion.
| Metric | 2024 |
|---|---|
| Customers | ~875,000 |
| CapEx focus | multi-hundred-million $ |
| Interconnection queue | >1,000 GW |
What is included in the product
Detailed Word Document
Comprehensive BCG Matrix for OGE Energy, detailing Stars, Cash Cows, Question Marks, and Dogs with investment recommendations.
Customizable Excel Spreadsheet
One-page OGE Energy BCG Matrix placing each business unit in a quadrant for fast strategic clarity and investor-ready slides.
Cash Cows
Legacy regulated distribution network
Legacy regulated distribution network is a mature, essential business with high market share by design, forming the backbone of OGE Energy’s utility earnings. Predictable cost recovery through rate cases and modest growth capex keep cash flows stable. Low marketing needs and steady opex improvements lift free cash generation. This reliable cash engine funds OGE’s growth and nonregulated activities.
Depreciated gas-fired generation
Older gas-fired units at OGE Energy remain cash cows: sunk capital is amortized while dispatch and capacity payments sustain steady cash flow. U.S. gas generation supplied roughly 38% of electricity in 2024 (EIA), supporting utilization in mature markets. Maintenance is measured, growth prospects low, but margins stay solid; prioritize efficiency gains and high availability to maximize free cash flow.
Residential customer base
OGE Energy’s residential base—about 860,000 customers in 2024—delivers stable usage, sticky customer relationships and routine monthly billing, producing low-growth, high-share cash flows with dependable cash conversion. Minimal promotional spend is required, and the segment accounted for roughly 60% of regulated utility revenues in 2024, freeing cash to underwrite growth investments.
Transmission assets with established tariffs
Transmission assets with established tariffs deliver steady regulated returns (allowed ROE ~9–10% in 2024), very low customer churn and are system-critical; incremental upgrades (capex) boost earning capacity while base tariffs already cover recovery and cash flow, requiring minimal “selling” and mostly execution and compliance—a classic cash generator for OGE Energy.
- Regulated returns ~9–10% (2024)
- Low churn, essential grid role
- Upgrades add earnings
- Base tariffs pay, minimal sales
Dividend capacity from regulated earnings
OGE Energy’s regulated utility generates steady free cash that underpins a reliable dividend and payout policy, with modest growth and high predictability in earnings. The board can prioritize returns over aggressive reinvestment here, treating the utility as the cash reservoir to fund Stars and selective growth bets.
- Dividend stability
- Modest growth, high predictability
- Capital source for growth
Regulated cash engine: 860,000 customers, ~60% rev
Legacy regulated distribution and transmission are OGE Energy cash cows: ~860,000 customers (2024), ~60% of regulated revenues, allowed ROE ~9–10% (2024), steady rate recovery and low growth capex sustain predictable free cash flow used for dividends and growth.
| Metric | 2024 |
|---|---|
| Customers | 860,000 |
| Regulated rev share | ~60% |
| Allowed ROE | 9–10% |
Preview = Final Product
OGE Energy BCG Matrix
The OGE Energy BCG Matrix you're previewing here is the exact same polished file you'll receive after purchase — no watermarks, no demo placeholders, just the finished strategic report. Built for clarity and quick decision-making, it maps OGE Energy’s business units with market-backed analysis and clean visuals. After buying, the full document is immediately downloadable and editable so you can present or plug it into planning without extra work. This is the real deliverable — ready to use, right away.











