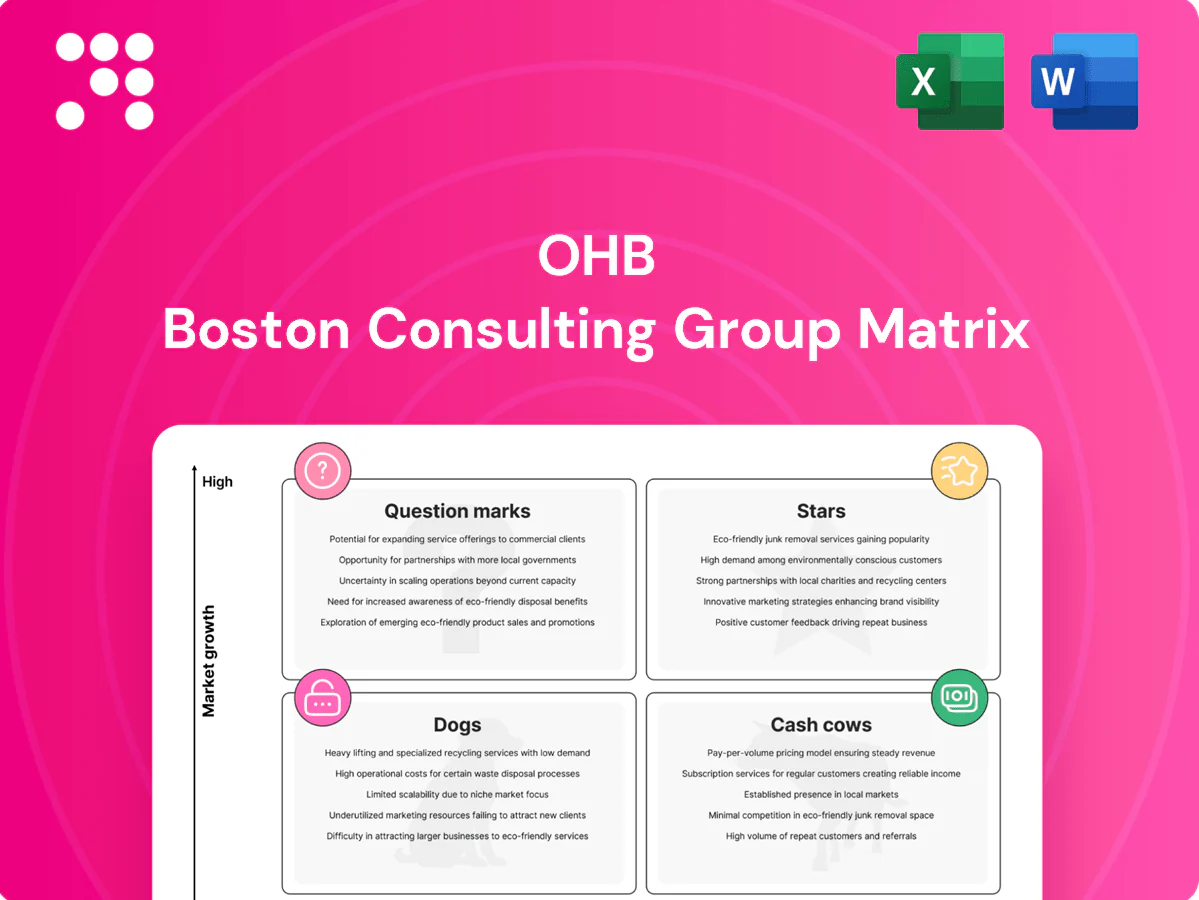
OHB Boston Consulting Group Matrix

Unlock Strategic Clarity
Curious where OHB’s products land—Stars, Cash Cows, Dogs or Question Marks? This quick preview teases the shape of their portfolio, but the full BCG Matrix gives you quadrant-by-quadrant clarity, data-backed recommendations, and a practical roadmap for capital allocation. Buy the complete report for a ready-to-use Word analysis plus an editable Excel summary you can present to the board. Get instant access and stop guessing—make strategic moves with confidence.
Stars

Galileo navigation satellites
Galileo navigation satellites are a Stars asset for OHB with over 25 satellites in orbit as of 2024, reflecting high market share in the growing European GNSS program. Visible leadership comes with heavy capex, talent and schedule support obligations that keep near-term margins constrained. Continue investing to defend flight heritage and scale production capacity. If OHB holds the line, this segment can mature into durable cash flow.
Copernicus/Earth‑observation payloads
Institutional demand for Copernicus/Earth‑observation payloads is rising and OHB is a go‑to prime on key missions, supported by a multi‑billion euro EU Copernicus programme (2021–27) and over 10 Sentinel satellites in orbit as of 2024. Growth is strong but competition is active and campaign-driven development soaks up cash, with OHB Group revenue around €1.1bn in 2023 highlighting scale. Promotion relies on bid excellence and partner orchestration, not ads; sustaining current wins is critical to convert 2024 pipeline work into future annuities.

Government security and ISR satellites
Government security and ISR satellites sit in OHB’s BCG matrix as a cash-match growth star: European defense space budgets climbed sharply, with NATO Europe defense spending exceeding €320 billion in 2024, sustaining strong procurement demand for ISR capabilities.
OHB has program credibility and multiple satellites in flight, but delivery tempo needs ongoing investment; 2024 order intake patterns show revenue growth pressure on working capital and capex to keep pace.
Cash in largely equals cash out while growth runs hot, so keeping production capacity tight and prioritizing margin-preserving contracts will drive profitability as volume scales.

LEO smallsat constellations (institutional)
LEO smallsat constellations for institutional customers show rapidly expanding use cases in 2024, and OHB leverages proven modular buses plus mission know-how to secure selected tranches; share is solid there but working capital remains hungry as programs scale. Scale manufacturing and supplier reliability are critical to lock leadership, since win rate now decides tomorrow’s cash cow.
- market-trend: 2024 rapid institutional demand growth
- capability: modular buses + mission expertise
- finance: solid share on tranches, high working capital need
- strategy: scale manufacturing & supplier reliability
- priority: win rate determines future cash cow
Integrated ground segment suites
Integrated ground segment suites at OHB are a Stars category: adoption has risen with each mission award, supporting a reported 2024 group revenue of €1.12bn and an order backlog near €2.0bn, with strong installed-base pull‑through but rising feature velocity and integration draining engineering capacity.
Priority is landing multi‑mission platforms to entrench share; expect near‑term growth now and margin expansion later as platforms scale.
- Installed base: leverages recurring revenue
- Resource pressure: high R&D/integration burn
- Strategy: pursue multi‑mission platforms
- Timing: growth today, margins later
Galileo & Copernicus wins drive rapid revenue; capex strains near-term margins
Galileo, Copernicus EO, ISR and ground systems are Stars for OHB: >25 Galileo sats in orbit (2024), Copernicus pull and LEO tranche wins drive rapid revenue growth, but heavy capex and working‑capital pressure constrain near‑term margins. Group revenue ~€1.12bn (2024) with backlog ~€2.0bn; win rate and scale manufacturing decide long‑term cash conversion.
| Metric | 2024 |
|---|---|
| Galileo sats | >25 |
| Group revenue | ~€1.12bn |
| Order backlog | ~€2.0bn |
| NATO Europe defence spend | >€320bn |
What is included in the product
 Detailed Word Document
In-depth OHB BCG Matrix review: identifies Stars, Cash Cows, Question Marks, Dogs with strategic recommendations to invest, hold, or divest.

 Customizable Excel Spreadsheet
One-page OHB BCG Matrix that pins each unit to a quadrant, cutting decision friction for execs.
Cash Cows

Long‑term ESA framework and service contracts
Long-term ESA framework and service contracts anchor OHB with predictable funding from ESA's ~€7.1bn 2024 program, yielding mature programs and high renewal likelihood. These cash cows show low growth but steady margins, supporting operational free cash flow and a multi-year order pipeline. Focus on optimizing delivery and spotless compliance to milk reliability without over-engineering.
Satellite AIT and integration services
Satellite AIT and integration services are cash cows for OHB: established processes and repeatable revenue underpin high bay utilization (bays typically >85%), with group revenue context (~€1.38bn in 2023) validating scale. Market growth is moderate, but defendable throughput and QA discipline sustain margins; incremental automation projects in 2024 targeted 10–15% uplift in cash flow per program. Keep bays full and QA tight.

Subsystems and components supply
Subsystems and components supply
Qualified parts with heritage sell themselves; growth is modest but OHB holds strong share in chosen niches. Standardizing SKUs and improving lead times can widen margins. In 2024 OHB reported an order backlog above €2bn, letting cash flows fund the next big bet.
Operations and maintenance contracts
Operations and maintenance contracts for satellites and ground assets are sticky post‑launch, driving high retention and SLA‑driven margins with minimal upgrade capex; OHB leverages classic milk‑the‑installed‑base economics to convert installed platforms into steady EBIT streams. 2024 industry trends show recurring ops revenue increasingly underpinning supplier profitability.
- Sticky revenue: high retention on post‑launch SLAs
- Low capex: small tooling spends boost EBIT
- Predictable cash flow: classic installed‑base play
Program management and systems engineering
Program management and systems engineering at OHB are cash cows: proven PMO and systems integration expertise buyers trust, underpinning a 2024 order backlog of €1.2bn and steady mission demand rather than hyper-growth.
Codify playbooks to deliver more with less, bank the credibility and sell the certainty across civil and defense contracts.
- Trusted PMO
- €1.2bn backlog (2024)
- Steady demand
- Playbook-driven efficiency
ESA €7.1bn, backlog > €2bn, AIT > 85%
OHB cash cows: ESA long‑term contracts (ESA ~€7.1bn 2024) and mature programs deliver predictable funding and steady margins; AIT bays (>85% utilization) and subsystems yield repeatable revenue (group rev €1.38bn 2023). Backlog >€2bn and PMO backlog €1.2bn (2024) convert installed base and O&M into reliable EBIT; 2024 automation targets 10–15% cash‑flow uplift.
| Metric | Value |
|---|---|
| ESA program | €7.1bn (2024) |
| Group rev | €1.38bn (2023) |
| Backlog | >€2bn (2024) |
| PMO backlog | €1.2bn (2024) |
| AIT utilization | >85% |
| Automation uplift | 10–15% (2024) |
Preview = Final Product
OHB BCG Matrix
The file you're previewing here is the exact OHB BCG Matrix report you'll receive after purchase — no watermarks, no demo content. It's fully formatted, analysis-ready and crafted by strategy pros for clarity and impact. Once bought, the full document is delivered straight to your inbox and is immediately editable, printable, and presentation-ready. No surprises, just a plug-and-play strategic tool.

Unlock Strategic Clarity
Curious where OHB’s products land—Stars, Cash Cows, Dogs or Question Marks? This quick preview teases the shape of their portfolio, but the full BCG Matrix gives you quadrant-by-quadrant clarity, data-backed recommendations, and a practical roadmap for capital allocation. Buy the complete report for a ready-to-use Word analysis plus an editable Excel summary you can present to the board. Get instant access and stop guessing—make strategic moves with confidence.
Stars
Galileo navigation satellites
Galileo navigation satellites are a Stars asset for OHB with over 25 satellites in orbit as of 2024, reflecting high market share in the growing European GNSS program. Visible leadership comes with heavy capex, talent and schedule support obligations that keep near-term margins constrained. Continue investing to defend flight heritage and scale production capacity. If OHB holds the line, this segment can mature into durable cash flow.
Copernicus/Earth‑observation payloads
Institutional demand for Copernicus/Earth‑observation payloads is rising and OHB is a go‑to prime on key missions, supported by a multi‑billion euro EU Copernicus programme (2021–27) and over 10 Sentinel satellites in orbit as of 2024. Growth is strong but competition is active and campaign-driven development soaks up cash, with OHB Group revenue around €1.1bn in 2023 highlighting scale. Promotion relies on bid excellence and partner orchestration, not ads; sustaining current wins is critical to convert 2024 pipeline work into future annuities.
Government security and ISR satellites
Government security and ISR satellites sit in OHB’s BCG matrix as a cash-match growth star: European defense space budgets climbed sharply, with NATO Europe defense spending exceeding €320 billion in 2024, sustaining strong procurement demand for ISR capabilities.
OHB has program credibility and multiple satellites in flight, but delivery tempo needs ongoing investment; 2024 order intake patterns show revenue growth pressure on working capital and capex to keep pace.
Cash in largely equals cash out while growth runs hot, so keeping production capacity tight and prioritizing margin-preserving contracts will drive profitability as volume scales.
LEO smallsat constellations (institutional)
LEO smallsat constellations for institutional customers show rapidly expanding use cases in 2024, and OHB leverages proven modular buses plus mission know-how to secure selected tranches; share is solid there but working capital remains hungry as programs scale. Scale manufacturing and supplier reliability are critical to lock leadership, since win rate now decides tomorrow’s cash cow.
- market-trend: 2024 rapid institutional demand growth
- capability: modular buses + mission expertise
- finance: solid share on tranches, high working capital need
- strategy: scale manufacturing & supplier reliability
- priority: win rate determines future cash cow
Integrated ground segment suites
Integrated ground segment suites at OHB are a Stars category: adoption has risen with each mission award, supporting a reported 2024 group revenue of €1.12bn and an order backlog near €2.0bn, with strong installed-base pull‑through but rising feature velocity and integration draining engineering capacity.
Priority is landing multi‑mission platforms to entrench share; expect near‑term growth now and margin expansion later as platforms scale.
- Installed base: leverages recurring revenue
- Resource pressure: high R&D/integration burn
- Strategy: pursue multi‑mission platforms
- Timing: growth today, margins later
Galileo & Copernicus wins drive rapid revenue; capex strains near-term margins
Galileo, Copernicus EO, ISR and ground systems are Stars for OHB: >25 Galileo sats in orbit (2024), Copernicus pull and LEO tranche wins drive rapid revenue growth, but heavy capex and working‑capital pressure constrain near‑term margins. Group revenue ~€1.12bn (2024) with backlog ~€2.0bn; win rate and scale manufacturing decide long‑term cash conversion.
| Metric | 2024 |
|---|---|
| Galileo sats | >25 |
| Group revenue | ~€1.12bn |
| Order backlog | ~€2.0bn |
| NATO Europe defence spend | >€320bn |
What is included in the product
Detailed Word Document
In-depth OHB BCG Matrix review: identifies Stars, Cash Cows, Question Marks, Dogs with strategic recommendations to invest, hold, or divest.
Customizable Excel Spreadsheet
One-page OHB BCG Matrix that pins each unit to a quadrant, cutting decision friction for execs.
Cash Cows
Long‑term ESA framework and service contracts
Long-term ESA framework and service contracts anchor OHB with predictable funding from ESA's ~€7.1bn 2024 program, yielding mature programs and high renewal likelihood. These cash cows show low growth but steady margins, supporting operational free cash flow and a multi-year order pipeline. Focus on optimizing delivery and spotless compliance to milk reliability without over-engineering.
Satellite AIT and integration services
Satellite AIT and integration services are cash cows for OHB: established processes and repeatable revenue underpin high bay utilization (bays typically >85%), with group revenue context (~€1.38bn in 2023) validating scale. Market growth is moderate, but defendable throughput and QA discipline sustain margins; incremental automation projects in 2024 targeted 10–15% uplift in cash flow per program. Keep bays full and QA tight.
Subsystems and components supply
Subsystems and components supply
Qualified parts with heritage sell themselves; growth is modest but OHB holds strong share in chosen niches. Standardizing SKUs and improving lead times can widen margins. In 2024 OHB reported an order backlog above €2bn, letting cash flows fund the next big bet.
Operations and maintenance contracts
Operations and maintenance contracts for satellites and ground assets are sticky post‑launch, driving high retention and SLA‑driven margins with minimal upgrade capex; OHB leverages classic milk‑the‑installed‑base economics to convert installed platforms into steady EBIT streams. 2024 industry trends show recurring ops revenue increasingly underpinning supplier profitability.
- Sticky revenue: high retention on post‑launch SLAs
- Low capex: small tooling spends boost EBIT
- Predictable cash flow: classic installed‑base play
Program management and systems engineering
Program management and systems engineering at OHB are cash cows: proven PMO and systems integration expertise buyers trust, underpinning a 2024 order backlog of €1.2bn and steady mission demand rather than hyper-growth.
Codify playbooks to deliver more with less, bank the credibility and sell the certainty across civil and defense contracts.
- Trusted PMO
- €1.2bn backlog (2024)
- Steady demand
- Playbook-driven efficiency
ESA €7.1bn, backlog > €2bn, AIT > 85%
OHB cash cows: ESA long‑term contracts (ESA ~€7.1bn 2024) and mature programs deliver predictable funding and steady margins; AIT bays (>85% utilization) and subsystems yield repeatable revenue (group rev €1.38bn 2023). Backlog >€2bn and PMO backlog €1.2bn (2024) convert installed base and O&M into reliable EBIT; 2024 automation targets 10–15% cash‑flow uplift.
| Metric | Value |
|---|---|
| ESA program | €7.1bn (2024) |
| Group rev | €1.38bn (2023) |
| Backlog | >€2bn (2024) |
| PMO backlog | €1.2bn (2024) |
| AIT utilization | >85% |
| Automation uplift | 10–15% (2024) |
Preview = Final Product
OHB BCG Matrix
The file you're previewing here is the exact OHB BCG Matrix report you'll receive after purchase — no watermarks, no demo content. It's fully formatted, analysis-ready and crafted by strategy pros for clarity and impact. Once bought, the full document is delivered straight to your inbox and is immediately editable, printable, and presentation-ready. No surprises, just a plug-and-play strategic tool.
Description
Unlock Strategic Clarity
Curious where OHB’s products land—Stars, Cash Cows, Dogs or Question Marks? This quick preview teases the shape of their portfolio, but the full BCG Matrix gives you quadrant-by-quadrant clarity, data-backed recommendations, and a practical roadmap for capital allocation. Buy the complete report for a ready-to-use Word analysis plus an editable Excel summary you can present to the board. Get instant access and stop guessing—make strategic moves with confidence.
Stars
Galileo navigation satellites
Galileo navigation satellites are a Stars asset for OHB with over 25 satellites in orbit as of 2024, reflecting high market share in the growing European GNSS program. Visible leadership comes with heavy capex, talent and schedule support obligations that keep near-term margins constrained. Continue investing to defend flight heritage and scale production capacity. If OHB holds the line, this segment can mature into durable cash flow.
Copernicus/Earth‑observation payloads
Institutional demand for Copernicus/Earth‑observation payloads is rising and OHB is a go‑to prime on key missions, supported by a multi‑billion euro EU Copernicus programme (2021–27) and over 10 Sentinel satellites in orbit as of 2024. Growth is strong but competition is active and campaign-driven development soaks up cash, with OHB Group revenue around €1.1bn in 2023 highlighting scale. Promotion relies on bid excellence and partner orchestration, not ads; sustaining current wins is critical to convert 2024 pipeline work into future annuities.
Government security and ISR satellites
Government security and ISR satellites sit in OHB’s BCG matrix as a cash-match growth star: European defense space budgets climbed sharply, with NATO Europe defense spending exceeding €320 billion in 2024, sustaining strong procurement demand for ISR capabilities.
OHB has program credibility and multiple satellites in flight, but delivery tempo needs ongoing investment; 2024 order intake patterns show revenue growth pressure on working capital and capex to keep pace.
Cash in largely equals cash out while growth runs hot, so keeping production capacity tight and prioritizing margin-preserving contracts will drive profitability as volume scales.
LEO smallsat constellations (institutional)
LEO smallsat constellations for institutional customers show rapidly expanding use cases in 2024, and OHB leverages proven modular buses plus mission know-how to secure selected tranches; share is solid there but working capital remains hungry as programs scale. Scale manufacturing and supplier reliability are critical to lock leadership, since win rate now decides tomorrow’s cash cow.
- market-trend: 2024 rapid institutional demand growth
- capability: modular buses + mission expertise
- finance: solid share on tranches, high working capital need
- strategy: scale manufacturing & supplier reliability
- priority: win rate determines future cash cow
Integrated ground segment suites
Integrated ground segment suites at OHB are a Stars category: adoption has risen with each mission award, supporting a reported 2024 group revenue of €1.12bn and an order backlog near €2.0bn, with strong installed-base pull‑through but rising feature velocity and integration draining engineering capacity.
Priority is landing multi‑mission platforms to entrench share; expect near‑term growth now and margin expansion later as platforms scale.
- Installed base: leverages recurring revenue
- Resource pressure: high R&D/integration burn
- Strategy: pursue multi‑mission platforms
- Timing: growth today, margins later
Galileo & Copernicus wins drive rapid revenue; capex strains near-term margins
Galileo, Copernicus EO, ISR and ground systems are Stars for OHB: >25 Galileo sats in orbit (2024), Copernicus pull and LEO tranche wins drive rapid revenue growth, but heavy capex and working‑capital pressure constrain near‑term margins. Group revenue ~€1.12bn (2024) with backlog ~€2.0bn; win rate and scale manufacturing decide long‑term cash conversion.
| Metric | 2024 |
|---|---|
| Galileo sats | >25 |
| Group revenue | ~€1.12bn |
| Order backlog | ~€2.0bn |
| NATO Europe defence spend | >€320bn |
What is included in the product
Detailed Word Document
In-depth OHB BCG Matrix review: identifies Stars, Cash Cows, Question Marks, Dogs with strategic recommendations to invest, hold, or divest.
Customizable Excel Spreadsheet
One-page OHB BCG Matrix that pins each unit to a quadrant, cutting decision friction for execs.
Cash Cows
Long‑term ESA framework and service contracts
Long-term ESA framework and service contracts anchor OHB with predictable funding from ESA's ~€7.1bn 2024 program, yielding mature programs and high renewal likelihood. These cash cows show low growth but steady margins, supporting operational free cash flow and a multi-year order pipeline. Focus on optimizing delivery and spotless compliance to milk reliability without over-engineering.
Satellite AIT and integration services
Satellite AIT and integration services are cash cows for OHB: established processes and repeatable revenue underpin high bay utilization (bays typically >85%), with group revenue context (~€1.38bn in 2023) validating scale. Market growth is moderate, but defendable throughput and QA discipline sustain margins; incremental automation projects in 2024 targeted 10–15% uplift in cash flow per program. Keep bays full and QA tight.
Subsystems and components supply
Subsystems and components supply
Qualified parts with heritage sell themselves; growth is modest but OHB holds strong share in chosen niches. Standardizing SKUs and improving lead times can widen margins. In 2024 OHB reported an order backlog above €2bn, letting cash flows fund the next big bet.
Operations and maintenance contracts
Operations and maintenance contracts for satellites and ground assets are sticky post‑launch, driving high retention and SLA‑driven margins with minimal upgrade capex; OHB leverages classic milk‑the‑installed‑base economics to convert installed platforms into steady EBIT streams. 2024 industry trends show recurring ops revenue increasingly underpinning supplier profitability.
- Sticky revenue: high retention on post‑launch SLAs
- Low capex: small tooling spends boost EBIT
- Predictable cash flow: classic installed‑base play
Program management and systems engineering
Program management and systems engineering at OHB are cash cows: proven PMO and systems integration expertise buyers trust, underpinning a 2024 order backlog of €1.2bn and steady mission demand rather than hyper-growth.
Codify playbooks to deliver more with less, bank the credibility and sell the certainty across civil and defense contracts.
- Trusted PMO
- €1.2bn backlog (2024)
- Steady demand
- Playbook-driven efficiency
ESA €7.1bn, backlog > €2bn, AIT > 85%
OHB cash cows: ESA long‑term contracts (ESA ~€7.1bn 2024) and mature programs deliver predictable funding and steady margins; AIT bays (>85% utilization) and subsystems yield repeatable revenue (group rev €1.38bn 2023). Backlog >€2bn and PMO backlog €1.2bn (2024) convert installed base and O&M into reliable EBIT; 2024 automation targets 10–15% cash‑flow uplift.
| Metric | Value |
|---|---|
| ESA program | €7.1bn (2024) |
| Group rev | €1.38bn (2023) |
| Backlog | >€2bn (2024) |
| PMO backlog | €1.2bn (2024) |
| AIT utilization | >85% |
| Automation uplift | 10–15% (2024) |
Preview = Final Product
OHB BCG Matrix
The file you're previewing here is the exact OHB BCG Matrix report you'll receive after purchase — no watermarks, no demo content. It's fully formatted, analysis-ready and crafted by strategy pros for clarity and impact. Once bought, the full document is delivered straight to your inbox and is immediately editable, printable, and presentation-ready. No surprises, just a plug-and-play strategic tool.











