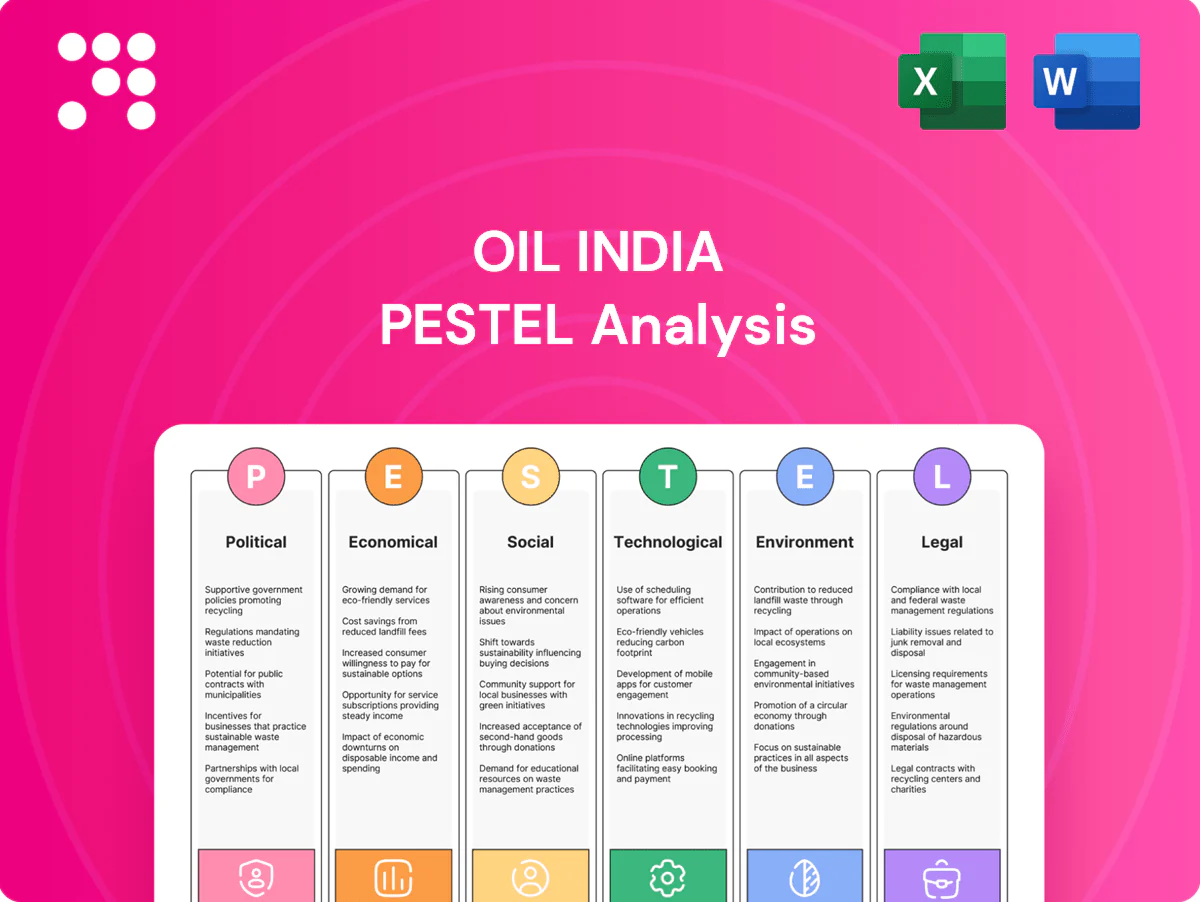
Oil India PESTLE Analysis

Skip the Research. Get the Strategy.
Discover how political shifts, economic cycles, and environmental regulations are reshaping Oil India's strategic outlook in our concise PESTLE snapshot. This analysis pinpoints risks and opportunities investors and strategists need now. Purchase the full PESTLE for detailed, actionable insights and ready-to-use charts to inform your next move.
Political factors

Navratna PSU governance
As a Navratna under MoPNG, OIL's strategic autonomy shapes capital allocation and oversight, aligning projects with policy on exploration intensity and domestic production targets amid India’s ~85% crude import dependence. Government priorities on strategic petroleum reserves (operational SPR ~5.33 MMT) and Atmanirbhar Bharat can hasten approvals and funding for upstream projects. Political transitions may shift emphasis between hydrocarbons and renewables, altering project prioritization and capital flows.
Upstream licensing regime
Under HELP (2016) and the OALP framework (2017) Oil India operates under a revenue-sharing model with marketing and pricing freedoms that materially improve block economics; single-window clearance initiatives aim to shorten approval cycle times and attract investment. Stable fiscal terms have encouraged partners to pursue riskier basins, while any reversion to more controlled regimes would likely dampen exploration appetite and capital inflows.

Windfall levies and taxes
Special Additional Excise Duty on crude is adjusted with price cycles, directly lowering Oil India netbacks; Brent's 2022–23 peak near $120/bbl triggered higher levies and visible margin pressure. Predictability of these levies is crucial for planning and near-term cashflow forecasting. Higher take during price spikes protects consumers but compresses OIL’s margins. Clear policy thresholds enable more effective hedging and capex timing decisions.

Energy transition policy push
India targets 500 GW non‑fossil capacity and 50% power capacity from non‑fossil sources by 2030; ethanol blending target 20% by 2025. National Green Hydrogen Mission (launched 2023) and CGD expansion boost incentives for biofuels, CGD and green H2, while ~85% oil import dependence in 2023 favors domestic E&P. Balancing transition with jobs in Assam and other Oil India regions remains politically sensitive.
- 500 GW non‑fossil by 2030
- 20% ethanol by 2025
- Green Hydrogen Mission launched 2023
- ~85% oil import dependence (2023)
Regional stability in Northeast
Operations in Assam and Arunachal depend on tight law-and-order coordination with state police and central forces; over 90% of Oil India’s onshore assets are concentrated there, and company reports cite operational uptime above 90% in 2024 supported by security arrangements.
Local political dynamics shape community agreements and CSR expectations—recently expanded ASHA-style outreach and IR provisions in 2024 raised social license thresholds—while cross-border geopolitics with Myanmar and Bangladesh constrain logistics and contractor mobility on key routes.
- tag:asset_concentration - over 90% onshore assets in NE
- tag:uptime_2024 - operational uptime above 90%
- tag:csr_political_risk - local politics drive CSR/agreements
- tag:cross_border - Myanmar/Bangladesh geopolitics affect logistics
Navratna under MoPNG shifts capex; India ~85% crude import dependent
Navratna under MoPNG shapes capital allocation; India ~85% crude import dependent (2023) and SPR operational ~5.33 MMT. Over 90% onshore assets in NE; operational uptime >90% in 2024 amid law‑and‑order coordination. Policy (500 GW non‑fossil by 2030, 20% ethanol by 2025, Green H2 Mission 2023) shifts capex toward renewables while protecting domestic E&P.
| tag | metric |
|---|---|
| tag:import_dep | ~85% (2023) |
| tag:spr | 5.33 MMT operational |
| tag:asset_conc | >90% onshore NE |
| tag:uptime_2024 | >90% |
What is included in the product
 Detailed Word Document
Explores how Political, Economic, Social, Technological, Environmental and Legal forces uniquely impact Oil India—backed by regional market data and regulatory trends—to reveal risks, opportunities and strategic responses; tailored for executives, investors and advisors for scenario planning and funding-ready reports.

 Customizable Excel Spreadsheet
A concise, visually segmented Oil India PESTLE summary that alleviates prep time for meetings, is editable for local context, and easily dropped into presentations or shared across teams.
Economic factors

Oil and gas price volatility
Brent swings—Brent averaged about $84/bbl in H1 2025—directly drive Oil India crude realizations, while domestic gas for legacy fields remains partly regulated with caps near $6/MMBtu. Price cycles therefore dictate cash flow, dividend capacity and exploration risk-taking; hedging and flexible capex buffer downturns, but prolonged low prices can defer marginal projects.
Forex and inflation pressures
Rupee depreciation to about 83.5 per USD (July 2025) boosts Oil India dollar-revenue but raises imported-equipment costs, squeezing margins; domestic CPI running near 5.4% (mid‑2025) pushes OPEX and project budgets higher. Supply-chain tightness has elongated lead times for critical rigs and valves, raising contingency needs. Prudent procurement practices and localization of suppliers have reduced import exposure and mitigated cost shocks.

Domestic demand growth
Rising domestic energy consumption—India's oil demand near 5.0 million barrels per day in 2024—underpins offtake for Oil India across oil, gas and LPG markets. Policy and industrial gas substitution are expanding market pull as natural gas accounted for about 6% of primary energy in 2022 with a government target of 15% by 2030. Economic slowdowns or industrial efficiency gains could temper near-term growth. Long-term price and demand elasticities will shape reserve monetization timing and pricing strategies.

Capital intensity and financing
Seismic, drilling and pipeline programs demand sustained capex and patient capital; as a central PSU, Oil India benefits from easier access to domestic debt and sovereign-backed lenders. RBI's policy rate near 6.5% (mid-2025) raises WACC and project hurdle rates, tightening viability for long-cycle E&P projects. Joint ventures are routinely used to share cost and de-risk frontier exploration, lowering single-operator exposure.
- PSU status: easier domestic debt
- RBI repo ~6.5%: higher WACC
- High capex intensity: long payback
- JVs: de-risk frontier projects
Competition and LNG parity
Imported LNG parity (JKM ~11 USD/MMBtu in 2024) caps domestic gas realizations, forcing Oil India to prioritize higher-margin contracts as CGD and power remain price-sensitive and drive sales mix decisions.
- Imported LNG ceiling ~11 USD/MMBtu (2024)
- CGD/power: price-sensitive demand
- Private E&P competition raises acreage/services costs
- Efficiency gains ~5-8% help protect margins
Navratna under MoPNG shifts capex; India ~85% crude import dependent
Brent ~84 USD/bbl (H1 2025) and JKM ~11 USD/MMBtu (2024) anchor realizations; rupee ~83.5/USD (Jul 2025) lifts dollar revenues but raises import costs, CPI ~5.4% (mid‑2025) pressures OPEX. India's oil demand ~5.0 mbpd (2024) and gas share 6% (2022) vs target 15% by 2030 support volume growth; RBI repo ~6.5% (mid‑2025) raises WACC, favoring JVs and selective capex.
| Metric | Value |
|---|---|
| Brent H1 2025 | 84 USD/bbl |
| Rupee (Jul 2025) | 83.5/USD |
| RBI repo | 6.5% |
| India oil demand 2024 | 5.0 mbpd |
| Gas share 2022 | 6% (target 15% by 2030) |
What You See Is What You Get
Oil India PESTLE Analysis
The Oil India PESTLE Analysis preview shown here is the exact document you’ll receive after purchase—fully formatted and ready to use. The layout, content, and structure visible are identical to the downloadable file. No placeholders; this is the final, professional report.

Skip the Research. Get the Strategy.
Discover how political shifts, economic cycles, and environmental regulations are reshaping Oil India's strategic outlook in our concise PESTLE snapshot. This analysis pinpoints risks and opportunities investors and strategists need now. Purchase the full PESTLE for detailed, actionable insights and ready-to-use charts to inform your next move.
Political factors
Navratna PSU governance
As a Navratna under MoPNG, OIL's strategic autonomy shapes capital allocation and oversight, aligning projects with policy on exploration intensity and domestic production targets amid India’s ~85% crude import dependence. Government priorities on strategic petroleum reserves (operational SPR ~5.33 MMT) and Atmanirbhar Bharat can hasten approvals and funding for upstream projects. Political transitions may shift emphasis between hydrocarbons and renewables, altering project prioritization and capital flows.
Upstream licensing regime
Under HELP (2016) and the OALP framework (2017) Oil India operates under a revenue-sharing model with marketing and pricing freedoms that materially improve block economics; single-window clearance initiatives aim to shorten approval cycle times and attract investment. Stable fiscal terms have encouraged partners to pursue riskier basins, while any reversion to more controlled regimes would likely dampen exploration appetite and capital inflows.
Windfall levies and taxes
Special Additional Excise Duty on crude is adjusted with price cycles, directly lowering Oil India netbacks; Brent's 2022–23 peak near $120/bbl triggered higher levies and visible margin pressure. Predictability of these levies is crucial for planning and near-term cashflow forecasting. Higher take during price spikes protects consumers but compresses OIL’s margins. Clear policy thresholds enable more effective hedging and capex timing decisions.
Energy transition policy push
India targets 500 GW non‑fossil capacity and 50% power capacity from non‑fossil sources by 2030; ethanol blending target 20% by 2025. National Green Hydrogen Mission (launched 2023) and CGD expansion boost incentives for biofuels, CGD and green H2, while ~85% oil import dependence in 2023 favors domestic E&P. Balancing transition with jobs in Assam and other Oil India regions remains politically sensitive.
- 500 GW non‑fossil by 2030
- 20% ethanol by 2025
- Green Hydrogen Mission launched 2023
- ~85% oil import dependence (2023)
Regional stability in Northeast
Operations in Assam and Arunachal depend on tight law-and-order coordination with state police and central forces; over 90% of Oil India’s onshore assets are concentrated there, and company reports cite operational uptime above 90% in 2024 supported by security arrangements.
Local political dynamics shape community agreements and CSR expectations—recently expanded ASHA-style outreach and IR provisions in 2024 raised social license thresholds—while cross-border geopolitics with Myanmar and Bangladesh constrain logistics and contractor mobility on key routes.
- tag:asset_concentration - over 90% onshore assets in NE
- tag:uptime_2024 - operational uptime above 90%
- tag:csr_political_risk - local politics drive CSR/agreements
- tag:cross_border - Myanmar/Bangladesh geopolitics affect logistics
Navratna under MoPNG shifts capex; India ~85% crude import dependent
Navratna under MoPNG shapes capital allocation; India ~85% crude import dependent (2023) and SPR operational ~5.33 MMT. Over 90% onshore assets in NE; operational uptime >90% in 2024 amid law‑and‑order coordination. Policy (500 GW non‑fossil by 2030, 20% ethanol by 2025, Green H2 Mission 2023) shifts capex toward renewables while protecting domestic E&P.
| tag | metric |
|---|---|
| tag:import_dep | ~85% (2023) |
| tag:spr | 5.33 MMT operational |
| tag:asset_conc | >90% onshore NE |
| tag:uptime_2024 | >90% |
What is included in the product
Detailed Word Document
Explores how Political, Economic, Social, Technological, Environmental and Legal forces uniquely impact Oil India—backed by regional market data and regulatory trends—to reveal risks, opportunities and strategic responses; tailored for executives, investors and advisors for scenario planning and funding-ready reports.
Customizable Excel Spreadsheet
A concise, visually segmented Oil India PESTLE summary that alleviates prep time for meetings, is editable for local context, and easily dropped into presentations or shared across teams.
Economic factors
Oil and gas price volatility
Brent swings—Brent averaged about $84/bbl in H1 2025—directly drive Oil India crude realizations, while domestic gas for legacy fields remains partly regulated with caps near $6/MMBtu. Price cycles therefore dictate cash flow, dividend capacity and exploration risk-taking; hedging and flexible capex buffer downturns, but prolonged low prices can defer marginal projects.
Forex and inflation pressures
Rupee depreciation to about 83.5 per USD (July 2025) boosts Oil India dollar-revenue but raises imported-equipment costs, squeezing margins; domestic CPI running near 5.4% (mid‑2025) pushes OPEX and project budgets higher. Supply-chain tightness has elongated lead times for critical rigs and valves, raising contingency needs. Prudent procurement practices and localization of suppliers have reduced import exposure and mitigated cost shocks.
Domestic demand growth
Rising domestic energy consumption—India's oil demand near 5.0 million barrels per day in 2024—underpins offtake for Oil India across oil, gas and LPG markets. Policy and industrial gas substitution are expanding market pull as natural gas accounted for about 6% of primary energy in 2022 with a government target of 15% by 2030. Economic slowdowns or industrial efficiency gains could temper near-term growth. Long-term price and demand elasticities will shape reserve monetization timing and pricing strategies.
Capital intensity and financing
Seismic, drilling and pipeline programs demand sustained capex and patient capital; as a central PSU, Oil India benefits from easier access to domestic debt and sovereign-backed lenders. RBI's policy rate near 6.5% (mid-2025) raises WACC and project hurdle rates, tightening viability for long-cycle E&P projects. Joint ventures are routinely used to share cost and de-risk frontier exploration, lowering single-operator exposure.
- PSU status: easier domestic debt
- RBI repo ~6.5%: higher WACC
- High capex intensity: long payback
- JVs: de-risk frontier projects
Competition and LNG parity
Imported LNG parity (JKM ~11 USD/MMBtu in 2024) caps domestic gas realizations, forcing Oil India to prioritize higher-margin contracts as CGD and power remain price-sensitive and drive sales mix decisions.
- Imported LNG ceiling ~11 USD/MMBtu (2024)
- CGD/power: price-sensitive demand
- Private E&P competition raises acreage/services costs
- Efficiency gains ~5-8% help protect margins
Navratna under MoPNG shifts capex; India ~85% crude import dependent
Brent ~84 USD/bbl (H1 2025) and JKM ~11 USD/MMBtu (2024) anchor realizations; rupee ~83.5/USD (Jul 2025) lifts dollar revenues but raises import costs, CPI ~5.4% (mid‑2025) pressures OPEX. India's oil demand ~5.0 mbpd (2024) and gas share 6% (2022) vs target 15% by 2030 support volume growth; RBI repo ~6.5% (mid‑2025) raises WACC, favoring JVs and selective capex.
| Metric | Value |
|---|---|
| Brent H1 2025 | 84 USD/bbl |
| Rupee (Jul 2025) | 83.5/USD |
| RBI repo | 6.5% |
| India oil demand 2024 | 5.0 mbpd |
| Gas share 2022 | 6% (target 15% by 2030) |
What You See Is What You Get
Oil India PESTLE Analysis
The Oil India PESTLE Analysis preview shown here is the exact document you’ll receive after purchase—fully formatted and ready to use. The layout, content, and structure visible are identical to the downloadable file. No placeholders; this is the final, professional report.
Original: $10.00
-65%$10.00
$3.50Description
Skip the Research. Get the Strategy.
Discover how political shifts, economic cycles, and environmental regulations are reshaping Oil India's strategic outlook in our concise PESTLE snapshot. This analysis pinpoints risks and opportunities investors and strategists need now. Purchase the full PESTLE for detailed, actionable insights and ready-to-use charts to inform your next move.
Political factors
Navratna PSU governance
As a Navratna under MoPNG, OIL's strategic autonomy shapes capital allocation and oversight, aligning projects with policy on exploration intensity and domestic production targets amid India’s ~85% crude import dependence. Government priorities on strategic petroleum reserves (operational SPR ~5.33 MMT) and Atmanirbhar Bharat can hasten approvals and funding for upstream projects. Political transitions may shift emphasis between hydrocarbons and renewables, altering project prioritization and capital flows.
Upstream licensing regime
Under HELP (2016) and the OALP framework (2017) Oil India operates under a revenue-sharing model with marketing and pricing freedoms that materially improve block economics; single-window clearance initiatives aim to shorten approval cycle times and attract investment. Stable fiscal terms have encouraged partners to pursue riskier basins, while any reversion to more controlled regimes would likely dampen exploration appetite and capital inflows.
Windfall levies and taxes
Special Additional Excise Duty on crude is adjusted with price cycles, directly lowering Oil India netbacks; Brent's 2022–23 peak near $120/bbl triggered higher levies and visible margin pressure. Predictability of these levies is crucial for planning and near-term cashflow forecasting. Higher take during price spikes protects consumers but compresses OIL’s margins. Clear policy thresholds enable more effective hedging and capex timing decisions.
Energy transition policy push
India targets 500 GW non‑fossil capacity and 50% power capacity from non‑fossil sources by 2030; ethanol blending target 20% by 2025. National Green Hydrogen Mission (launched 2023) and CGD expansion boost incentives for biofuels, CGD and green H2, while ~85% oil import dependence in 2023 favors domestic E&P. Balancing transition with jobs in Assam and other Oil India regions remains politically sensitive.
- 500 GW non‑fossil by 2030
- 20% ethanol by 2025
- Green Hydrogen Mission launched 2023
- ~85% oil import dependence (2023)
Regional stability in Northeast
Operations in Assam and Arunachal depend on tight law-and-order coordination with state police and central forces; over 90% of Oil India’s onshore assets are concentrated there, and company reports cite operational uptime above 90% in 2024 supported by security arrangements.
Local political dynamics shape community agreements and CSR expectations—recently expanded ASHA-style outreach and IR provisions in 2024 raised social license thresholds—while cross-border geopolitics with Myanmar and Bangladesh constrain logistics and contractor mobility on key routes.
- tag:asset_concentration - over 90% onshore assets in NE
- tag:uptime_2024 - operational uptime above 90%
- tag:csr_political_risk - local politics drive CSR/agreements
- tag:cross_border - Myanmar/Bangladesh geopolitics affect logistics
Navratna under MoPNG shifts capex; India ~85% crude import dependent
Navratna under MoPNG shapes capital allocation; India ~85% crude import dependent (2023) and SPR operational ~5.33 MMT. Over 90% onshore assets in NE; operational uptime >90% in 2024 amid law‑and‑order coordination. Policy (500 GW non‑fossil by 2030, 20% ethanol by 2025, Green H2 Mission 2023) shifts capex toward renewables while protecting domestic E&P.
| tag | metric |
|---|---|
| tag:import_dep | ~85% (2023) |
| tag:spr | 5.33 MMT operational |
| tag:asset_conc | >90% onshore NE |
| tag:uptime_2024 | >90% |
What is included in the product
Detailed Word Document
Explores how Political, Economic, Social, Technological, Environmental and Legal forces uniquely impact Oil India—backed by regional market data and regulatory trends—to reveal risks, opportunities and strategic responses; tailored for executives, investors and advisors for scenario planning and funding-ready reports.
Customizable Excel Spreadsheet
A concise, visually segmented Oil India PESTLE summary that alleviates prep time for meetings, is editable for local context, and easily dropped into presentations or shared across teams.
Economic factors
Oil and gas price volatility
Brent swings—Brent averaged about $84/bbl in H1 2025—directly drive Oil India crude realizations, while domestic gas for legacy fields remains partly regulated with caps near $6/MMBtu. Price cycles therefore dictate cash flow, dividend capacity and exploration risk-taking; hedging and flexible capex buffer downturns, but prolonged low prices can defer marginal projects.
Forex and inflation pressures
Rupee depreciation to about 83.5 per USD (July 2025) boosts Oil India dollar-revenue but raises imported-equipment costs, squeezing margins; domestic CPI running near 5.4% (mid‑2025) pushes OPEX and project budgets higher. Supply-chain tightness has elongated lead times for critical rigs and valves, raising contingency needs. Prudent procurement practices and localization of suppliers have reduced import exposure and mitigated cost shocks.
Domestic demand growth
Rising domestic energy consumption—India's oil demand near 5.0 million barrels per day in 2024—underpins offtake for Oil India across oil, gas and LPG markets. Policy and industrial gas substitution are expanding market pull as natural gas accounted for about 6% of primary energy in 2022 with a government target of 15% by 2030. Economic slowdowns or industrial efficiency gains could temper near-term growth. Long-term price and demand elasticities will shape reserve monetization timing and pricing strategies.
Capital intensity and financing
Seismic, drilling and pipeline programs demand sustained capex and patient capital; as a central PSU, Oil India benefits from easier access to domestic debt and sovereign-backed lenders. RBI's policy rate near 6.5% (mid-2025) raises WACC and project hurdle rates, tightening viability for long-cycle E&P projects. Joint ventures are routinely used to share cost and de-risk frontier exploration, lowering single-operator exposure.
- PSU status: easier domestic debt
- RBI repo ~6.5%: higher WACC
- High capex intensity: long payback
- JVs: de-risk frontier projects
Competition and LNG parity
Imported LNG parity (JKM ~11 USD/MMBtu in 2024) caps domestic gas realizations, forcing Oil India to prioritize higher-margin contracts as CGD and power remain price-sensitive and drive sales mix decisions.
- Imported LNG ceiling ~11 USD/MMBtu (2024)
- CGD/power: price-sensitive demand
- Private E&P competition raises acreage/services costs
- Efficiency gains ~5-8% help protect margins
Navratna under MoPNG shifts capex; India ~85% crude import dependent
Brent ~84 USD/bbl (H1 2025) and JKM ~11 USD/MMBtu (2024) anchor realizations; rupee ~83.5/USD (Jul 2025) lifts dollar revenues but raises import costs, CPI ~5.4% (mid‑2025) pressures OPEX. India's oil demand ~5.0 mbpd (2024) and gas share 6% (2022) vs target 15% by 2030 support volume growth; RBI repo ~6.5% (mid‑2025) raises WACC, favoring JVs and selective capex.
| Metric | Value |
|---|---|
| Brent H1 2025 | 84 USD/bbl |
| Rupee (Jul 2025) | 83.5/USD |
| RBI repo | 6.5% |
| India oil demand 2024 | 5.0 mbpd |
| Gas share 2022 | 6% (target 15% by 2030) |
What You See Is What You Get
Oil India PESTLE Analysis
The Oil India PESTLE Analysis preview shown here is the exact document you’ll receive after purchase—fully formatted and ready to use. The layout, content, and structure visible are identical to the downloadable file. No placeholders; this is the final, professional report.











