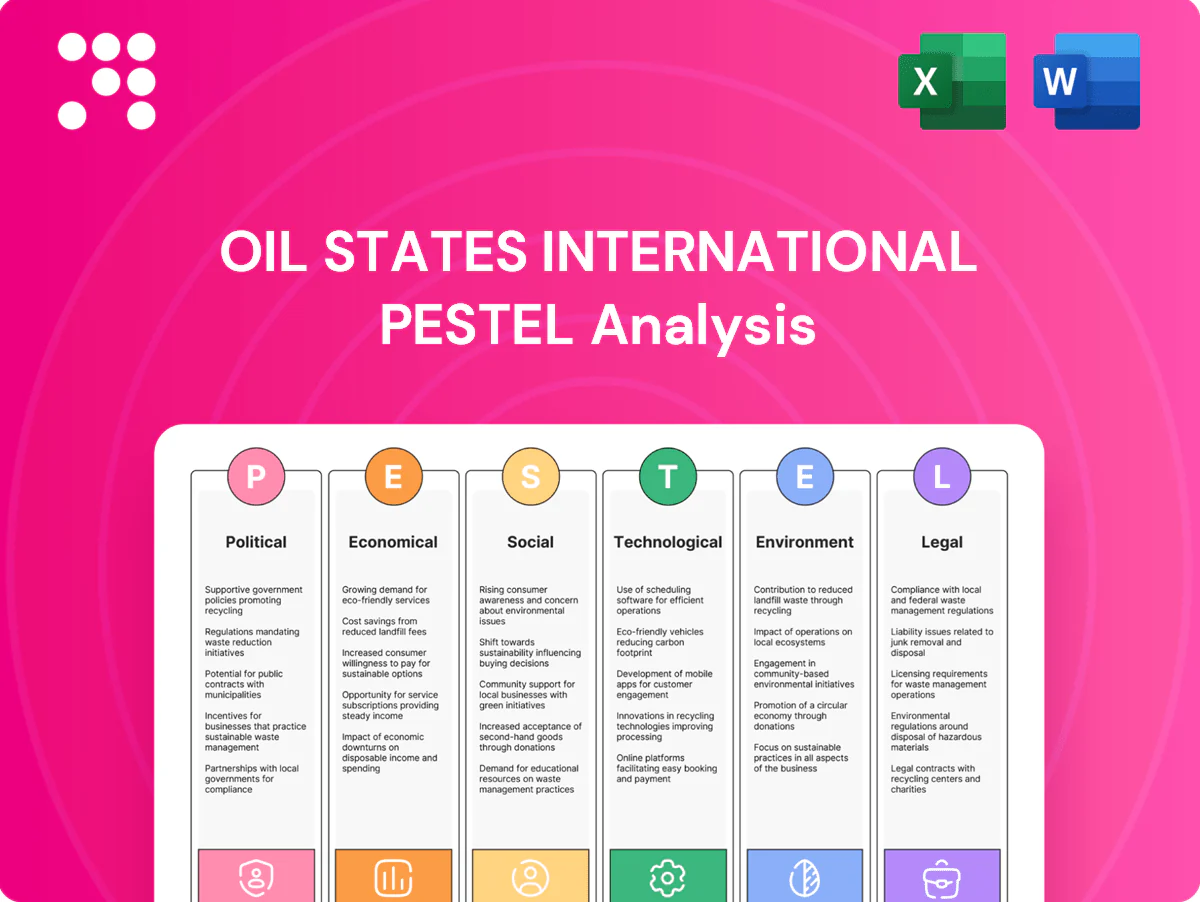
Oil States International PESTLE Analysis

Skip the Research. Get the Strategy.
Discover how political shifts, oil price cycles, and technological advances are shaping Oil States International’s strategic outlook in our concise PESTLE snapshot. This expert analysis highlights regulatory risks, market opportunities, and ESG pressures investors and managers must monitor. Purchase the full PESTLE for a detailed, actionable report ready for strategy, due diligence, or investment use.
Political factors

Geopolitical risk exposure
Operating across offshore and land basins ties Oil States to geopolitics, with 2024 sanctions and regional instability in the Middle East, West Africa and parts of the Americas causing project delays and parts bottlenecks. Conflicts and embargoes have pushed insurance and logistics premiums higher, increasing project timelines and working capital needs. Oil States must diversify markets and build contingency sourcing and scenario plans focused on those basins.
Energy security and policy shifts
Governments prioritizing energy security (US crude production ~13.1 mb/d in 2024 per EIA) can speed drilling permits, offshore leasing and defense procurement, boosting demand for Oil States' drilling and subsea services. Policy pivots to low-carbon and IRAsized incentives (Inflation Reduction Act ~369 billion USD energy provisions) can slow hydrocarbon approvals while expanding decommissioning and CCUS work. Aligning offerings to policy cycles and public investment programs across the US, UK/North Sea, Brazil (≈2.9 mb/d) and GCC is critical for revenue visibility.

Trade tariffs and localization
Tariffs such as the U.S. 25% steel duties and similar levies on specialty alloys and electronics materially raise input costs for manufactured oilfield products. Local content rules—Petrobras historically required up to 60% local content in Brazil, and comparable mandates exist across West Africa and parts of the Middle East—reshape sourcing, hiring and fabrication footprints. Oil States may need joint ventures, local assembly or licensing to qualify. Early strategic supply localization can become a durable competitive advantage.

Defense and government contracting
Exposure to military sectors ties portions of Oil States International revenue to volatile US and allied defense budget cycles; US defense spending exceeded $800 billion in 2024, influencing procurement priorities. Shifts in defense spending or export approvals can swing backlog and margins, while compliance-heavy government contracts demand robust controls and audit readiness. Building long-term framework agreements helps stabilize utilization and revenue visibility.
- Budget sensitivity: US defense >$800B (2024)
- Backlog/margin risk from spending shifts
- High compliance/audit burden
- Frameworks improve utilization stability
International standards and multilateral regimes
Adoption of IMO rules (IMO 2020 0.5% sulphur cap) and IOGP technical standards shapes design and certification for offshore equipment, while multilateral climate and methane commitments (Global Methane Pledge: 150+ signatories) push tighter national regs; Oil States must track evolving standards to retain market access, and early compliance can differentiate on safety and performance.
- Regulatory drivers: IMO 2020, IOGP guidance
- Climate pressure: 150+ methane pledge signatories
- Strategic action: early compliance = market differentiation
Geopolitics, sanctions and energy policy reshape costs and opportunities in oil, defense and CCUS
Geopolitical risk, 2024 sanctions and regional instability raise delays and insurance costs; US crude ~13.1 mb/d (2024) and Brazil ~2.9 mb/d shape regional demand; US defense >800B (2024) ties revenue to budgets; Inflation Reduction Act ~369B shifts opportunities to decommissioning/CCUS.
| Factor | 2024/25 |
|---|---|
| US crude | 13.1 mb/d |
| Brazil | 2.9 mb/d |
| US defense | >$800B |
| IRA | $369B |
What is included in the product
 Detailed Word Document
Explores how Political, Economic, Social, Technological, Environmental and Legal forces uniquely affect Oil States International, with each section backed by relevant data and current trends to identify risks and opportunities. Designed for executives and investors, it delivers forward-looking insights ready for decks and planning.

 Customizable Excel Spreadsheet
A concise, shareable PESTLE summary for Oil States International that’s visually segmented, editable by region or business line, and easily dropped into presentations—helping teams quickly align on external risks, market positioning, and strategic responses.
Economic factors

Commodity price cyclicality
Commodity cyclicality remains central: Brent averaged about $86/bbl in 2024 and was near $78/bbl mid-2025, and such swings directly drive customer capex/opex across rigs, subsea and products. Offshore FIDs are multi-year and lag price rallies, while well-site services adjust within quarters. Oil States must balance segment exposure to smooth utilization and keep flexible cost structures and variable capacity to weather ±30% price cycles.
Interest rates and capital access
Higher U.S. policy rates (Fed funds 5.25–5.50% in mid‑2025) and 10‑yr Treasury yields around 4.2% lift WACC for oil operators, delaying capex and pressuring suppliers like Oil States. Elevated rates raise financing, working capital and inventory carrying costs, making strong liquidity and disciplined capex essential. Late‑cycle customer credit risk increases, warranting tighter payment terms and stricter credit checks.

Supply chain inflation and logistics
Steel, elastomers, electronics and freight cost inflation can compress margins on Oil States Internationals fixed-price orders, with global container rates still roughly 2–3x 2019 levels after 2022 peaks (Drewry/UNCTAD 2024). Lead-time variability has extended project delivery and shifted revenue timing by months. Strategic sourcing, commodity hedging and design-to-cost programs have reduced input volatility. Nearshoring and dual-sourcing lower disruption risk.

Customer consolidation and pricing power
Supermajors and large service companies negotiate aggressively, squeezing margins and shaping frame agreements; consolidation of buyers simplifies tendering but raises pressure on total cost of ownership. Differentiated technology and life-cycle services enable premium capture and resilient margins, while performance-based contracts align incentives and can protect unit economics amid competitive bidding. Industry revenue hovered near USD 110 billion in 2024, concentrating buying power.
- Buyer concentration: higher negotiation leverage
- Consolidation: simpler tenders, tougher price competition
- Tech & life-cycle services: route to premiums
- Performance contracts: margin alignment and risk sharing
Currency volatility
Currency volatility in Oil States International operations creates material FX exposure across revenues and inputs as the firm serves global oilfield markets; the US dollar strengthened notably versus many currencies in 2021–2023 (roughly a 10% rise on the trade-weighted index), which can dampen local demand while reducing dollar-priced input costs. Natural hedging from local sales versus local costs and selective financial hedges limit earnings swings, while index-linked pricing clauses (eg, CPI or oil-price indices) help stabilize project economics.
- FX exposure: global revenues vs costs
- USD strength ~10% (trade-weighted 2021–2023)
- Mitigation: natural hedges + selective derivatives
- Stabilizer: index-linked pricing clauses
Geopolitics, sanctions and energy policy reshape costs and opportunities in oil, defense and CCUS
Commodity swings (Brent $86/bbl 2024 avg, ~$78 mid‑2025) drive capex and utilization; higher rates (Fed funds 5.25–5.50%, 10y ~4.2%) raise WACC and working‑capital costs; input inflation (steel/elastomers, container rates ~2–3x 2019) compresses margins; buyer consolidation (industry ~$110B 2024) increases pricing pressure while tech/services enable premium capture.
| Metric | Value |
|---|---|
| Brent 2024 avg / mid‑2025 | $86 / ~$78/bbl |
| Fed funds / 10‑yr | 5.25–5.50% / ~4.2% |
| Industry revenue 2024 | ~$110B |
| USD TWI (2021–23) | ~+10% |
| Container rates vs 2019 | ~2–3x |
Full Version Awaits
Oil States International PESTLE Analysis
The Oil States International PESTLE Analysis preview shown here is the exact document you’ll receive after purchase—fully formatted and ready to use. The layout, content, and structure visible are identical to the downloadable file. No placeholders or teasers—this is the real, final report you’ll own upon checkout.

Skip the Research. Get the Strategy.
Discover how political shifts, oil price cycles, and technological advances are shaping Oil States International’s strategic outlook in our concise PESTLE snapshot. This expert analysis highlights regulatory risks, market opportunities, and ESG pressures investors and managers must monitor. Purchase the full PESTLE for a detailed, actionable report ready for strategy, due diligence, or investment use.
Political factors
Geopolitical risk exposure
Operating across offshore and land basins ties Oil States to geopolitics, with 2024 sanctions and regional instability in the Middle East, West Africa and parts of the Americas causing project delays and parts bottlenecks. Conflicts and embargoes have pushed insurance and logistics premiums higher, increasing project timelines and working capital needs. Oil States must diversify markets and build contingency sourcing and scenario plans focused on those basins.
Energy security and policy shifts
Governments prioritizing energy security (US crude production ~13.1 mb/d in 2024 per EIA) can speed drilling permits, offshore leasing and defense procurement, boosting demand for Oil States' drilling and subsea services. Policy pivots to low-carbon and IRAsized incentives (Inflation Reduction Act ~369 billion USD energy provisions) can slow hydrocarbon approvals while expanding decommissioning and CCUS work. Aligning offerings to policy cycles and public investment programs across the US, UK/North Sea, Brazil (≈2.9 mb/d) and GCC is critical for revenue visibility.
Trade tariffs and localization
Tariffs such as the U.S. 25% steel duties and similar levies on specialty alloys and electronics materially raise input costs for manufactured oilfield products. Local content rules—Petrobras historically required up to 60% local content in Brazil, and comparable mandates exist across West Africa and parts of the Middle East—reshape sourcing, hiring and fabrication footprints. Oil States may need joint ventures, local assembly or licensing to qualify. Early strategic supply localization can become a durable competitive advantage.
Defense and government contracting
Exposure to military sectors ties portions of Oil States International revenue to volatile US and allied defense budget cycles; US defense spending exceeded $800 billion in 2024, influencing procurement priorities. Shifts in defense spending or export approvals can swing backlog and margins, while compliance-heavy government contracts demand robust controls and audit readiness. Building long-term framework agreements helps stabilize utilization and revenue visibility.
- Budget sensitivity: US defense >$800B (2024)
- Backlog/margin risk from spending shifts
- High compliance/audit burden
- Frameworks improve utilization stability
International standards and multilateral regimes
Adoption of IMO rules (IMO 2020 0.5% sulphur cap) and IOGP technical standards shapes design and certification for offshore equipment, while multilateral climate and methane commitments (Global Methane Pledge: 150+ signatories) push tighter national regs; Oil States must track evolving standards to retain market access, and early compliance can differentiate on safety and performance.
- Regulatory drivers: IMO 2020, IOGP guidance
- Climate pressure: 150+ methane pledge signatories
- Strategic action: early compliance = market differentiation
Geopolitics, sanctions and energy policy reshape costs and opportunities in oil, defense and CCUS
Geopolitical risk, 2024 sanctions and regional instability raise delays and insurance costs; US crude ~13.1 mb/d (2024) and Brazil ~2.9 mb/d shape regional demand; US defense >800B (2024) ties revenue to budgets; Inflation Reduction Act ~369B shifts opportunities to decommissioning/CCUS.
| Factor | 2024/25 |
|---|---|
| US crude | 13.1 mb/d |
| Brazil | 2.9 mb/d |
| US defense | >$800B |
| IRA | $369B |
What is included in the product
Detailed Word Document
Explores how Political, Economic, Social, Technological, Environmental and Legal forces uniquely affect Oil States International, with each section backed by relevant data and current trends to identify risks and opportunities. Designed for executives and investors, it delivers forward-looking insights ready for decks and planning.
Customizable Excel Spreadsheet
A concise, shareable PESTLE summary for Oil States International that’s visually segmented, editable by region or business line, and easily dropped into presentations—helping teams quickly align on external risks, market positioning, and strategic responses.
Economic factors
Commodity price cyclicality
Commodity cyclicality remains central: Brent averaged about $86/bbl in 2024 and was near $78/bbl mid-2025, and such swings directly drive customer capex/opex across rigs, subsea and products. Offshore FIDs are multi-year and lag price rallies, while well-site services adjust within quarters. Oil States must balance segment exposure to smooth utilization and keep flexible cost structures and variable capacity to weather ±30% price cycles.
Interest rates and capital access
Higher U.S. policy rates (Fed funds 5.25–5.50% in mid‑2025) and 10‑yr Treasury yields around 4.2% lift WACC for oil operators, delaying capex and pressuring suppliers like Oil States. Elevated rates raise financing, working capital and inventory carrying costs, making strong liquidity and disciplined capex essential. Late‑cycle customer credit risk increases, warranting tighter payment terms and stricter credit checks.
Supply chain inflation and logistics
Steel, elastomers, electronics and freight cost inflation can compress margins on Oil States Internationals fixed-price orders, with global container rates still roughly 2–3x 2019 levels after 2022 peaks (Drewry/UNCTAD 2024). Lead-time variability has extended project delivery and shifted revenue timing by months. Strategic sourcing, commodity hedging and design-to-cost programs have reduced input volatility. Nearshoring and dual-sourcing lower disruption risk.
Customer consolidation and pricing power
Supermajors and large service companies negotiate aggressively, squeezing margins and shaping frame agreements; consolidation of buyers simplifies tendering but raises pressure on total cost of ownership. Differentiated technology and life-cycle services enable premium capture and resilient margins, while performance-based contracts align incentives and can protect unit economics amid competitive bidding. Industry revenue hovered near USD 110 billion in 2024, concentrating buying power.
- Buyer concentration: higher negotiation leverage
- Consolidation: simpler tenders, tougher price competition
- Tech & life-cycle services: route to premiums
- Performance contracts: margin alignment and risk sharing
Currency volatility
Currency volatility in Oil States International operations creates material FX exposure across revenues and inputs as the firm serves global oilfield markets; the US dollar strengthened notably versus many currencies in 2021–2023 (roughly a 10% rise on the trade-weighted index), which can dampen local demand while reducing dollar-priced input costs. Natural hedging from local sales versus local costs and selective financial hedges limit earnings swings, while index-linked pricing clauses (eg, CPI or oil-price indices) help stabilize project economics.
- FX exposure: global revenues vs costs
- USD strength ~10% (trade-weighted 2021–2023)
- Mitigation: natural hedges + selective derivatives
- Stabilizer: index-linked pricing clauses
Geopolitics, sanctions and energy policy reshape costs and opportunities in oil, defense and CCUS
Commodity swings (Brent $86/bbl 2024 avg, ~$78 mid‑2025) drive capex and utilization; higher rates (Fed funds 5.25–5.50%, 10y ~4.2%) raise WACC and working‑capital costs; input inflation (steel/elastomers, container rates ~2–3x 2019) compresses margins; buyer consolidation (industry ~$110B 2024) increases pricing pressure while tech/services enable premium capture.
| Metric | Value |
|---|---|
| Brent 2024 avg / mid‑2025 | $86 / ~$78/bbl |
| Fed funds / 10‑yr | 5.25–5.50% / ~4.2% |
| Industry revenue 2024 | ~$110B |
| USD TWI (2021–23) | ~+10% |
| Container rates vs 2019 | ~2–3x |
Full Version Awaits
Oil States International PESTLE Analysis
The Oil States International PESTLE Analysis preview shown here is the exact document you’ll receive after purchase—fully formatted and ready to use. The layout, content, and structure visible are identical to the downloadable file. No placeholders or teasers—this is the real, final report you’ll own upon checkout.
Description
Skip the Research. Get the Strategy.
Discover how political shifts, oil price cycles, and technological advances are shaping Oil States International’s strategic outlook in our concise PESTLE snapshot. This expert analysis highlights regulatory risks, market opportunities, and ESG pressures investors and managers must monitor. Purchase the full PESTLE for a detailed, actionable report ready for strategy, due diligence, or investment use.
Political factors
Geopolitical risk exposure
Operating across offshore and land basins ties Oil States to geopolitics, with 2024 sanctions and regional instability in the Middle East, West Africa and parts of the Americas causing project delays and parts bottlenecks. Conflicts and embargoes have pushed insurance and logistics premiums higher, increasing project timelines and working capital needs. Oil States must diversify markets and build contingency sourcing and scenario plans focused on those basins.
Energy security and policy shifts
Governments prioritizing energy security (US crude production ~13.1 mb/d in 2024 per EIA) can speed drilling permits, offshore leasing and defense procurement, boosting demand for Oil States' drilling and subsea services. Policy pivots to low-carbon and IRAsized incentives (Inflation Reduction Act ~369 billion USD energy provisions) can slow hydrocarbon approvals while expanding decommissioning and CCUS work. Aligning offerings to policy cycles and public investment programs across the US, UK/North Sea, Brazil (≈2.9 mb/d) and GCC is critical for revenue visibility.
Trade tariffs and localization
Tariffs such as the U.S. 25% steel duties and similar levies on specialty alloys and electronics materially raise input costs for manufactured oilfield products. Local content rules—Petrobras historically required up to 60% local content in Brazil, and comparable mandates exist across West Africa and parts of the Middle East—reshape sourcing, hiring and fabrication footprints. Oil States may need joint ventures, local assembly or licensing to qualify. Early strategic supply localization can become a durable competitive advantage.
Defense and government contracting
Exposure to military sectors ties portions of Oil States International revenue to volatile US and allied defense budget cycles; US defense spending exceeded $800 billion in 2024, influencing procurement priorities. Shifts in defense spending or export approvals can swing backlog and margins, while compliance-heavy government contracts demand robust controls and audit readiness. Building long-term framework agreements helps stabilize utilization and revenue visibility.
- Budget sensitivity: US defense >$800B (2024)
- Backlog/margin risk from spending shifts
- High compliance/audit burden
- Frameworks improve utilization stability
International standards and multilateral regimes
Adoption of IMO rules (IMO 2020 0.5% sulphur cap) and IOGP technical standards shapes design and certification for offshore equipment, while multilateral climate and methane commitments (Global Methane Pledge: 150+ signatories) push tighter national regs; Oil States must track evolving standards to retain market access, and early compliance can differentiate on safety and performance.
- Regulatory drivers: IMO 2020, IOGP guidance
- Climate pressure: 150+ methane pledge signatories
- Strategic action: early compliance = market differentiation
Geopolitics, sanctions and energy policy reshape costs and opportunities in oil, defense and CCUS
Geopolitical risk, 2024 sanctions and regional instability raise delays and insurance costs; US crude ~13.1 mb/d (2024) and Brazil ~2.9 mb/d shape regional demand; US defense >800B (2024) ties revenue to budgets; Inflation Reduction Act ~369B shifts opportunities to decommissioning/CCUS.
| Factor | 2024/25 |
|---|---|
| US crude | 13.1 mb/d |
| Brazil | 2.9 mb/d |
| US defense | >$800B |
| IRA | $369B |
What is included in the product
Detailed Word Document
Explores how Political, Economic, Social, Technological, Environmental and Legal forces uniquely affect Oil States International, with each section backed by relevant data and current trends to identify risks and opportunities. Designed for executives and investors, it delivers forward-looking insights ready for decks and planning.
Customizable Excel Spreadsheet
A concise, shareable PESTLE summary for Oil States International that’s visually segmented, editable by region or business line, and easily dropped into presentations—helping teams quickly align on external risks, market positioning, and strategic responses.
Economic factors
Commodity price cyclicality
Commodity cyclicality remains central: Brent averaged about $86/bbl in 2024 and was near $78/bbl mid-2025, and such swings directly drive customer capex/opex across rigs, subsea and products. Offshore FIDs are multi-year and lag price rallies, while well-site services adjust within quarters. Oil States must balance segment exposure to smooth utilization and keep flexible cost structures and variable capacity to weather ±30% price cycles.
Interest rates and capital access
Higher U.S. policy rates (Fed funds 5.25–5.50% in mid‑2025) and 10‑yr Treasury yields around 4.2% lift WACC for oil operators, delaying capex and pressuring suppliers like Oil States. Elevated rates raise financing, working capital and inventory carrying costs, making strong liquidity and disciplined capex essential. Late‑cycle customer credit risk increases, warranting tighter payment terms and stricter credit checks.
Supply chain inflation and logistics
Steel, elastomers, electronics and freight cost inflation can compress margins on Oil States Internationals fixed-price orders, with global container rates still roughly 2–3x 2019 levels after 2022 peaks (Drewry/UNCTAD 2024). Lead-time variability has extended project delivery and shifted revenue timing by months. Strategic sourcing, commodity hedging and design-to-cost programs have reduced input volatility. Nearshoring and dual-sourcing lower disruption risk.
Customer consolidation and pricing power
Supermajors and large service companies negotiate aggressively, squeezing margins and shaping frame agreements; consolidation of buyers simplifies tendering but raises pressure on total cost of ownership. Differentiated technology and life-cycle services enable premium capture and resilient margins, while performance-based contracts align incentives and can protect unit economics amid competitive bidding. Industry revenue hovered near USD 110 billion in 2024, concentrating buying power.
- Buyer concentration: higher negotiation leverage
- Consolidation: simpler tenders, tougher price competition
- Tech & life-cycle services: route to premiums
- Performance contracts: margin alignment and risk sharing
Currency volatility
Currency volatility in Oil States International operations creates material FX exposure across revenues and inputs as the firm serves global oilfield markets; the US dollar strengthened notably versus many currencies in 2021–2023 (roughly a 10% rise on the trade-weighted index), which can dampen local demand while reducing dollar-priced input costs. Natural hedging from local sales versus local costs and selective financial hedges limit earnings swings, while index-linked pricing clauses (eg, CPI or oil-price indices) help stabilize project economics.
- FX exposure: global revenues vs costs
- USD strength ~10% (trade-weighted 2021–2023)
- Mitigation: natural hedges + selective derivatives
- Stabilizer: index-linked pricing clauses
Geopolitics, sanctions and energy policy reshape costs and opportunities in oil, defense and CCUS
Commodity swings (Brent $86/bbl 2024 avg, ~$78 mid‑2025) drive capex and utilization; higher rates (Fed funds 5.25–5.50%, 10y ~4.2%) raise WACC and working‑capital costs; input inflation (steel/elastomers, container rates ~2–3x 2019) compresses margins; buyer consolidation (industry ~$110B 2024) increases pricing pressure while tech/services enable premium capture.
| Metric | Value |
|---|---|
| Brent 2024 avg / mid‑2025 | $86 / ~$78/bbl |
| Fed funds / 10‑yr | 5.25–5.50% / ~4.2% |
| Industry revenue 2024 | ~$110B |
| USD TWI (2021–23) | ~+10% |
| Container rates vs 2019 | ~2–3x |
Full Version Awaits
Oil States International PESTLE Analysis
The Oil States International PESTLE Analysis preview shown here is the exact document you’ll receive after purchase—fully formatted and ready to use. The layout, content, and structure visible are identical to the downloadable file. No placeholders or teasers—this is the real, final report you’ll own upon checkout.











