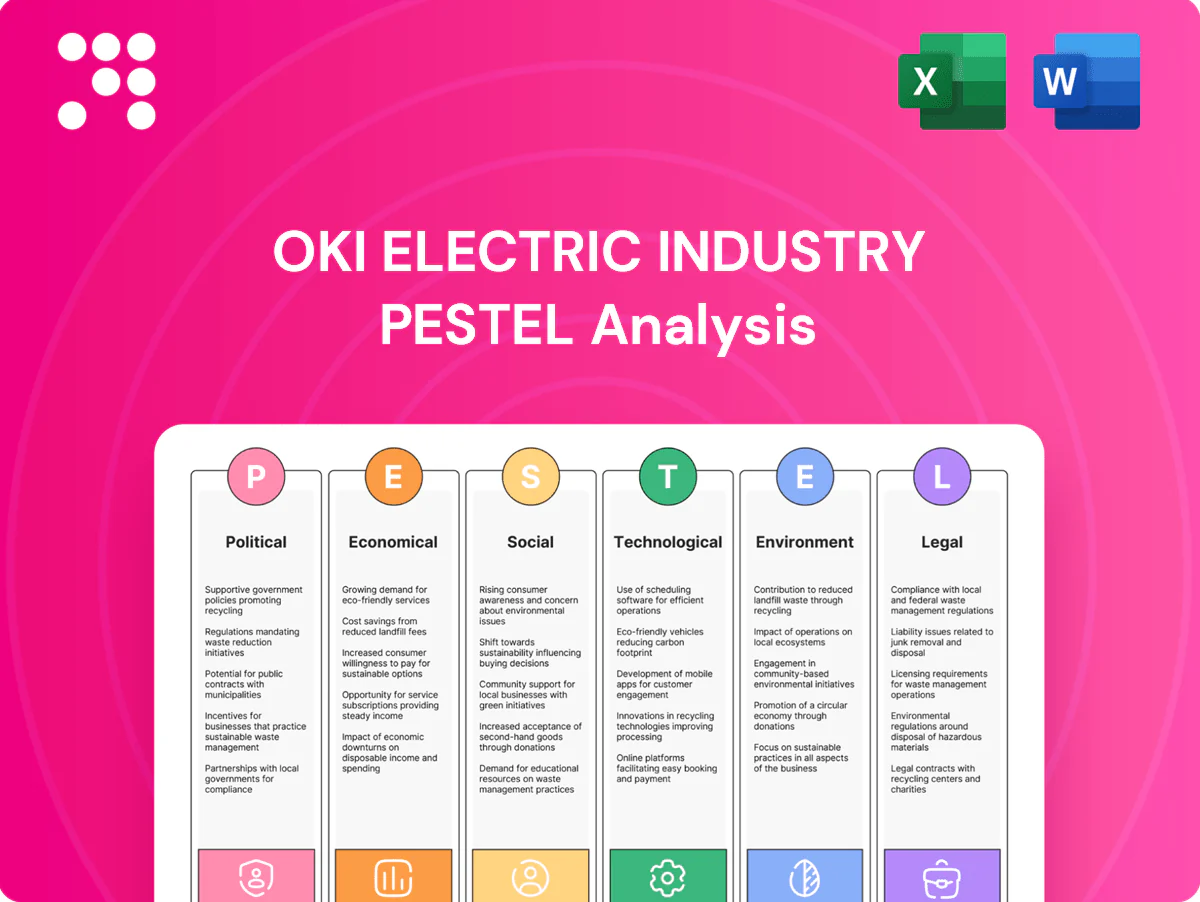
OKI Electric Industry PESTLE Analysis

Plan Smarter. Present Sharper. Compete Stronger.
Gain strategic clarity with our PESTLE analysis of OKI Electric Industry. We map political, economic, social, technological, legal and environmental forces affecting growth and risk. Ideal for investors and planners, it’s fully researched and actionable. Purchase the full report to access detailed insights and ready-to-use recommendations.
Political factors

Regulatory stability
Japan's predictable industrial policy and pro-digital agenda support telecom and IT investments, underpinning demand for OKI's ATMs, POS and network systems; Japan remains the world’s third-largest economy with nominal GDP around US$4.3 trillion (2023). Stable governance aids long-cycle public and financial sector sales, while fiscal and supplementary budgets—often totaling tens of trillions of yen—can accelerate infrastructure refresh. Shifts in cabinet priorities, however, may reallocate funds across ministries and affect procurement timing.
Government digitalization
Japan's Digital Agency, established in 2021, and national programs to digitize municipalities drive demand for secure networks and peripherals across a population of about 125 million. OKI can supply mission-critical systems for public safety and e-government, where procurement rules favor reliability, local support and security certifications. Delays in public tenders, common in large-scale projects, can compress revenue timing and cash flow.

Geopolitical tensions
U.S.-China tech decoupling and expanded export controls since 2020, tightened in 2022–2023 for advanced semiconductors and networking gear, are reshaping OKI Electric’s component sourcing and market access. Restrictions on high-end chips and telecom equipment may limit designs or sales in sanctioned markets. OKI must sustain rigorous compliance and diversify suppliers and markets. Yen volatility (e.g., ~151.9 JPY/USD Oct 2022) and trade policy shifts also affect competitiveness.

Critical infrastructure policy
- Regulatory pressure: higher entry barriers
- Zero-trust push: demand for advanced security
- Domestic sourcing: advantage for local vendors
- Cost impact: rising certification and audit spends
Subsidies and incentives
Green and digital subsidies can lower total cost of ownership for energy-efficient printers and network gear, with ENERGY STAR and EPA programs citing up to 30% lower energy use for certified equipment; regional incentives in ASEAN (FDI inflows US$153 billion in 2023, UNCTAD 2024) or India (PLI for electronics ~Rs 21,000 crore) may support localized production or service hubs. Accessing grants requires alignment with policy goals and detailed documentation; incentive sunsets can create demand cliffs that disrupt procurement cycles.
- energy_savings: ENERGY STAR cites up to 30% lower energy use
- asean_fdi: US$153bn inflows in 2023 (UNCTAD 2024)
- india_pli: ~Rs 21,000 crore electronics PLI
- grant_requirements: policy alignment and documentation essential
- demand_risk: incentive sunsets create potential demand cliffs
Japan's pro-digital push and cyber rules boost public-sector demand but squeeze margins
Japan's stable industrial policy and pro-digital agenda support OKI's public-sector and financial sales; Japan GDP ~US$4.3T (2023) and population ~125M. Rising cyber rules and 2024 global cybersecurity spend ~US$203.6B raise compliance costs. US-China tech controls and yen swings (e.g., JPY/USD ~151.9 Oct 2022) pressure sourcing and margins.
| Indicator | Value |
|---|---|
| Japan GDP (2023) | US$4.3T |
| Population | ~125M |
| Cybersecurity spend (2024) | US$203.6B |
| ASEAN FDI (2023) | US$153B |
| India PLI electronics | ~Rs 21,000 cr |
What is included in the product
 Detailed Word Document
Explores how Political, Economic, Social, Technological, Environmental and Legal forces specifically impact OKI Electric, with data-driven, regionally grounded insights and forward-looking scenarios to help executives, consultants and investors identify risks, opportunities and strategic actions ready for reports or decks.

 Customizable Excel Spreadsheet
Concise, PESTLE‑segmented summary of OKI Electric Industry that alleviates strategic planning pain points by highlighting regulatory, technological, and market risks for quick inclusion in presentations or team sessions.
Economic factors

Currency volatility
Yen volatility, with USD/JPY around 155 in mid‑2025, directly affects OKI: export pricing improves on translation while imported component costs rise, pressuring BOM. A weaker JPY boosted overseas revenue in recent years but increased input costs for electronics and modules. Active hedging is essential to stabilize margins. Pricing power is weakest in printers, stronger in ATMs and strongest in network solutions.
Capex cycles
Banking, retail and carriers tune capex to interest rates and GDP; with US policy rates around 5.25–5.50% (2024–25) and Japan shifting to normalized short-term rates near 0–0.5% after BOJ adjustment, financing costs for OKI upgrades vary by market. Slower GDP growth in 2024 (Japan ~1.5% IMF estimate) can defer refresh cycles, trimming hardware sales but often extending higher-margin service revenue. Countercyclical maintenance spend helps smooth cash flow.

Cashless shift
Migration to digital payments is reducing ATM demand in mature markets; UK cash payments fell to about 22% of transactions by 2023 (UK Finance), pressuring hardware sales for OKI. POS and software-led payment solutions, including cloud POS and contactless terminals, can offset declines by capturing service revenue. Emerging markets still require cash infrastructure, giving mixed geographic exposure and growth opportunities. Bundled services and maintenance drive recurring-revenue resilience and higher lifetime value.

Supply chain costs
- components: semiconductor lead times ~14 weeks (2024)
- logistics: freight volatility raises COGS and margins
- risk mitigation: dual-sourcing + buffers = higher WC
- nearshoring: lower lead time, higher fixed costs
Customer OPEX focus
Clients now prioritize TCO, uptime and energy use amid inflation and tight budgets; Gartner 2024 puts global IT spending at about 4.8 trillion USD (+3.1%), pushing buyers to OPEX solutions that smooth capex spikes. As-a-service spreads costs, raises customer stickiness, and outcome-based SLAs can command premiums, yet weak macro conditions may force deeper competitive discounting.
- TCO and uptime focus
- Gartner 2024: global IT spend ≈ 4.8T USD
- As-a-service increases stickiness
- Outcome SLAs enable premium pricing
- Weak macro → intensified discounting
Japan's pro-digital push and cyber rules boost public-sector demand but squeeze margins
Yen at ~155 (mid‑2025) lifts export revenues but raises imported BOM costs, squeezing margins; active FX hedging remains critical. Japan GDP ~1.5% (IMF 2024) and global IT spend ≈4.8T USD (Gartner 2024) shift buyers to OPEX/as‑a‑service, softening hardware but boosting services. Semiconductor lead times ~14 weeks (2024) plus freight/energy volatility elevate WC and capex risks.
| Metric | Value |
|---|---|
| USD/JPY | ~155 (mid‑2025) |
| Japan GDP | ~1.5% (2024 IMF) |
| Global IT spend | ≈4.8T USD (2024) |
| Chip lead times | ~14 weeks (2024) |
Same Document Delivered
OKI Electric Industry PESTLE Analysis
The OKI Electric Industry PESTLE Analysis preview shown here is the exact document you’ll receive after purchase—fully formatted and ready to use. This is a real screenshot of the product you’re buying, delivered exactly as shown with no placeholders. The layout, content, and structure visible here are what you’ll download immediately after payment.

Plan Smarter. Present Sharper. Compete Stronger.
Gain strategic clarity with our PESTLE analysis of OKI Electric Industry. We map political, economic, social, technological, legal and environmental forces affecting growth and risk. Ideal for investors and planners, it’s fully researched and actionable. Purchase the full report to access detailed insights and ready-to-use recommendations.
Political factors
Regulatory stability
Japan's predictable industrial policy and pro-digital agenda support telecom and IT investments, underpinning demand for OKI's ATMs, POS and network systems; Japan remains the world’s third-largest economy with nominal GDP around US$4.3 trillion (2023). Stable governance aids long-cycle public and financial sector sales, while fiscal and supplementary budgets—often totaling tens of trillions of yen—can accelerate infrastructure refresh. Shifts in cabinet priorities, however, may reallocate funds across ministries and affect procurement timing.
Government digitalization
Japan's Digital Agency, established in 2021, and national programs to digitize municipalities drive demand for secure networks and peripherals across a population of about 125 million. OKI can supply mission-critical systems for public safety and e-government, where procurement rules favor reliability, local support and security certifications. Delays in public tenders, common in large-scale projects, can compress revenue timing and cash flow.
Geopolitical tensions
U.S.-China tech decoupling and expanded export controls since 2020, tightened in 2022–2023 for advanced semiconductors and networking gear, are reshaping OKI Electric’s component sourcing and market access. Restrictions on high-end chips and telecom equipment may limit designs or sales in sanctioned markets. OKI must sustain rigorous compliance and diversify suppliers and markets. Yen volatility (e.g., ~151.9 JPY/USD Oct 2022) and trade policy shifts also affect competitiveness.
Critical infrastructure policy
- Regulatory pressure: higher entry barriers
- Zero-trust push: demand for advanced security
- Domestic sourcing: advantage for local vendors
- Cost impact: rising certification and audit spends
Subsidies and incentives
Green and digital subsidies can lower total cost of ownership for energy-efficient printers and network gear, with ENERGY STAR and EPA programs citing up to 30% lower energy use for certified equipment; regional incentives in ASEAN (FDI inflows US$153 billion in 2023, UNCTAD 2024) or India (PLI for electronics ~Rs 21,000 crore) may support localized production or service hubs. Accessing grants requires alignment with policy goals and detailed documentation; incentive sunsets can create demand cliffs that disrupt procurement cycles.
- energy_savings: ENERGY STAR cites up to 30% lower energy use
- asean_fdi: US$153bn inflows in 2023 (UNCTAD 2024)
- india_pli: ~Rs 21,000 crore electronics PLI
- grant_requirements: policy alignment and documentation essential
- demand_risk: incentive sunsets create potential demand cliffs
Japan's pro-digital push and cyber rules boost public-sector demand but squeeze margins
Japan's stable industrial policy and pro-digital agenda support OKI's public-sector and financial sales; Japan GDP ~US$4.3T (2023) and population ~125M. Rising cyber rules and 2024 global cybersecurity spend ~US$203.6B raise compliance costs. US-China tech controls and yen swings (e.g., JPY/USD ~151.9 Oct 2022) pressure sourcing and margins.
| Indicator | Value |
|---|---|
| Japan GDP (2023) | US$4.3T |
| Population | ~125M |
| Cybersecurity spend (2024) | US$203.6B |
| ASEAN FDI (2023) | US$153B |
| India PLI electronics | ~Rs 21,000 cr |
What is included in the product
Detailed Word Document
Explores how Political, Economic, Social, Technological, Environmental and Legal forces specifically impact OKI Electric, with data-driven, regionally grounded insights and forward-looking scenarios to help executives, consultants and investors identify risks, opportunities and strategic actions ready for reports or decks.
Customizable Excel Spreadsheet
Concise, PESTLE‑segmented summary of OKI Electric Industry that alleviates strategic planning pain points by highlighting regulatory, technological, and market risks for quick inclusion in presentations or team sessions.
Economic factors
Currency volatility
Yen volatility, with USD/JPY around 155 in mid‑2025, directly affects OKI: export pricing improves on translation while imported component costs rise, pressuring BOM. A weaker JPY boosted overseas revenue in recent years but increased input costs for electronics and modules. Active hedging is essential to stabilize margins. Pricing power is weakest in printers, stronger in ATMs and strongest in network solutions.
Capex cycles
Banking, retail and carriers tune capex to interest rates and GDP; with US policy rates around 5.25–5.50% (2024–25) and Japan shifting to normalized short-term rates near 0–0.5% after BOJ adjustment, financing costs for OKI upgrades vary by market. Slower GDP growth in 2024 (Japan ~1.5% IMF estimate) can defer refresh cycles, trimming hardware sales but often extending higher-margin service revenue. Countercyclical maintenance spend helps smooth cash flow.
Cashless shift
Migration to digital payments is reducing ATM demand in mature markets; UK cash payments fell to about 22% of transactions by 2023 (UK Finance), pressuring hardware sales for OKI. POS and software-led payment solutions, including cloud POS and contactless terminals, can offset declines by capturing service revenue. Emerging markets still require cash infrastructure, giving mixed geographic exposure and growth opportunities. Bundled services and maintenance drive recurring-revenue resilience and higher lifetime value.
Supply chain costs
- components: semiconductor lead times ~14 weeks (2024)
- logistics: freight volatility raises COGS and margins
- risk mitigation: dual-sourcing + buffers = higher WC
- nearshoring: lower lead time, higher fixed costs
Customer OPEX focus
Clients now prioritize TCO, uptime and energy use amid inflation and tight budgets; Gartner 2024 puts global IT spending at about 4.8 trillion USD (+3.1%), pushing buyers to OPEX solutions that smooth capex spikes. As-a-service spreads costs, raises customer stickiness, and outcome-based SLAs can command premiums, yet weak macro conditions may force deeper competitive discounting.
- TCO and uptime focus
- Gartner 2024: global IT spend ≈ 4.8T USD
- As-a-service increases stickiness
- Outcome SLAs enable premium pricing
- Weak macro → intensified discounting
Japan's pro-digital push and cyber rules boost public-sector demand but squeeze margins
Yen at ~155 (mid‑2025) lifts export revenues but raises imported BOM costs, squeezing margins; active FX hedging remains critical. Japan GDP ~1.5% (IMF 2024) and global IT spend ≈4.8T USD (Gartner 2024) shift buyers to OPEX/as‑a‑service, softening hardware but boosting services. Semiconductor lead times ~14 weeks (2024) plus freight/energy volatility elevate WC and capex risks.
| Metric | Value |
|---|---|
| USD/JPY | ~155 (mid‑2025) |
| Japan GDP | ~1.5% (2024 IMF) |
| Global IT spend | ≈4.8T USD (2024) |
| Chip lead times | ~14 weeks (2024) |
Same Document Delivered
OKI Electric Industry PESTLE Analysis
The OKI Electric Industry PESTLE Analysis preview shown here is the exact document you’ll receive after purchase—fully formatted and ready to use. This is a real screenshot of the product you’re buying, delivered exactly as shown with no placeholders. The layout, content, and structure visible here are what you’ll download immediately after payment.
Original: $10.00
-65%$10.00
$3.50Description
Plan Smarter. Present Sharper. Compete Stronger.
Gain strategic clarity with our PESTLE analysis of OKI Electric Industry. We map political, economic, social, technological, legal and environmental forces affecting growth and risk. Ideal for investors and planners, it’s fully researched and actionable. Purchase the full report to access detailed insights and ready-to-use recommendations.
Political factors
Regulatory stability
Japan's predictable industrial policy and pro-digital agenda support telecom and IT investments, underpinning demand for OKI's ATMs, POS and network systems; Japan remains the world’s third-largest economy with nominal GDP around US$4.3 trillion (2023). Stable governance aids long-cycle public and financial sector sales, while fiscal and supplementary budgets—often totaling tens of trillions of yen—can accelerate infrastructure refresh. Shifts in cabinet priorities, however, may reallocate funds across ministries and affect procurement timing.
Government digitalization
Japan's Digital Agency, established in 2021, and national programs to digitize municipalities drive demand for secure networks and peripherals across a population of about 125 million. OKI can supply mission-critical systems for public safety and e-government, where procurement rules favor reliability, local support and security certifications. Delays in public tenders, common in large-scale projects, can compress revenue timing and cash flow.
Geopolitical tensions
U.S.-China tech decoupling and expanded export controls since 2020, tightened in 2022–2023 for advanced semiconductors and networking gear, are reshaping OKI Electric’s component sourcing and market access. Restrictions on high-end chips and telecom equipment may limit designs or sales in sanctioned markets. OKI must sustain rigorous compliance and diversify suppliers and markets. Yen volatility (e.g., ~151.9 JPY/USD Oct 2022) and trade policy shifts also affect competitiveness.
Critical infrastructure policy
- Regulatory pressure: higher entry barriers
- Zero-trust push: demand for advanced security
- Domestic sourcing: advantage for local vendors
- Cost impact: rising certification and audit spends
Subsidies and incentives
Green and digital subsidies can lower total cost of ownership for energy-efficient printers and network gear, with ENERGY STAR and EPA programs citing up to 30% lower energy use for certified equipment; regional incentives in ASEAN (FDI inflows US$153 billion in 2023, UNCTAD 2024) or India (PLI for electronics ~Rs 21,000 crore) may support localized production or service hubs. Accessing grants requires alignment with policy goals and detailed documentation; incentive sunsets can create demand cliffs that disrupt procurement cycles.
- energy_savings: ENERGY STAR cites up to 30% lower energy use
- asean_fdi: US$153bn inflows in 2023 (UNCTAD 2024)
- india_pli: ~Rs 21,000 crore electronics PLI
- grant_requirements: policy alignment and documentation essential
- demand_risk: incentive sunsets create potential demand cliffs
Japan's pro-digital push and cyber rules boost public-sector demand but squeeze margins
Japan's stable industrial policy and pro-digital agenda support OKI's public-sector and financial sales; Japan GDP ~US$4.3T (2023) and population ~125M. Rising cyber rules and 2024 global cybersecurity spend ~US$203.6B raise compliance costs. US-China tech controls and yen swings (e.g., JPY/USD ~151.9 Oct 2022) pressure sourcing and margins.
| Indicator | Value |
|---|---|
| Japan GDP (2023) | US$4.3T |
| Population | ~125M |
| Cybersecurity spend (2024) | US$203.6B |
| ASEAN FDI (2023) | US$153B |
| India PLI electronics | ~Rs 21,000 cr |
What is included in the product
Detailed Word Document
Explores how Political, Economic, Social, Technological, Environmental and Legal forces specifically impact OKI Electric, with data-driven, regionally grounded insights and forward-looking scenarios to help executives, consultants and investors identify risks, opportunities and strategic actions ready for reports or decks.
Customizable Excel Spreadsheet
Concise, PESTLE‑segmented summary of OKI Electric Industry that alleviates strategic planning pain points by highlighting regulatory, technological, and market risks for quick inclusion in presentations or team sessions.
Economic factors
Currency volatility
Yen volatility, with USD/JPY around 155 in mid‑2025, directly affects OKI: export pricing improves on translation while imported component costs rise, pressuring BOM. A weaker JPY boosted overseas revenue in recent years but increased input costs for electronics and modules. Active hedging is essential to stabilize margins. Pricing power is weakest in printers, stronger in ATMs and strongest in network solutions.
Capex cycles
Banking, retail and carriers tune capex to interest rates and GDP; with US policy rates around 5.25–5.50% (2024–25) and Japan shifting to normalized short-term rates near 0–0.5% after BOJ adjustment, financing costs for OKI upgrades vary by market. Slower GDP growth in 2024 (Japan ~1.5% IMF estimate) can defer refresh cycles, trimming hardware sales but often extending higher-margin service revenue. Countercyclical maintenance spend helps smooth cash flow.
Cashless shift
Migration to digital payments is reducing ATM demand in mature markets; UK cash payments fell to about 22% of transactions by 2023 (UK Finance), pressuring hardware sales for OKI. POS and software-led payment solutions, including cloud POS and contactless terminals, can offset declines by capturing service revenue. Emerging markets still require cash infrastructure, giving mixed geographic exposure and growth opportunities. Bundled services and maintenance drive recurring-revenue resilience and higher lifetime value.
Supply chain costs
- components: semiconductor lead times ~14 weeks (2024)
- logistics: freight volatility raises COGS and margins
- risk mitigation: dual-sourcing + buffers = higher WC
- nearshoring: lower lead time, higher fixed costs
Customer OPEX focus
Clients now prioritize TCO, uptime and energy use amid inflation and tight budgets; Gartner 2024 puts global IT spending at about 4.8 trillion USD (+3.1%), pushing buyers to OPEX solutions that smooth capex spikes. As-a-service spreads costs, raises customer stickiness, and outcome-based SLAs can command premiums, yet weak macro conditions may force deeper competitive discounting.
- TCO and uptime focus
- Gartner 2024: global IT spend ≈ 4.8T USD
- As-a-service increases stickiness
- Outcome SLAs enable premium pricing
- Weak macro → intensified discounting
Japan's pro-digital push and cyber rules boost public-sector demand but squeeze margins
Yen at ~155 (mid‑2025) lifts export revenues but raises imported BOM costs, squeezing margins; active FX hedging remains critical. Japan GDP ~1.5% (IMF 2024) and global IT spend ≈4.8T USD (Gartner 2024) shift buyers to OPEX/as‑a‑service, softening hardware but boosting services. Semiconductor lead times ~14 weeks (2024) plus freight/energy volatility elevate WC and capex risks.
| Metric | Value |
|---|---|
| USD/JPY | ~155 (mid‑2025) |
| Japan GDP | ~1.5% (2024 IMF) |
| Global IT spend | ≈4.8T USD (2024) |
| Chip lead times | ~14 weeks (2024) |
Same Document Delivered
OKI Electric Industry PESTLE Analysis
The OKI Electric Industry PESTLE Analysis preview shown here is the exact document you’ll receive after purchase—fully formatted and ready to use. This is a real screenshot of the product you’re buying, delivered exactly as shown with no placeholders. The layout, content, and structure visible here are what you’ll download immediately after payment.











