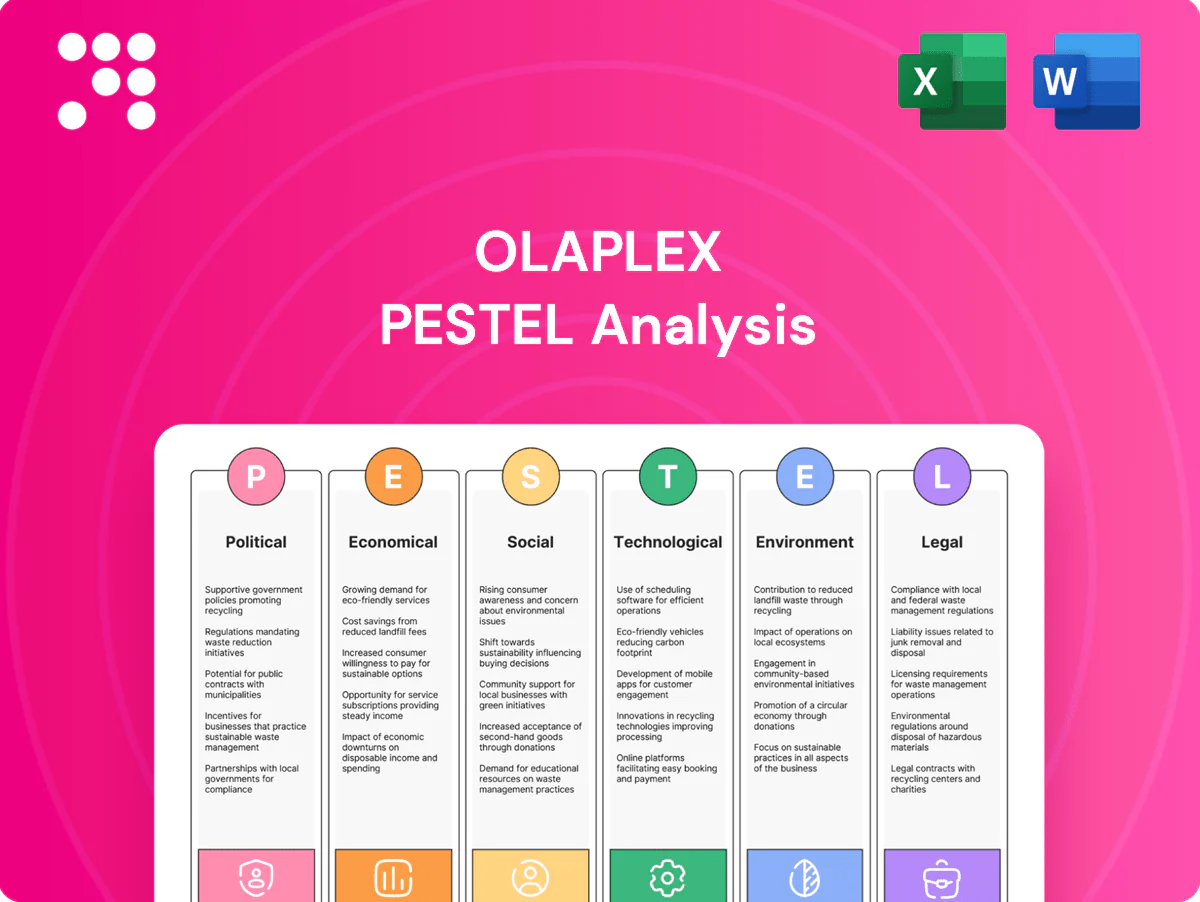
Olaplex PESTLE Analysis

Plan Smarter. Present Sharper. Compete Stronger.
Discover how political, economic, social, technological, legal and environmental forces are shaping Olaplex's strategic outlook in our concise PESTLE snapshot—perfect for investors and strategists. This expert analysis highlights risks and growth drivers you can act on immediately. Purchase the full PESTLE report for the complete, editable breakdown and actionable insights to inform your next move.
Political factors

Trade and tariff exposure
Import duties on cosmetics and chemical inputs can shift landed costs and pricing flexibility across regions, pressuring Olaplex’s gross margins if key inputs face higher tariffs. Changes in US–EU trade dynamics or new duties on packaging resin and specialty chemicals would directly affect input cost and freight economics. Preferential trade agreements can unlock lower tariffs for contract manufacturing footprints, improving unit economics. Monitoring WTO disputes and country-of-origin rules is essential for global SKU planning.
Geopolitical supply chain risk
Geopolitical instability in 2023–24, including Red Sea shipping disruptions, has lengthened transit times and pushed freight costs higher, risking delays for Olaplex's key cosmetic ingredients sourced from Asia and Europe. Sanctions and export controls on specialty chemicals can constrain availability and margin, while unrest can disrupt contract manufacturers and 3PL partners. Implementing dual-sourcing and regionalization across APAC, EMEA and North America reduces exposure.

Government health and salon policies
Government public-health measures directly shift salon throughput and demand between professional services and at-home treatments; the global haircare market exceeded $100 billion in 2024, amplifying channel sensitivity. Occupational regulations for stylists drive product-use protocols and paid training, raising salon operating costs. Small-business subsidies (grant/loan programs) can stabilize the salon channel, while rapid policy reversals quickly force channel-mix and inventory adjustments.

Industrial policy and R&D incentives
Labeling and localization policies
Country-specific political decisions force Olaplex to localize labels, languages and compliance marks — the EU covers 24 official languages under Regulation (EU) No 1169/2011 and requires local-language information, while Regulation (EC) No 1223/2009 sets cosmetic ingredient and RP obligations. Protectionist procurement and localization rules can mandate local filling/packaging; political pressure for Made in claims and administrative changes have caused product launch delays in several markets.
- EU: 24 official languages, Reg 1169/2011 + Reg 1223/2009
- Localization may require local filling/packaging
- Made in claims influence supply chain design
- Administrative changes can delay approvals and launches
Supply shocks and freight spikes compress haircare margins; market >$100bn
Import duties and trade shifts can raise landed input costs and squeeze gross margins. Geopolitical disruptions (Red Sea 2023–24) drove freight spikes and transit delays, prompting dual‑sourcing. Public‑health rules and salon regulations change channel demand; global haircare >$100bn (2024). R&D incentives (Horizon €95.5bn; US CHIPS ≈$200bn) affect formulation costs and partner access.
| Metric | 2024/25 datapoint |
|---|---|
| Global haircare market | >$100bn (2024) |
| Freight impact | Red Sea disruptions: freight +20–40% peak |
| R&D funding | Horizon €95.5bn; US CHIPS ≈$200bn |
What is included in the product
 Detailed Word Document
Explores how Political, Economic, Social, Technological, Environmental, and Legal factors uniquely affect Olaplex, with data-backed trends and region-specific regulatory context to identify risks and opportunities; formatted for inclusion in business plans, pitch decks, and executive briefings to support strategy, scenario planning, and investor confidence.

 Customizable Excel Spreadsheet
A clean, visually segmented Olaplex PESTLE summary that relieves pain points by enabling quick interpretation, easy note-taking for regional or product-specific context, and seamless insertion into presentations or team alignments to support risk and positioning discussions.
Economic factors

Consumer discretionary cycles
Haircare spend is cyclical and sensitive to real income and employment; the global haircare market was about $95 billion in 2023 with a mid-single-digit CAGR through 2028, so premium-priced treatments like Olaplex face trading-down in downturns that pressure mix and price realization. In expansions consumers adopt higher-ticket multi-step repair regimens, while elasticity varies by channel and salon services are generally more resilient for essential repairs.
Input cost inflation
Volatility in solvents, surfactants and packaging resin has driven noticeable COGS variability for personal-care manufacturers, with industry spot resin swings of ±20% in 2023–24 increasing input cost uncertainty.
Energy and freight costs cascade through contract manufacturing and fulfillment; global container rates, while down from pandemic peaks, averaged roughly $1,500–$2,000 per FEU in 2024, pressuring margin stability.
Hedging and supplier-relationship management (SRM) can blunt spikes but rarely fully offset pass-through; many firms report only partial protection on spot-driven inputs.
Strategic reformulation to lower solvent content and pack-price architecture (larger SKUs, value tiers) have proven effective margin levers in 2024–25 industry cases.

FX and international revenue mix
Multi-currency exposure means Olaplex reported sales and margins in EMEA/APAC are sensitive to FX swings; with the US dollar averaging about a 104.5 DXY in 2024, translated revenue faced headwinds. Dollar strength compressed reported sales and forced pricing parity trade-offs across markets. Localized pricing and selective hedging helped stabilize contribution margins, while distributor terms and promotional allowances required adjustment to sustain retail velocity.

Channel consolidation and retailer power
Channel consolidation gives Ulta, Sephora and Amazon outsized placement and margin leverage; slotting, promotional funding and returns often compress net revenue—promotions and allowances commonly exceed 10% of gross sales. Strong DTC (over 30% of sales for many prestige brands) lowers dependency and improves first‑party data but demands strict CAC control as digital ad costs rose in 2024.
- Retailer concentration: major platforms dominate shelf space
- Promotions/slotting: >10% impact on net revenue
- DTC: >30% share helps data capture
- Omni-channel mix: stabilizes revenue across cycles
Inventory and working capital dynamics
Seasonality, launch cadences, and salon demand variability drive Olaplex inventory profiles, forcing higher safety stock ahead of holiday and promotional peaks while risking overstocks that lead to markdowns and brand dilution.
Tight forecasting tied to marketing pulses and influencer waves reduces inventory whiplash; vendor payment terms and cash conversion dynamics determine liquidity flexibility for rapid replenishment or buybacks.
Supply shocks and freight spikes compress haircare margins; market >$100bn
Haircare market ~$95B (2023) with mid-single-digit CAGR to 2028; premium mix is cyclical and faces trading-down in downturns. Input cost volatility: resin swings ±20% (2023–24) and container rates ~$1,500–$2,000/FEU (2024) pressure margins. FX: DXY ~104.5 (2024) compressed reported EMEA/APAC revenue; DTC >30% offsets >10% promo/slotting drag.
| Metric | Value |
|---|---|
| Market size (2023) | $95B |
| Resin volatility | ±20% (2023–24) |
| Container rate (2024) | $1.5–2k/FEU |
| DXY (2024) | ~104.5 |
Preview Before You Purchase
Olaplex PESTLE Analysis
The Olaplex PESTLE Analysis preview shown here is the exact document you’ll receive after purchase—fully formatted and ready to use. It contains the full political, economic, social, technological, legal, and environmental assessment without placeholders. Download the same, professionally structured file immediately after checkout.

Plan Smarter. Present Sharper. Compete Stronger.
Discover how political, economic, social, technological, legal and environmental forces are shaping Olaplex's strategic outlook in our concise PESTLE snapshot—perfect for investors and strategists. This expert analysis highlights risks and growth drivers you can act on immediately. Purchase the full PESTLE report for the complete, editable breakdown and actionable insights to inform your next move.
Political factors
Trade and tariff exposure
Import duties on cosmetics and chemical inputs can shift landed costs and pricing flexibility across regions, pressuring Olaplex’s gross margins if key inputs face higher tariffs. Changes in US–EU trade dynamics or new duties on packaging resin and specialty chemicals would directly affect input cost and freight economics. Preferential trade agreements can unlock lower tariffs for contract manufacturing footprints, improving unit economics. Monitoring WTO disputes and country-of-origin rules is essential for global SKU planning.
Geopolitical supply chain risk
Geopolitical instability in 2023–24, including Red Sea shipping disruptions, has lengthened transit times and pushed freight costs higher, risking delays for Olaplex's key cosmetic ingredients sourced from Asia and Europe. Sanctions and export controls on specialty chemicals can constrain availability and margin, while unrest can disrupt contract manufacturers and 3PL partners. Implementing dual-sourcing and regionalization across APAC, EMEA and North America reduces exposure.
Government health and salon policies
Government public-health measures directly shift salon throughput and demand between professional services and at-home treatments; the global haircare market exceeded $100 billion in 2024, amplifying channel sensitivity. Occupational regulations for stylists drive product-use protocols and paid training, raising salon operating costs. Small-business subsidies (grant/loan programs) can stabilize the salon channel, while rapid policy reversals quickly force channel-mix and inventory adjustments.
Industrial policy and R&D incentives
Labeling and localization policies
Country-specific political decisions force Olaplex to localize labels, languages and compliance marks — the EU covers 24 official languages under Regulation (EU) No 1169/2011 and requires local-language information, while Regulation (EC) No 1223/2009 sets cosmetic ingredient and RP obligations. Protectionist procurement and localization rules can mandate local filling/packaging; political pressure for Made in claims and administrative changes have caused product launch delays in several markets.
- EU: 24 official languages, Reg 1169/2011 + Reg 1223/2009
- Localization may require local filling/packaging
- Made in claims influence supply chain design
- Administrative changes can delay approvals and launches
Supply shocks and freight spikes compress haircare margins; market >$100bn
Import duties and trade shifts can raise landed input costs and squeeze gross margins. Geopolitical disruptions (Red Sea 2023–24) drove freight spikes and transit delays, prompting dual‑sourcing. Public‑health rules and salon regulations change channel demand; global haircare >$100bn (2024). R&D incentives (Horizon €95.5bn; US CHIPS ≈$200bn) affect formulation costs and partner access.
| Metric | 2024/25 datapoint |
|---|---|
| Global haircare market | >$100bn (2024) |
| Freight impact | Red Sea disruptions: freight +20–40% peak |
| R&D funding | Horizon €95.5bn; US CHIPS ≈$200bn |
What is included in the product
Detailed Word Document
Explores how Political, Economic, Social, Technological, Environmental, and Legal factors uniquely affect Olaplex, with data-backed trends and region-specific regulatory context to identify risks and opportunities; formatted for inclusion in business plans, pitch decks, and executive briefings to support strategy, scenario planning, and investor confidence.
Customizable Excel Spreadsheet
A clean, visually segmented Olaplex PESTLE summary that relieves pain points by enabling quick interpretation, easy note-taking for regional or product-specific context, and seamless insertion into presentations or team alignments to support risk and positioning discussions.
Economic factors
Consumer discretionary cycles
Haircare spend is cyclical and sensitive to real income and employment; the global haircare market was about $95 billion in 2023 with a mid-single-digit CAGR through 2028, so premium-priced treatments like Olaplex face trading-down in downturns that pressure mix and price realization. In expansions consumers adopt higher-ticket multi-step repair regimens, while elasticity varies by channel and salon services are generally more resilient for essential repairs.
Input cost inflation
Volatility in solvents, surfactants and packaging resin has driven noticeable COGS variability for personal-care manufacturers, with industry spot resin swings of ±20% in 2023–24 increasing input cost uncertainty.
Energy and freight costs cascade through contract manufacturing and fulfillment; global container rates, while down from pandemic peaks, averaged roughly $1,500–$2,000 per FEU in 2024, pressuring margin stability.
Hedging and supplier-relationship management (SRM) can blunt spikes but rarely fully offset pass-through; many firms report only partial protection on spot-driven inputs.
Strategic reformulation to lower solvent content and pack-price architecture (larger SKUs, value tiers) have proven effective margin levers in 2024–25 industry cases.
FX and international revenue mix
Multi-currency exposure means Olaplex reported sales and margins in EMEA/APAC are sensitive to FX swings; with the US dollar averaging about a 104.5 DXY in 2024, translated revenue faced headwinds. Dollar strength compressed reported sales and forced pricing parity trade-offs across markets. Localized pricing and selective hedging helped stabilize contribution margins, while distributor terms and promotional allowances required adjustment to sustain retail velocity.
Channel consolidation and retailer power
Channel consolidation gives Ulta, Sephora and Amazon outsized placement and margin leverage; slotting, promotional funding and returns often compress net revenue—promotions and allowances commonly exceed 10% of gross sales. Strong DTC (over 30% of sales for many prestige brands) lowers dependency and improves first‑party data but demands strict CAC control as digital ad costs rose in 2024.
- Retailer concentration: major platforms dominate shelf space
- Promotions/slotting: >10% impact on net revenue
- DTC: >30% share helps data capture
- Omni-channel mix: stabilizes revenue across cycles
Inventory and working capital dynamics
Seasonality, launch cadences, and salon demand variability drive Olaplex inventory profiles, forcing higher safety stock ahead of holiday and promotional peaks while risking overstocks that lead to markdowns and brand dilution.
Tight forecasting tied to marketing pulses and influencer waves reduces inventory whiplash; vendor payment terms and cash conversion dynamics determine liquidity flexibility for rapid replenishment or buybacks.
Supply shocks and freight spikes compress haircare margins; market >$100bn
Haircare market ~$95B (2023) with mid-single-digit CAGR to 2028; premium mix is cyclical and faces trading-down in downturns. Input cost volatility: resin swings ±20% (2023–24) and container rates ~$1,500–$2,000/FEU (2024) pressure margins. FX: DXY ~104.5 (2024) compressed reported EMEA/APAC revenue; DTC >30% offsets >10% promo/slotting drag.
| Metric | Value |
|---|---|
| Market size (2023) | $95B |
| Resin volatility | ±20% (2023–24) |
| Container rate (2024) | $1.5–2k/FEU |
| DXY (2024) | ~104.5 |
Preview Before You Purchase
Olaplex PESTLE Analysis
The Olaplex PESTLE Analysis preview shown here is the exact document you’ll receive after purchase—fully formatted and ready to use. It contains the full political, economic, social, technological, legal, and environmental assessment without placeholders. Download the same, professionally structured file immediately after checkout.
Description
Plan Smarter. Present Sharper. Compete Stronger.
Discover how political, economic, social, technological, legal and environmental forces are shaping Olaplex's strategic outlook in our concise PESTLE snapshot—perfect for investors and strategists. This expert analysis highlights risks and growth drivers you can act on immediately. Purchase the full PESTLE report for the complete, editable breakdown and actionable insights to inform your next move.
Political factors
Trade and tariff exposure
Import duties on cosmetics and chemical inputs can shift landed costs and pricing flexibility across regions, pressuring Olaplex’s gross margins if key inputs face higher tariffs. Changes in US–EU trade dynamics or new duties on packaging resin and specialty chemicals would directly affect input cost and freight economics. Preferential trade agreements can unlock lower tariffs for contract manufacturing footprints, improving unit economics. Monitoring WTO disputes and country-of-origin rules is essential for global SKU planning.
Geopolitical supply chain risk
Geopolitical instability in 2023–24, including Red Sea shipping disruptions, has lengthened transit times and pushed freight costs higher, risking delays for Olaplex's key cosmetic ingredients sourced from Asia and Europe. Sanctions and export controls on specialty chemicals can constrain availability and margin, while unrest can disrupt contract manufacturers and 3PL partners. Implementing dual-sourcing and regionalization across APAC, EMEA and North America reduces exposure.
Government health and salon policies
Government public-health measures directly shift salon throughput and demand between professional services and at-home treatments; the global haircare market exceeded $100 billion in 2024, amplifying channel sensitivity. Occupational regulations for stylists drive product-use protocols and paid training, raising salon operating costs. Small-business subsidies (grant/loan programs) can stabilize the salon channel, while rapid policy reversals quickly force channel-mix and inventory adjustments.
Industrial policy and R&D incentives
Labeling and localization policies
Country-specific political decisions force Olaplex to localize labels, languages and compliance marks — the EU covers 24 official languages under Regulation (EU) No 1169/2011 and requires local-language information, while Regulation (EC) No 1223/2009 sets cosmetic ingredient and RP obligations. Protectionist procurement and localization rules can mandate local filling/packaging; political pressure for Made in claims and administrative changes have caused product launch delays in several markets.
- EU: 24 official languages, Reg 1169/2011 + Reg 1223/2009
- Localization may require local filling/packaging
- Made in claims influence supply chain design
- Administrative changes can delay approvals and launches
Supply shocks and freight spikes compress haircare margins; market >$100bn
Import duties and trade shifts can raise landed input costs and squeeze gross margins. Geopolitical disruptions (Red Sea 2023–24) drove freight spikes and transit delays, prompting dual‑sourcing. Public‑health rules and salon regulations change channel demand; global haircare >$100bn (2024). R&D incentives (Horizon €95.5bn; US CHIPS ≈$200bn) affect formulation costs and partner access.
| Metric | 2024/25 datapoint |
|---|---|
| Global haircare market | >$100bn (2024) |
| Freight impact | Red Sea disruptions: freight +20–40% peak |
| R&D funding | Horizon €95.5bn; US CHIPS ≈$200bn |
What is included in the product
Detailed Word Document
Explores how Political, Economic, Social, Technological, Environmental, and Legal factors uniquely affect Olaplex, with data-backed trends and region-specific regulatory context to identify risks and opportunities; formatted for inclusion in business plans, pitch decks, and executive briefings to support strategy, scenario planning, and investor confidence.
Customizable Excel Spreadsheet
A clean, visually segmented Olaplex PESTLE summary that relieves pain points by enabling quick interpretation, easy note-taking for regional or product-specific context, and seamless insertion into presentations or team alignments to support risk and positioning discussions.
Economic factors
Consumer discretionary cycles
Haircare spend is cyclical and sensitive to real income and employment; the global haircare market was about $95 billion in 2023 with a mid-single-digit CAGR through 2028, so premium-priced treatments like Olaplex face trading-down in downturns that pressure mix and price realization. In expansions consumers adopt higher-ticket multi-step repair regimens, while elasticity varies by channel and salon services are generally more resilient for essential repairs.
Input cost inflation
Volatility in solvents, surfactants and packaging resin has driven noticeable COGS variability for personal-care manufacturers, with industry spot resin swings of ±20% in 2023–24 increasing input cost uncertainty.
Energy and freight costs cascade through contract manufacturing and fulfillment; global container rates, while down from pandemic peaks, averaged roughly $1,500–$2,000 per FEU in 2024, pressuring margin stability.
Hedging and supplier-relationship management (SRM) can blunt spikes but rarely fully offset pass-through; many firms report only partial protection on spot-driven inputs.
Strategic reformulation to lower solvent content and pack-price architecture (larger SKUs, value tiers) have proven effective margin levers in 2024–25 industry cases.
FX and international revenue mix
Multi-currency exposure means Olaplex reported sales and margins in EMEA/APAC are sensitive to FX swings; with the US dollar averaging about a 104.5 DXY in 2024, translated revenue faced headwinds. Dollar strength compressed reported sales and forced pricing parity trade-offs across markets. Localized pricing and selective hedging helped stabilize contribution margins, while distributor terms and promotional allowances required adjustment to sustain retail velocity.
Channel consolidation and retailer power
Channel consolidation gives Ulta, Sephora and Amazon outsized placement and margin leverage; slotting, promotional funding and returns often compress net revenue—promotions and allowances commonly exceed 10% of gross sales. Strong DTC (over 30% of sales for many prestige brands) lowers dependency and improves first‑party data but demands strict CAC control as digital ad costs rose in 2024.
- Retailer concentration: major platforms dominate shelf space
- Promotions/slotting: >10% impact on net revenue
- DTC: >30% share helps data capture
- Omni-channel mix: stabilizes revenue across cycles
Inventory and working capital dynamics
Seasonality, launch cadences, and salon demand variability drive Olaplex inventory profiles, forcing higher safety stock ahead of holiday and promotional peaks while risking overstocks that lead to markdowns and brand dilution.
Tight forecasting tied to marketing pulses and influencer waves reduces inventory whiplash; vendor payment terms and cash conversion dynamics determine liquidity flexibility for rapid replenishment or buybacks.
Supply shocks and freight spikes compress haircare margins; market >$100bn
Haircare market ~$95B (2023) with mid-single-digit CAGR to 2028; premium mix is cyclical and faces trading-down in downturns. Input cost volatility: resin swings ±20% (2023–24) and container rates ~$1,500–$2,000/FEU (2024) pressure margins. FX: DXY ~104.5 (2024) compressed reported EMEA/APAC revenue; DTC >30% offsets >10% promo/slotting drag.
| Metric | Value |
|---|---|
| Market size (2023) | $95B |
| Resin volatility | ±20% (2023–24) |
| Container rate (2024) | $1.5–2k/FEU |
| DXY (2024) | ~104.5 |
Preview Before You Purchase
Olaplex PESTLE Analysis
The Olaplex PESTLE Analysis preview shown here is the exact document you’ll receive after purchase—fully formatted and ready to use. It contains the full political, economic, social, technological, legal, and environmental assessment without placeholders. Download the same, professionally structured file immediately after checkout.











