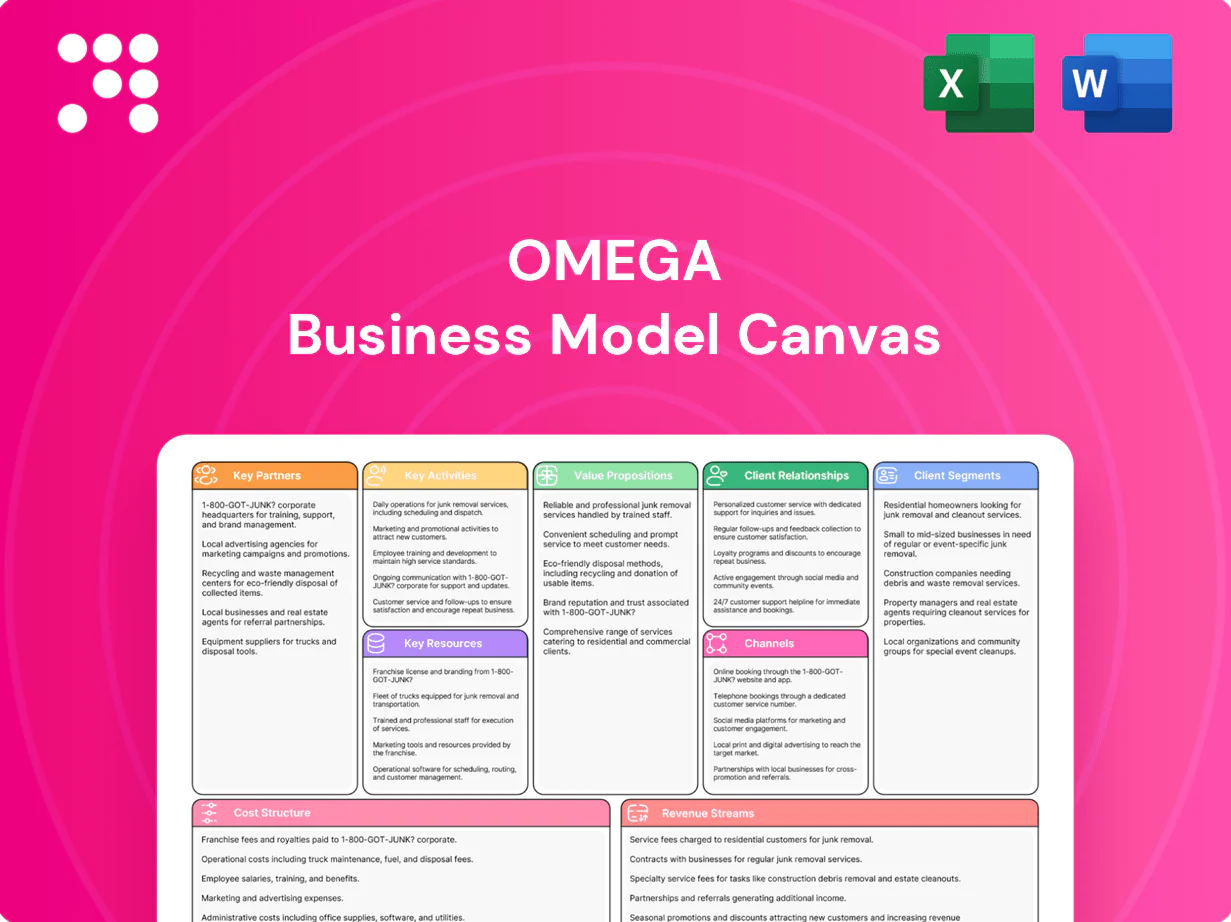
Omega Business Model Canvas

Unlock the complete Business Model Canvas: 3-page blueprint for founders and investors
Unlock Omega’s complete strategic blueprint with the full Business Model Canvas—three concise pages that map value propositions, customer segments, and revenue levers. Ideal for founders, analysts, and investors seeking actionable insights and competitive edge. Purchase the downloadable Word and Excel files to benchmark, adapt, and scale your own strategy today.
Partnerships

Skilled nursing and assisted living operators
Core operating partners lease and operate facilities, driving rent coverage (average coverage ~1.2x) and portfolio occupancy near 78% in 2024. Long-standing ties enable underwriting discipline and aligned incentives across 85% of leased assets. Operator performance data informs renewals, extensions and restructurings, while clinical and operational execution underpins Omega’s cash flows.
Developers and property sellers
Pipeline partners provide access to new builds, sale-leasebacks and portfolio acquisitions, enabling steady roll-out; early engagement often secures pricing and lease terms that reduce cost overruns and shorten time-to-market. Developers tailor designs to operator needs and regulatory standards, improving operational fit and compliance. Anchor and institutional leases commonly span 10–15 years (2024 market practice), supporting predictable portfolio growth and refresh.

Lenders, banks, and bond investors
Debt providers fund acquisitions and refinance maturities at competitive costs, with Omega maintaining a $1.5bn revolving facility and $750m of unsecured notes to support deal activity. Diverse facilities—revolvers, $1.2bn term loans and unsecured notes—enhance liquidity and reduce rollover risk. Strong creditor relationships enabled covenant flexibility during 2024 market stress. Access to capital markets stabilizes growth through cycles.

Regulators and healthcare agencies
Partnerships with state and federal bodies ensure compliance with healthcare and real estate regulations and align Omega with CMS and state licensure requirements; Medicare Advantage enrollment exceeded 29 million in 2024, making payer policy shifts material to revenue. Active engagement helps anticipate reimbursement changes, transparent practices reduce operational and legal risks, and regulatory awareness guides operator selection and monitoring.
- Compliance: align with CMS/state rules
- Reimbursement risk: monitor payer policy shifts (MA>29M in 2024)
- Transparency: lowers audit/legal exposure
- Operator vetting: regulatory history informs selection
Advisors, brokers, and legal/tax partners
Advisors, brokers, and legal/tax partners source deals, provide valuations, and structure tax-efficient transactions; legal counsel drafts leases, mortgages, and remedies to reduce execution risk. Advisory input enhances risk-adjusted returns and speeds execution, while broker networks broaden geographic reach and competitive intelligence—broker listings rose ~12% YoY in 2024, supporting faster deal flow.
- Intermediaries: deal sourcing, valuations
- Legal/tax: leases, mortgages, remedies
- Advisory: risk-adjusted returns, faster execution
- Broker networks: +12% listings (2024), wider reach
Core operators steady cash flow; occupancy 78%, revolver $1.5bn
Core operators drive cash flow stability (avg rent coverage 1.2x; portfolio occupancy 78% in 2024). Capital partners provide liquidity (revolver $1.5bn; unsecured notes $750m) and enable acquisitions. Regulators and payers (Medicare Advantage >29M) shape underwriting and operator selection.
| Partner | Role | 2024 metric |
|---|---|---|
| Operators | Operate/lease | Occupancy 78%/rent cov 1.2x |
| Debt | Liquidity | Revolver $1.5bn; notes $750m |
| Payers/Regs | Policy/compliance | MA >29M |
What is included in the product
 Detailed Word Document
A complete, pre-written Omega Business Model Canvas mapping nine BMC blocks with detailed customer segments, channels, value propositions and revenue streams, plus competitive analysis, SWOT linkage and investor-ready presentation polish.

 Customizable Excel Spreadsheet
Condenses company strategy into a digestible, one-page snapshot with editable cells to save hours of formatting and structuring your own business model, perfect for quick reviews, comparisons, and collaborative brainstorming.
Activities

Underwriting and due diligence
Evaluate operator credit and rent coverage targeting DSCR 1.25–1.4x, analyze payor mix (2024 US median: Medicare 20%, Medicaid 55%, private 25%) and local demand (facility-type occupancy ~78–85% in 2024). Assess property condition, active licenses, and compliance history including citation rates. Stress-test reimbursement cuts (−10% to −20%) and occupancy declines (−10% to −30%). Set lease rent floors, covenants, and parent guarantees aligned to stress scenarios.
Capital allocation and acquisitions
Deploy capital to highest risk-adjusted returns in SNF and assisted living, targeting assets outperforming sector occupancy (senior housing occupancy ~78.1% in 2024 per NIC MAP). Balance acquisitions with dispositions and targeted redevelopments to recycle capital. Time purchases to market conditions and funding costs (10-year UST ~4.7% in 2024) while maintaining geographic and tenant diversification across the portfolio.

Lease structuring and asset management
Negotiate triple-net master leases with 2.5% average annual escalators and security packages; target capex reserves of 2–4% of gross rent. Monitor tenant financials, quality metrics, occupancy >95% and collection rates >98%, and ensure capex compliance. Execute amendments, extensions or market-based rent resets as needed, and enforce remedies or transitions for underperforming assets to protect NAV and cash flow.

Credit and portfolio risk management
Credit and portfolio risk management monitors tenant health and enforces concentration limits, noting US office vacancy stayed above 18% in 2024 which increases rollover risk. Use covenants, guarantees and collateral to mitigate defaults, reposition assets or operators to preserve value, and update reserves and impairment assessments promptly with 2024 valuations.
- Track tenant KPIs and max 25–30% tenant concentration
- Use covenants, guarantees, collateral
- Reposition assets/operators to protect NAV
- Update reserves & impairments quarterly (2024 market marks)
Capital markets and investor relations
Omega manages a staggered debt ladder and liquidity buffers while preserving credit ratings; in 2024 the US policy rate sat at 5.25–5.50%, materially shaping cost of debt and refinancing timing. The company issues equity or hybrid capital when accretive to NAV, actively communicates strategy, guidance and portfolio metrics to investors, and enforces REIT compliance with transparent quarterly reporting.
- debt ladder management
- liquidity buffers & cash coverage
- accretive equity/hybrid issuance
- investor communication & guidance
- REIT compliance & transparent reporting
SNF/AL focus: DSCR 1.25-1.4x, stress -20% rev/-30% occ; payor 20/55/25; NNN leases, 2.5% escal.
Underwrite operator credit to DSCR 1.25–1.4x, stress-test −10% to −20% reimbursement and −10% to −30% occupancy; 2024 US payor mix: Medicare 20%, Medicaid 55%, private 25% and sector occupancy 78.1%. Deploy capital to SNF/AL outperformers, time buys to 10y UST ~4.7% and Fed funds 5.25–5.50%. Enforce triple-net leases with 2.5% escalators, 2–4% capex reserves and max 25–30% tenant concentration.
| KPI | 2024 |
|---|---|
| Payor mix | 20/55/25 |
| Occupancy | 78.1% |
| 10y UST | 4.7% |
Preview Before You Purchase
Business Model Canvas
The Omega Business Model Canvas previewed here is the actual deliverable, not a mockup, and shows the exact layout and content you’ll receive after purchase. When you complete your order you’ll get the full, editable file—formatted and structured identically—ready for presentation, editing, or sharing.

Unlock the complete Business Model Canvas: 3-page blueprint for founders and investors
Unlock Omega’s complete strategic blueprint with the full Business Model Canvas—three concise pages that map value propositions, customer segments, and revenue levers. Ideal for founders, analysts, and investors seeking actionable insights and competitive edge. Purchase the downloadable Word and Excel files to benchmark, adapt, and scale your own strategy today.
Partnerships
Skilled nursing and assisted living operators
Core operating partners lease and operate facilities, driving rent coverage (average coverage ~1.2x) and portfolio occupancy near 78% in 2024. Long-standing ties enable underwriting discipline and aligned incentives across 85% of leased assets. Operator performance data informs renewals, extensions and restructurings, while clinical and operational execution underpins Omega’s cash flows.
Developers and property sellers
Pipeline partners provide access to new builds, sale-leasebacks and portfolio acquisitions, enabling steady roll-out; early engagement often secures pricing and lease terms that reduce cost overruns and shorten time-to-market. Developers tailor designs to operator needs and regulatory standards, improving operational fit and compliance. Anchor and institutional leases commonly span 10–15 years (2024 market practice), supporting predictable portfolio growth and refresh.
Lenders, banks, and bond investors
Debt providers fund acquisitions and refinance maturities at competitive costs, with Omega maintaining a $1.5bn revolving facility and $750m of unsecured notes to support deal activity. Diverse facilities—revolvers, $1.2bn term loans and unsecured notes—enhance liquidity and reduce rollover risk. Strong creditor relationships enabled covenant flexibility during 2024 market stress. Access to capital markets stabilizes growth through cycles.
Regulators and healthcare agencies
Partnerships with state and federal bodies ensure compliance with healthcare and real estate regulations and align Omega with CMS and state licensure requirements; Medicare Advantage enrollment exceeded 29 million in 2024, making payer policy shifts material to revenue. Active engagement helps anticipate reimbursement changes, transparent practices reduce operational and legal risks, and regulatory awareness guides operator selection and monitoring.
- Compliance: align with CMS/state rules
- Reimbursement risk: monitor payer policy shifts (MA>29M in 2024)
- Transparency: lowers audit/legal exposure
- Operator vetting: regulatory history informs selection
Advisors, brokers, and legal/tax partners
Advisors, brokers, and legal/tax partners source deals, provide valuations, and structure tax-efficient transactions; legal counsel drafts leases, mortgages, and remedies to reduce execution risk. Advisory input enhances risk-adjusted returns and speeds execution, while broker networks broaden geographic reach and competitive intelligence—broker listings rose ~12% YoY in 2024, supporting faster deal flow.
- Intermediaries: deal sourcing, valuations
- Legal/tax: leases, mortgages, remedies
- Advisory: risk-adjusted returns, faster execution
- Broker networks: +12% listings (2024), wider reach
Core operators steady cash flow; occupancy 78%, revolver $1.5bn
Core operators drive cash flow stability (avg rent coverage 1.2x; portfolio occupancy 78% in 2024). Capital partners provide liquidity (revolver $1.5bn; unsecured notes $750m) and enable acquisitions. Regulators and payers (Medicare Advantage >29M) shape underwriting and operator selection.
| Partner | Role | 2024 metric |
|---|---|---|
| Operators | Operate/lease | Occupancy 78%/rent cov 1.2x |
| Debt | Liquidity | Revolver $1.5bn; notes $750m |
| Payers/Regs | Policy/compliance | MA >29M |
What is included in the product
Detailed Word Document
A complete, pre-written Omega Business Model Canvas mapping nine BMC blocks with detailed customer segments, channels, value propositions and revenue streams, plus competitive analysis, SWOT linkage and investor-ready presentation polish.
Customizable Excel Spreadsheet
Condenses company strategy into a digestible, one-page snapshot with editable cells to save hours of formatting and structuring your own business model, perfect for quick reviews, comparisons, and collaborative brainstorming.
Activities
Underwriting and due diligence
Evaluate operator credit and rent coverage targeting DSCR 1.25–1.4x, analyze payor mix (2024 US median: Medicare 20%, Medicaid 55%, private 25%) and local demand (facility-type occupancy ~78–85% in 2024). Assess property condition, active licenses, and compliance history including citation rates. Stress-test reimbursement cuts (−10% to −20%) and occupancy declines (−10% to −30%). Set lease rent floors, covenants, and parent guarantees aligned to stress scenarios.
Capital allocation and acquisitions
Deploy capital to highest risk-adjusted returns in SNF and assisted living, targeting assets outperforming sector occupancy (senior housing occupancy ~78.1% in 2024 per NIC MAP). Balance acquisitions with dispositions and targeted redevelopments to recycle capital. Time purchases to market conditions and funding costs (10-year UST ~4.7% in 2024) while maintaining geographic and tenant diversification across the portfolio.
Lease structuring and asset management
Negotiate triple-net master leases with 2.5% average annual escalators and security packages; target capex reserves of 2–4% of gross rent. Monitor tenant financials, quality metrics, occupancy >95% and collection rates >98%, and ensure capex compliance. Execute amendments, extensions or market-based rent resets as needed, and enforce remedies or transitions for underperforming assets to protect NAV and cash flow.
Credit and portfolio risk management
Credit and portfolio risk management monitors tenant health and enforces concentration limits, noting US office vacancy stayed above 18% in 2024 which increases rollover risk. Use covenants, guarantees and collateral to mitigate defaults, reposition assets or operators to preserve value, and update reserves and impairment assessments promptly with 2024 valuations.
- Track tenant KPIs and max 25–30% tenant concentration
- Use covenants, guarantees, collateral
- Reposition assets/operators to protect NAV
- Update reserves & impairments quarterly (2024 market marks)
Capital markets and investor relations
Omega manages a staggered debt ladder and liquidity buffers while preserving credit ratings; in 2024 the US policy rate sat at 5.25–5.50%, materially shaping cost of debt and refinancing timing. The company issues equity or hybrid capital when accretive to NAV, actively communicates strategy, guidance and portfolio metrics to investors, and enforces REIT compliance with transparent quarterly reporting.
- debt ladder management
- liquidity buffers & cash coverage
- accretive equity/hybrid issuance
- investor communication & guidance
- REIT compliance & transparent reporting
SNF/AL focus: DSCR 1.25-1.4x, stress -20% rev/-30% occ; payor 20/55/25; NNN leases, 2.5% escal.
Underwrite operator credit to DSCR 1.25–1.4x, stress-test −10% to −20% reimbursement and −10% to −30% occupancy; 2024 US payor mix: Medicare 20%, Medicaid 55%, private 25% and sector occupancy 78.1%. Deploy capital to SNF/AL outperformers, time buys to 10y UST ~4.7% and Fed funds 5.25–5.50%. Enforce triple-net leases with 2.5% escalators, 2–4% capex reserves and max 25–30% tenant concentration.
| KPI | 2024 |
|---|---|
| Payor mix | 20/55/25 |
| Occupancy | 78.1% |
| 10y UST | 4.7% |
Preview Before You Purchase
Business Model Canvas
The Omega Business Model Canvas previewed here is the actual deliverable, not a mockup, and shows the exact layout and content you’ll receive after purchase. When you complete your order you’ll get the full, editable file—formatted and structured identically—ready for presentation, editing, or sharing.
Original: $10.00
-65%$10.00
$3.50Description
Unlock the complete Business Model Canvas: 3-page blueprint for founders and investors
Unlock Omega’s complete strategic blueprint with the full Business Model Canvas—three concise pages that map value propositions, customer segments, and revenue levers. Ideal for founders, analysts, and investors seeking actionable insights and competitive edge. Purchase the downloadable Word and Excel files to benchmark, adapt, and scale your own strategy today.
Partnerships
Skilled nursing and assisted living operators
Core operating partners lease and operate facilities, driving rent coverage (average coverage ~1.2x) and portfolio occupancy near 78% in 2024. Long-standing ties enable underwriting discipline and aligned incentives across 85% of leased assets. Operator performance data informs renewals, extensions and restructurings, while clinical and operational execution underpins Omega’s cash flows.
Developers and property sellers
Pipeline partners provide access to new builds, sale-leasebacks and portfolio acquisitions, enabling steady roll-out; early engagement often secures pricing and lease terms that reduce cost overruns and shorten time-to-market. Developers tailor designs to operator needs and regulatory standards, improving operational fit and compliance. Anchor and institutional leases commonly span 10–15 years (2024 market practice), supporting predictable portfolio growth and refresh.
Lenders, banks, and bond investors
Debt providers fund acquisitions and refinance maturities at competitive costs, with Omega maintaining a $1.5bn revolving facility and $750m of unsecured notes to support deal activity. Diverse facilities—revolvers, $1.2bn term loans and unsecured notes—enhance liquidity and reduce rollover risk. Strong creditor relationships enabled covenant flexibility during 2024 market stress. Access to capital markets stabilizes growth through cycles.
Regulators and healthcare agencies
Partnerships with state and federal bodies ensure compliance with healthcare and real estate regulations and align Omega with CMS and state licensure requirements; Medicare Advantage enrollment exceeded 29 million in 2024, making payer policy shifts material to revenue. Active engagement helps anticipate reimbursement changes, transparent practices reduce operational and legal risks, and regulatory awareness guides operator selection and monitoring.
- Compliance: align with CMS/state rules
- Reimbursement risk: monitor payer policy shifts (MA>29M in 2024)
- Transparency: lowers audit/legal exposure
- Operator vetting: regulatory history informs selection
Advisors, brokers, and legal/tax partners
Advisors, brokers, and legal/tax partners source deals, provide valuations, and structure tax-efficient transactions; legal counsel drafts leases, mortgages, and remedies to reduce execution risk. Advisory input enhances risk-adjusted returns and speeds execution, while broker networks broaden geographic reach and competitive intelligence—broker listings rose ~12% YoY in 2024, supporting faster deal flow.
- Intermediaries: deal sourcing, valuations
- Legal/tax: leases, mortgages, remedies
- Advisory: risk-adjusted returns, faster execution
- Broker networks: +12% listings (2024), wider reach
Core operators steady cash flow; occupancy 78%, revolver $1.5bn
Core operators drive cash flow stability (avg rent coverage 1.2x; portfolio occupancy 78% in 2024). Capital partners provide liquidity (revolver $1.5bn; unsecured notes $750m) and enable acquisitions. Regulators and payers (Medicare Advantage >29M) shape underwriting and operator selection.
| Partner | Role | 2024 metric |
|---|---|---|
| Operators | Operate/lease | Occupancy 78%/rent cov 1.2x |
| Debt | Liquidity | Revolver $1.5bn; notes $750m |
| Payers/Regs | Policy/compliance | MA >29M |
What is included in the product
Detailed Word Document
A complete, pre-written Omega Business Model Canvas mapping nine BMC blocks with detailed customer segments, channels, value propositions and revenue streams, plus competitive analysis, SWOT linkage and investor-ready presentation polish.
Customizable Excel Spreadsheet
Condenses company strategy into a digestible, one-page snapshot with editable cells to save hours of formatting and structuring your own business model, perfect for quick reviews, comparisons, and collaborative brainstorming.
Activities
Underwriting and due diligence
Evaluate operator credit and rent coverage targeting DSCR 1.25–1.4x, analyze payor mix (2024 US median: Medicare 20%, Medicaid 55%, private 25%) and local demand (facility-type occupancy ~78–85% in 2024). Assess property condition, active licenses, and compliance history including citation rates. Stress-test reimbursement cuts (−10% to −20%) and occupancy declines (−10% to −30%). Set lease rent floors, covenants, and parent guarantees aligned to stress scenarios.
Capital allocation and acquisitions
Deploy capital to highest risk-adjusted returns in SNF and assisted living, targeting assets outperforming sector occupancy (senior housing occupancy ~78.1% in 2024 per NIC MAP). Balance acquisitions with dispositions and targeted redevelopments to recycle capital. Time purchases to market conditions and funding costs (10-year UST ~4.7% in 2024) while maintaining geographic and tenant diversification across the portfolio.
Lease structuring and asset management
Negotiate triple-net master leases with 2.5% average annual escalators and security packages; target capex reserves of 2–4% of gross rent. Monitor tenant financials, quality metrics, occupancy >95% and collection rates >98%, and ensure capex compliance. Execute amendments, extensions or market-based rent resets as needed, and enforce remedies or transitions for underperforming assets to protect NAV and cash flow.
Credit and portfolio risk management
Credit and portfolio risk management monitors tenant health and enforces concentration limits, noting US office vacancy stayed above 18% in 2024 which increases rollover risk. Use covenants, guarantees and collateral to mitigate defaults, reposition assets or operators to preserve value, and update reserves and impairment assessments promptly with 2024 valuations.
- Track tenant KPIs and max 25–30% tenant concentration
- Use covenants, guarantees, collateral
- Reposition assets/operators to protect NAV
- Update reserves & impairments quarterly (2024 market marks)
Capital markets and investor relations
Omega manages a staggered debt ladder and liquidity buffers while preserving credit ratings; in 2024 the US policy rate sat at 5.25–5.50%, materially shaping cost of debt and refinancing timing. The company issues equity or hybrid capital when accretive to NAV, actively communicates strategy, guidance and portfolio metrics to investors, and enforces REIT compliance with transparent quarterly reporting.
- debt ladder management
- liquidity buffers & cash coverage
- accretive equity/hybrid issuance
- investor communication & guidance
- REIT compliance & transparent reporting
SNF/AL focus: DSCR 1.25-1.4x, stress -20% rev/-30% occ; payor 20/55/25; NNN leases, 2.5% escal.
Underwrite operator credit to DSCR 1.25–1.4x, stress-test −10% to −20% reimbursement and −10% to −30% occupancy; 2024 US payor mix: Medicare 20%, Medicaid 55%, private 25% and sector occupancy 78.1%. Deploy capital to SNF/AL outperformers, time buys to 10y UST ~4.7% and Fed funds 5.25–5.50%. Enforce triple-net leases with 2.5% escalators, 2–4% capex reserves and max 25–30% tenant concentration.
| KPI | 2024 |
|---|---|
| Payor mix | 20/55/25 |
| Occupancy | 78.1% |
| 10y UST | 4.7% |
Preview Before You Purchase
Business Model Canvas
The Omega Business Model Canvas previewed here is the actual deliverable, not a mockup, and shows the exact layout and content you’ll receive after purchase. When you complete your order you’ll get the full, editable file—formatted and structured identically—ready for presentation, editing, or sharing.











