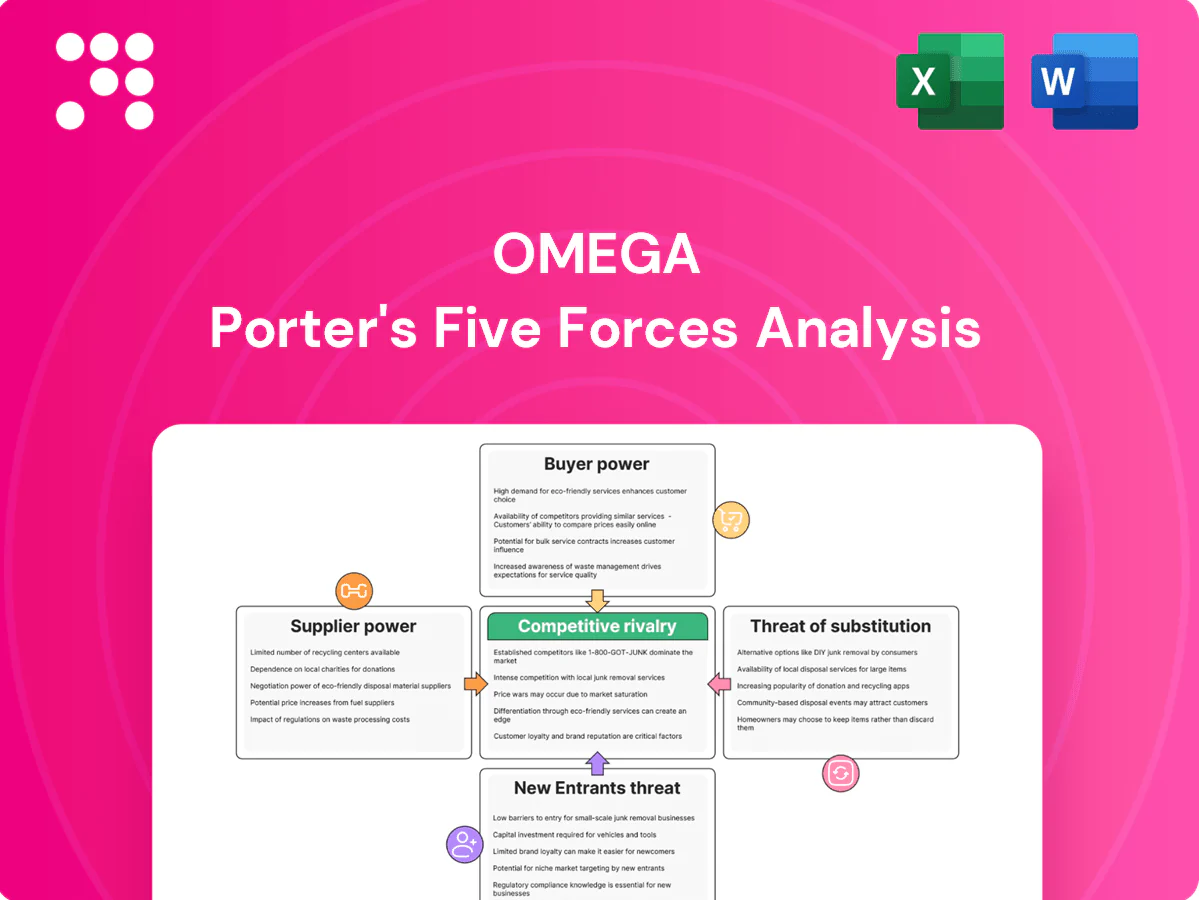
Omega Porter's Five Forces Analysis

Go Beyond the Preview—Access the Full Strategic Report
Omega’s Porter’s Five Forces snapshot highlights competitive intensity, supplier and buyer leverage, and threats from substitutes and entrants, revealing where strategic pressure points lie. This brief overview points to key risks and advantages but only scratches the surface. Unlock the full Porter’s Five Forces Analysis to explore Omega’s competitive dynamics, market pressures, and strategic advantages in detail.
Suppliers Bargaining Power

Dependence on capital markets
Omega relies heavily on debt and equity markets to fund acquisitions and development, with 2024 global investment-grade yields averaging about 4.8% and leveraged loan spreads remaining elevated, giving lenders pricing power. Lenders and bond investors influence through interest pricing, covenants and capital availability, and tight credit cycles in 2024 constrained deal activity and raised borrowing costs. Access to low-cost capital materially reduces supplier leverage and boosts returns on invested capital.
Limited pipeline of quality assets
High-quality skilled nursing and assisted living properties are finite and often tightly held, with NIC MAP reporting skilled nursing occupancy near 75% in 2024, keeping supply constrained. Sellers and developers command price premiums; CBRE reported seniors housing cap rates around 6.5% in 2024, compressing spreads in competitive bids. Longstanding sourcing relationships can mitigate scarcity power.

Regulatory and licensure gatekeepers
State licensing, Certificate of Need regimes (active in 36 states as of 2024) and healthcare approvals act as quasi-suppliers of capacity; denials or 6–18 month approval delays routinely stall transactions and renovations, raising project costs by roughly 10–25%. That elevates the bargaining position of regulatory consultants and agencies indirectly. Experienced compliance teams can cut timeline risk and materially reduce contingency reserves.

Construction, renovation, and maintenance vendors
Capex-heavy upgrades hinge on contractor availability and materials costs; construction input prices rose about 5% YoY in 2024 and construction wages rose ~4% YoY, giving vendors pricing power and timeline leverage that can extend schedules by weeks to months.
- Bulk procurement: often secures 5–10% price reductions
- Preferred vendor agreements: reduce lead times
- Project phasing: limits single-point exposure
- Contingency budgeting: typically 10–15% of capex
Insurance and essential services
Property insurance, utilities and taxes are often passed through to tenants but still affect asset viability; in 2024 hard insurance markets drove some healthcare property premiums up as much as 25–30%, squeezing margins. Providers of these services gain leverage during constrained periods, raising costs or tightening terms. Diversification of suppliers and risk engineering (loss control, resiliency upgrades) can temper cost escalation and limit rate exposure.
- property-insurance: premiums up to 25–30% in hard 2024 markets
- utilities-taxes: can add 5–15% to operating costs
- mitigation: diversification, risk engineering, captive/POE programs
Concentrated supplier power: capital costs 4.8%, SN occupancy 75%, CON in 36 states
Omega faces concentrated supplier power: capital providers (IG yields ~4.8% in 2024) set financing costs and covenants; scarce high-quality seniors assets (skilled nursing occupancy ~75% in 2024) push seller pricing; regulatory approvals (CON in 36 states) and construction/service vendors raise delays and capex by ~10–25% and materials/wages ~4–5% YoY, increasing deal risk and pricing.
| Supplier | 2024 metric | Typical impact |
|---|---|---|
| Capital markets | IG yield 4.8% | Higher borrowing costs, tighter covenants |
| Seniors housing supply | SN occupancy ~75% | Price premiums, compressed cap-rate spreads |
| Regulatory/permits | CON in 36 states | Approval delays → +10–25% project costs |
What is included in the product
 Detailed Word Document
Comprehensive Porter's Five Forces analysis for Omega, identifying competitive intensity, buyer and supplier power, threat of substitutes and new entrants, and strategic implications backed by industry data to assess pricing, profitability, and defensibility.

 Customizable Excel Spreadsheet
Omega's Porter's Five Forces delivers a clean one-sheet summary and interactive spider chart to instantly quantify competitive pressure, with customizable inputs, duplicate scenario tabs, no macros, and easy export to decks or Word—so teams can quickly diagnose and act on strategic threats without technical friction.
Customers Bargaining Power

Concentrated operator base
Omega’s tenant base is concentrated in skilled nursing and assisted living, where top tenants can drive negotiation leverage—industry data in 2024 show skilled nursing occupancy around 78.5% and REIT exposures often see top-five operators representing roughly 30–40% of ABR. Omega mitigates this via geographic and operator diversification, master leases and rigorous credit underwriting with security packages to limit tenant leverage.
Reimbursement-driven economics
Operators’ cash flows hinge on Medicare, Medicaid and payer mix, which together fund roughly two-thirds of US long‑term care revenues (≈66% in 2024), concentrating buyer leverage on payers. Policy shifts—rate freezes or cuts—can compress margins and drive tenants to demand rent relief, raising buyer power in downturns. Including coverage covenants and minimum reimbursement thresholds in leases preserves landlord cash flow and limits tenant leverage.

High switching and relocation costs
Operators face high exit and relocation costs—licenses, staff redeployment and resident transfers—that limit customers ability to credibly walk away; CMS reports about 15,200 US nursing homes and national occupancy near 78% in 2024, reinforcing lock-in. In distress the credible threat of default or insolvency can still force renegotiation with payors or owners. Robust replacement-operator networks and consolidated regional chains, however, mitigate that leverage by enabling smoother transfers.

Alternative funding options
Operators can pursue bank loans, HUD programs, private credit, or sale-leasebacks with rivals; broad access to alternatives (private credit AUM ~1.5 trillion in 2024, Preqin) increases buyer leverage over financing terms. When credit tightens, Omega’s relative pricing and covenant position strengthens, so competitive pricing must reflect risk-adjusted alternatives.
- Alternatives: bank, HUD, private credit, sale-leaseback
- 2024 signal: private credit AUM ~1.5T (Preqin)
- Tighter credit → strengthens Omega
- Price must be risk-adjusted vs alternatives
Lease structure and covenants
Triple-net, long-duration leases with master lease cross-defaults—median single-tenant NNN term ~10 years in 2024—substantially reduce tenant leverage. Security deposits (commonly ~3 months), guarantees and coverage tests (DSCR ≈1.2x) limit renegotiation. Covenant breaches, however, can still trigger restructurings. Proactive asset management preserves cash flows and bargaining position.
- Lease term: median ~10 years (2024)
- Security deposit: ~3 months
- Coverage test: DSCR ≈1.2x
- Cross-defaults reduce tenant leverage
Operator leverage vs payer power: 78.5% occupancy, ≈66% payer share
Tenant concentration (top-5 ~30–40% ABR) and skilled-nursing occupancy ~78.5% (2024) give operators negotiation leverage, but payer funding ≈66% of revenues concentrates buyer power. Long NNN leases (median ~10y), security deposits (~3 months) and DSCR tests (~1.2x) limit renegotiation; private credit alternatives (AUM ≈1.5T, 2024) raise tenant bargaining in good credit markets.
| Metric | 2024 Value |
|---|---|
| Skilled-nursing occupancy | 78.5% |
| Top-5 operator share (ABR) | 30–40% |
| Payer funding of revenues | ≈66% |
| Median NNN lease | 10 years |
| Security deposit | ~3 months |
| DSCR covenant | ≈1.2x |
| Private credit AUM | ~$1.5T |
Full Version Awaits
Omega Porter's Five Forces Analysis
This preview shows the exact Omega Porter's Five Forces Analysis you'll receive immediately after purchase—no placeholders or mockups. The analysis is fully formatted, professionally written, and ready for immediate download and use. What you see here is the complete deliverable, available to you instantly after payment.

Go Beyond the Preview—Access the Full Strategic Report
Omega’s Porter’s Five Forces snapshot highlights competitive intensity, supplier and buyer leverage, and threats from substitutes and entrants, revealing where strategic pressure points lie. This brief overview points to key risks and advantages but only scratches the surface. Unlock the full Porter’s Five Forces Analysis to explore Omega’s competitive dynamics, market pressures, and strategic advantages in detail.
Suppliers Bargaining Power
Dependence on capital markets
Omega relies heavily on debt and equity markets to fund acquisitions and development, with 2024 global investment-grade yields averaging about 4.8% and leveraged loan spreads remaining elevated, giving lenders pricing power. Lenders and bond investors influence through interest pricing, covenants and capital availability, and tight credit cycles in 2024 constrained deal activity and raised borrowing costs. Access to low-cost capital materially reduces supplier leverage and boosts returns on invested capital.
Limited pipeline of quality assets
High-quality skilled nursing and assisted living properties are finite and often tightly held, with NIC MAP reporting skilled nursing occupancy near 75% in 2024, keeping supply constrained. Sellers and developers command price premiums; CBRE reported seniors housing cap rates around 6.5% in 2024, compressing spreads in competitive bids. Longstanding sourcing relationships can mitigate scarcity power.
Regulatory and licensure gatekeepers
State licensing, Certificate of Need regimes (active in 36 states as of 2024) and healthcare approvals act as quasi-suppliers of capacity; denials or 6–18 month approval delays routinely stall transactions and renovations, raising project costs by roughly 10–25%. That elevates the bargaining position of regulatory consultants and agencies indirectly. Experienced compliance teams can cut timeline risk and materially reduce contingency reserves.
Construction, renovation, and maintenance vendors
Capex-heavy upgrades hinge on contractor availability and materials costs; construction input prices rose about 5% YoY in 2024 and construction wages rose ~4% YoY, giving vendors pricing power and timeline leverage that can extend schedules by weeks to months.
- Bulk procurement: often secures 5–10% price reductions
- Preferred vendor agreements: reduce lead times
- Project phasing: limits single-point exposure
- Contingency budgeting: typically 10–15% of capex
Insurance and essential services
Property insurance, utilities and taxes are often passed through to tenants but still affect asset viability; in 2024 hard insurance markets drove some healthcare property premiums up as much as 25–30%, squeezing margins. Providers of these services gain leverage during constrained periods, raising costs or tightening terms. Diversification of suppliers and risk engineering (loss control, resiliency upgrades) can temper cost escalation and limit rate exposure.
- property-insurance: premiums up to 25–30% in hard 2024 markets
- utilities-taxes: can add 5–15% to operating costs
- mitigation: diversification, risk engineering, captive/POE programs
Concentrated supplier power: capital costs 4.8%, SN occupancy 75%, CON in 36 states
Omega faces concentrated supplier power: capital providers (IG yields ~4.8% in 2024) set financing costs and covenants; scarce high-quality seniors assets (skilled nursing occupancy ~75% in 2024) push seller pricing; regulatory approvals (CON in 36 states) and construction/service vendors raise delays and capex by ~10–25% and materials/wages ~4–5% YoY, increasing deal risk and pricing.
| Supplier | 2024 metric | Typical impact |
|---|---|---|
| Capital markets | IG yield 4.8% | Higher borrowing costs, tighter covenants |
| Seniors housing supply | SN occupancy ~75% | Price premiums, compressed cap-rate spreads |
| Regulatory/permits | CON in 36 states | Approval delays → +10–25% project costs |
What is included in the product
Detailed Word Document
Comprehensive Porter's Five Forces analysis for Omega, identifying competitive intensity, buyer and supplier power, threat of substitutes and new entrants, and strategic implications backed by industry data to assess pricing, profitability, and defensibility.
Customizable Excel Spreadsheet
Omega's Porter's Five Forces delivers a clean one-sheet summary and interactive spider chart to instantly quantify competitive pressure, with customizable inputs, duplicate scenario tabs, no macros, and easy export to decks or Word—so teams can quickly diagnose and act on strategic threats without technical friction.
Customers Bargaining Power
Concentrated operator base
Omega’s tenant base is concentrated in skilled nursing and assisted living, where top tenants can drive negotiation leverage—industry data in 2024 show skilled nursing occupancy around 78.5% and REIT exposures often see top-five operators representing roughly 30–40% of ABR. Omega mitigates this via geographic and operator diversification, master leases and rigorous credit underwriting with security packages to limit tenant leverage.
Reimbursement-driven economics
Operators’ cash flows hinge on Medicare, Medicaid and payer mix, which together fund roughly two-thirds of US long‑term care revenues (≈66% in 2024), concentrating buyer leverage on payers. Policy shifts—rate freezes or cuts—can compress margins and drive tenants to demand rent relief, raising buyer power in downturns. Including coverage covenants and minimum reimbursement thresholds in leases preserves landlord cash flow and limits tenant leverage.
High switching and relocation costs
Operators face high exit and relocation costs—licenses, staff redeployment and resident transfers—that limit customers ability to credibly walk away; CMS reports about 15,200 US nursing homes and national occupancy near 78% in 2024, reinforcing lock-in. In distress the credible threat of default or insolvency can still force renegotiation with payors or owners. Robust replacement-operator networks and consolidated regional chains, however, mitigate that leverage by enabling smoother transfers.
Alternative funding options
Operators can pursue bank loans, HUD programs, private credit, or sale-leasebacks with rivals; broad access to alternatives (private credit AUM ~1.5 trillion in 2024, Preqin) increases buyer leverage over financing terms. When credit tightens, Omega’s relative pricing and covenant position strengthens, so competitive pricing must reflect risk-adjusted alternatives.
- Alternatives: bank, HUD, private credit, sale-leaseback
- 2024 signal: private credit AUM ~1.5T (Preqin)
- Tighter credit → strengthens Omega
- Price must be risk-adjusted vs alternatives
Lease structure and covenants
Triple-net, long-duration leases with master lease cross-defaults—median single-tenant NNN term ~10 years in 2024—substantially reduce tenant leverage. Security deposits (commonly ~3 months), guarantees and coverage tests (DSCR ≈1.2x) limit renegotiation. Covenant breaches, however, can still trigger restructurings. Proactive asset management preserves cash flows and bargaining position.
- Lease term: median ~10 years (2024)
- Security deposit: ~3 months
- Coverage test: DSCR ≈1.2x
- Cross-defaults reduce tenant leverage
Operator leverage vs payer power: 78.5% occupancy, ≈66% payer share
Tenant concentration (top-5 ~30–40% ABR) and skilled-nursing occupancy ~78.5% (2024) give operators negotiation leverage, but payer funding ≈66% of revenues concentrates buyer power. Long NNN leases (median ~10y), security deposits (~3 months) and DSCR tests (~1.2x) limit renegotiation; private credit alternatives (AUM ≈1.5T, 2024) raise tenant bargaining in good credit markets.
| Metric | 2024 Value |
|---|---|
| Skilled-nursing occupancy | 78.5% |
| Top-5 operator share (ABR) | 30–40% |
| Payer funding of revenues | ≈66% |
| Median NNN lease | 10 years |
| Security deposit | ~3 months |
| DSCR covenant | ≈1.2x |
| Private credit AUM | ~$1.5T |
Full Version Awaits
Omega Porter's Five Forces Analysis
This preview shows the exact Omega Porter's Five Forces Analysis you'll receive immediately after purchase—no placeholders or mockups. The analysis is fully formatted, professionally written, and ready for immediate download and use. What you see here is the complete deliverable, available to you instantly after payment.
Description
Go Beyond the Preview—Access the Full Strategic Report
Omega’s Porter’s Five Forces snapshot highlights competitive intensity, supplier and buyer leverage, and threats from substitutes and entrants, revealing where strategic pressure points lie. This brief overview points to key risks and advantages but only scratches the surface. Unlock the full Porter’s Five Forces Analysis to explore Omega’s competitive dynamics, market pressures, and strategic advantages in detail.
Suppliers Bargaining Power
Dependence on capital markets
Omega relies heavily on debt and equity markets to fund acquisitions and development, with 2024 global investment-grade yields averaging about 4.8% and leveraged loan spreads remaining elevated, giving lenders pricing power. Lenders and bond investors influence through interest pricing, covenants and capital availability, and tight credit cycles in 2024 constrained deal activity and raised borrowing costs. Access to low-cost capital materially reduces supplier leverage and boosts returns on invested capital.
Limited pipeline of quality assets
High-quality skilled nursing and assisted living properties are finite and often tightly held, with NIC MAP reporting skilled nursing occupancy near 75% in 2024, keeping supply constrained. Sellers and developers command price premiums; CBRE reported seniors housing cap rates around 6.5% in 2024, compressing spreads in competitive bids. Longstanding sourcing relationships can mitigate scarcity power.
Regulatory and licensure gatekeepers
State licensing, Certificate of Need regimes (active in 36 states as of 2024) and healthcare approvals act as quasi-suppliers of capacity; denials or 6–18 month approval delays routinely stall transactions and renovations, raising project costs by roughly 10–25%. That elevates the bargaining position of regulatory consultants and agencies indirectly. Experienced compliance teams can cut timeline risk and materially reduce contingency reserves.
Construction, renovation, and maintenance vendors
Capex-heavy upgrades hinge on contractor availability and materials costs; construction input prices rose about 5% YoY in 2024 and construction wages rose ~4% YoY, giving vendors pricing power and timeline leverage that can extend schedules by weeks to months.
- Bulk procurement: often secures 5–10% price reductions
- Preferred vendor agreements: reduce lead times
- Project phasing: limits single-point exposure
- Contingency budgeting: typically 10–15% of capex
Insurance and essential services
Property insurance, utilities and taxes are often passed through to tenants but still affect asset viability; in 2024 hard insurance markets drove some healthcare property premiums up as much as 25–30%, squeezing margins. Providers of these services gain leverage during constrained periods, raising costs or tightening terms. Diversification of suppliers and risk engineering (loss control, resiliency upgrades) can temper cost escalation and limit rate exposure.
- property-insurance: premiums up to 25–30% in hard 2024 markets
- utilities-taxes: can add 5–15% to operating costs
- mitigation: diversification, risk engineering, captive/POE programs
Concentrated supplier power: capital costs 4.8%, SN occupancy 75%, CON in 36 states
Omega faces concentrated supplier power: capital providers (IG yields ~4.8% in 2024) set financing costs and covenants; scarce high-quality seniors assets (skilled nursing occupancy ~75% in 2024) push seller pricing; regulatory approvals (CON in 36 states) and construction/service vendors raise delays and capex by ~10–25% and materials/wages ~4–5% YoY, increasing deal risk and pricing.
| Supplier | 2024 metric | Typical impact |
|---|---|---|
| Capital markets | IG yield 4.8% | Higher borrowing costs, tighter covenants |
| Seniors housing supply | SN occupancy ~75% | Price premiums, compressed cap-rate spreads |
| Regulatory/permits | CON in 36 states | Approval delays → +10–25% project costs |
What is included in the product
Detailed Word Document
Comprehensive Porter's Five Forces analysis for Omega, identifying competitive intensity, buyer and supplier power, threat of substitutes and new entrants, and strategic implications backed by industry data to assess pricing, profitability, and defensibility.
Customizable Excel Spreadsheet
Omega's Porter's Five Forces delivers a clean one-sheet summary and interactive spider chart to instantly quantify competitive pressure, with customizable inputs, duplicate scenario tabs, no macros, and easy export to decks or Word—so teams can quickly diagnose and act on strategic threats without technical friction.
Customers Bargaining Power
Concentrated operator base
Omega’s tenant base is concentrated in skilled nursing and assisted living, where top tenants can drive negotiation leverage—industry data in 2024 show skilled nursing occupancy around 78.5% and REIT exposures often see top-five operators representing roughly 30–40% of ABR. Omega mitigates this via geographic and operator diversification, master leases and rigorous credit underwriting with security packages to limit tenant leverage.
Reimbursement-driven economics
Operators’ cash flows hinge on Medicare, Medicaid and payer mix, which together fund roughly two-thirds of US long‑term care revenues (≈66% in 2024), concentrating buyer leverage on payers. Policy shifts—rate freezes or cuts—can compress margins and drive tenants to demand rent relief, raising buyer power in downturns. Including coverage covenants and minimum reimbursement thresholds in leases preserves landlord cash flow and limits tenant leverage.
High switching and relocation costs
Operators face high exit and relocation costs—licenses, staff redeployment and resident transfers—that limit customers ability to credibly walk away; CMS reports about 15,200 US nursing homes and national occupancy near 78% in 2024, reinforcing lock-in. In distress the credible threat of default or insolvency can still force renegotiation with payors or owners. Robust replacement-operator networks and consolidated regional chains, however, mitigate that leverage by enabling smoother transfers.
Alternative funding options
Operators can pursue bank loans, HUD programs, private credit, or sale-leasebacks with rivals; broad access to alternatives (private credit AUM ~1.5 trillion in 2024, Preqin) increases buyer leverage over financing terms. When credit tightens, Omega’s relative pricing and covenant position strengthens, so competitive pricing must reflect risk-adjusted alternatives.
- Alternatives: bank, HUD, private credit, sale-leaseback
- 2024 signal: private credit AUM ~1.5T (Preqin)
- Tighter credit → strengthens Omega
- Price must be risk-adjusted vs alternatives
Lease structure and covenants
Triple-net, long-duration leases with master lease cross-defaults—median single-tenant NNN term ~10 years in 2024—substantially reduce tenant leverage. Security deposits (commonly ~3 months), guarantees and coverage tests (DSCR ≈1.2x) limit renegotiation. Covenant breaches, however, can still trigger restructurings. Proactive asset management preserves cash flows and bargaining position.
- Lease term: median ~10 years (2024)
- Security deposit: ~3 months
- Coverage test: DSCR ≈1.2x
- Cross-defaults reduce tenant leverage
Operator leverage vs payer power: 78.5% occupancy, ≈66% payer share
Tenant concentration (top-5 ~30–40% ABR) and skilled-nursing occupancy ~78.5% (2024) give operators negotiation leverage, but payer funding ≈66% of revenues concentrates buyer power. Long NNN leases (median ~10y), security deposits (~3 months) and DSCR tests (~1.2x) limit renegotiation; private credit alternatives (AUM ≈1.5T, 2024) raise tenant bargaining in good credit markets.
| Metric | 2024 Value |
|---|---|
| Skilled-nursing occupancy | 78.5% |
| Top-5 operator share (ABR) | 30–40% |
| Payer funding of revenues | ≈66% |
| Median NNN lease | 10 years |
| Security deposit | ~3 months |
| DSCR covenant | ≈1.2x |
| Private credit AUM | ~$1.5T |
Full Version Awaits
Omega Porter's Five Forces Analysis
This preview shows the exact Omega Porter's Five Forces Analysis you'll receive immediately after purchase—no placeholders or mockups. The analysis is fully formatted, professionally written, and ready for immediate download and use. What you see here is the complete deliverable, available to you instantly after payment.











