One Call Porter's Five Forces Analysis

Go Beyond the Preview—Access the Full Strategic Report
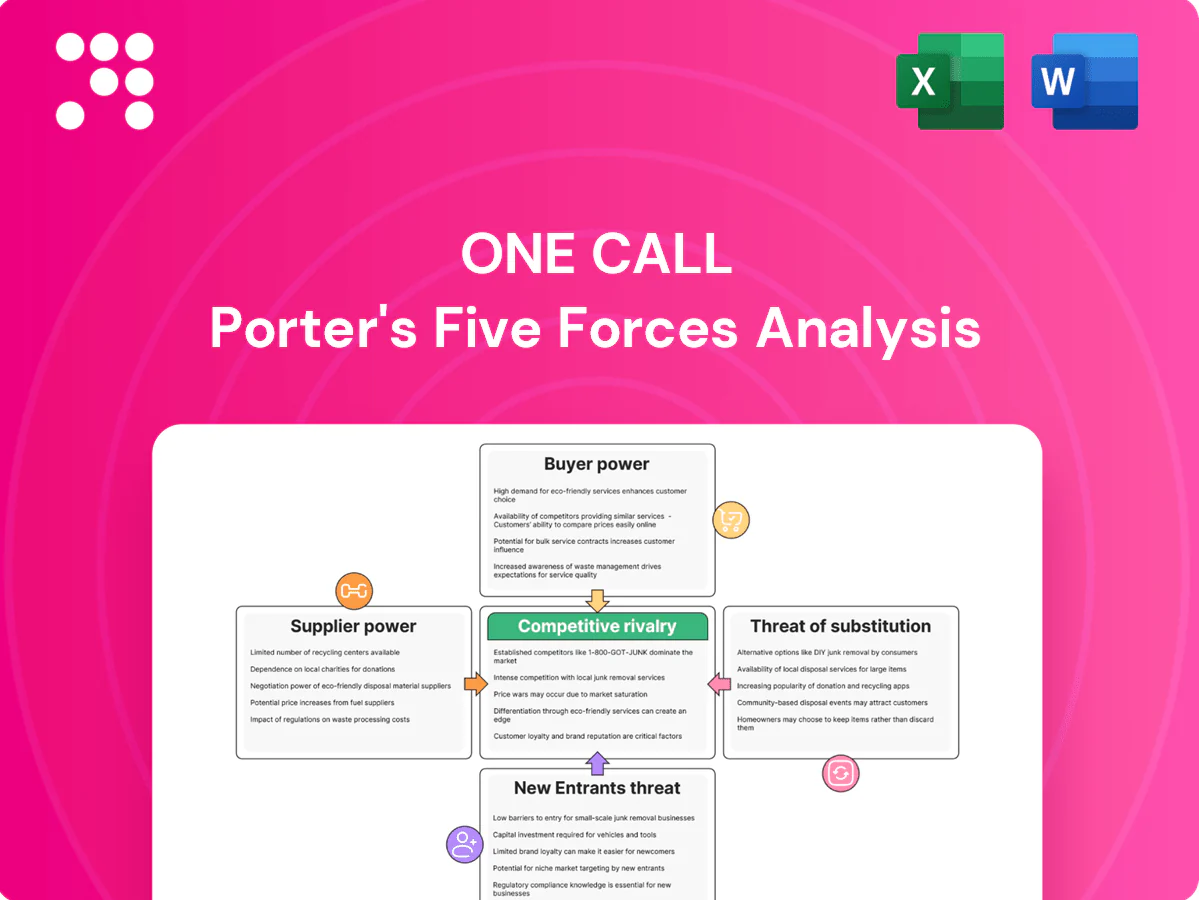
This concise Porter's Five Forces snapshot for One Call highlights buyer power, supplier influence, rivalry, threat of entrants, and substitutes, revealing competitive pressure points. This brief preview only scratches the surface—unlock the full report for force-by-force ratings, visuals, and strategic implications tailored to One Call. Get the consultant-grade analysis in Excel and Word formats to inform investment or strategy decisions.
Suppliers Bargaining Power

Fragmented provider base limits leverage
Most suppliers—PT clinics, imaging centers, DME, transportation and home health agencies—are highly fragmented (over 200,000 licensed physical therapists in the US in 2024), which limits individual bargaining power. One Call can shift volume across thousands of credentialed providers to secure favorable rates. Local scarcity in rural areas (affecting roughly 20% of counties) or specialty modalities can elevate supplier leverage. Overall, diversification dampens pricing pressure from any single vendor.
Volume aggregation creates preferred rates
Aggregating payer demand allows One Call to negotiate tiered discounts and priority scheduling by offering providers committed volumes, steerage, and centralized referrals that lower providers’ unit costs. In exchange One Call enforces SLAs and quality metrics, shifting operational risk to suppliers. Over time this scale advantage reduces suppliers’ pricing power and increases One Call’s leverage in contract renewals.

Switching costs moderate but manageable
Vendor transitions require re-credentialing (often 30–60 days), data-exchange setup and workflow changes, creating moderate switching frictions; however, standardized contracts and broad provider networks in 2024 make replacements feasible. Performance scorecards and pay-for-performance clauses enable pruning underperformers, containing supplier opportunism and preserving negotiating leverage.

Regulatory reimbursement floors cap upside
State workers’ comp fee schedules and utilization rules — maintained by over 30 states in 2024 — cap provider price ceilings and anchor negotiations despite market pressure for discounts. Prior authorization and evidence-based guidelines limit visit counts, so providers resist deep cuts but cannot expand volume-driven revenue. Net effect: constrained supplier margin expansion.
- Regulated benchmarks: fee schedules anchor rates
- Utilization rules: limit visit/volume growth
- Prior authorization: reduces unnecessary services
Specialist scarcity pockets raise leverage
Highly specialized services—complex imaging, pain specialists, catastrophic home health—are often capacity constrained, giving providers scheduling priority and stronger commercial terms; BLS projects 21% growth for home health aides 2022–32, underscoring persistent demand pressure. One Call mitigates with multi-regional panels and outcome-based contracting, but local or episodic scarcity still elevates supplier leverage.
- Specialist scarcity: higher local leverage
- Demand trend: BLS 21% growth (2022–32)
- Mitigation: multi-regional panels
- Contracting: outcome-based terms
Scale and aggregated demand reduce supplier pricing power in a fragmented PT market
Suppliers are highly fragmented (≈200,000 licensed PTs in US, 2024), limiting single-vendor leverage, though ~20% of counties face local scarcity. State fee schedules (30+ states) and utilization rules cap rates; re-credentialing takes 30–60 days. Scale and aggregated demand let One Call secure tiered discounts and enforce SLAs, reducing supplier pricing power over time.
| Metric | Value | Impact |
|---|---|---|
| PTs (2024) | ≈200,000 | Low individual power |
| Rural counties | ≈20% | Higher local leverage |
| States w/ fee schedules | 30+ | Rate caps |
What is included in the product
 Detailed Word Document
Tailored Porter’s Five Forces analysis for One Call that uncovers competitive intensity, customer and supplier power, substitution threats, and entry barriers to assess strategic vulnerability and profit potential.

 Customizable Excel Spreadsheet
A single-sheet, customizable Five Forces tool that converts complex competitive dynamics into a clear radar chart and copy-ready visuals—no macros, easy to integrate into decks or dashboards.
Customers Bargaining Power

Consolidated payers exert pricing pressure
Large insurers, TPAs, and self-insured employers negotiate enterprise contracts and RFPs, with the top five payers accounting for roughly 60% of commercial enrollment in 2024, enabling extensive rate benchmarking and stringent SLAs. Their scale forces providers to accept performance-linked pricing and deliverables; 67% of large employers self-fund health plans, increasing buyer sophistication. Buyers demand measurable savings and outcomes reporting, heightening leverage on price and performance.
Outcome and compliance demands tighten terms
Buyers now demand demonstrable medical cost containment, faster return-to-work and strict guideline adherence, with contracts in 2024 increasingly embedding outcome metrics, denial management and audit rights. Failure to meet benchmarks can trigger rebates (commonly 5–15%) or reallocation of 20–40% of volumes in contracted networks. These enforcement tools amplify buyer power well beyond price alone.

Integration and workflow switching costs
Deep integrations into claims platforms, eligibility, and bill review create strong stickiness by embedding One Call into payer workflows. Training adjusters and aligning clinical workflows generate tangible switching frictions that raise operational costs and time to migrate. Rich data interfaces and historical analytics add lock-in value, together partially offsetting buyer bargaining power.

Multi-sourcing and carve-outs
- Multi-sourcing preserves competitive tension
- Steerage enables rapid volume shifts
- Continuous pressure on pricing and service
- 2024 carve-outs raise buyer leverage
Insourcing and direct contracting options
Larger payers can build internal networks or contract directly with providers, and in 2024 the top five US payers account for roughly two-thirds of commercial lives while Medicare Advantage enrollment exceeded 30 million, increasing payers' leverage. Use of existing medical networks or MPNs enables bypassing intermediaries, putting downward pressure on vendor margins. One Call must differentiate on breadth, measurable outcomes and ease-of-use to retain share.
- Top payers ≈ 65% market share (top 5)
- Medicare Advantage >30M enrollees (2024)
- Insourcing threatens vendor margins
- Differentiators: breadth, outcomes, UX
Buyers control care: top-5 cover 60-65%; MA >30M
Buyers (top payers, TPAs, self-funded employers) hold strong leverage—top-5 payers cover ~60–65% commercial lives in 2024 and Medicare Advantage >30M enrollees—forcing performance-linked pricing and SLAs. Typical enforcement includes 5–15% rebates and 20–40% volume reallocation; multi-sourcing and deep integrations create partial offsetting lock-in.
| Metric | 2024 |
|---|---|
| Top-5 commercial share | 60–65% |
| Medicare Advantage | >30M enrollees |
| Large employers self-fund | 67% |
| Common rebates | 5–15% |
| Volume reallocation | 20–40% |
Preview Before You Purchase
One Call Porter's Five Forces Analysis
This preview shows the exact One Call Porter's Five Forces Analysis you'll receive—no samples or placeholders. The document is fully formatted, professionally written and ready for immediate download after purchase. What you see here is precisely the deliverable you'll get.

Go Beyond the Preview—Access the Full Strategic Report
This concise Porter's Five Forces snapshot for One Call highlights buyer power, supplier influence, rivalry, threat of entrants, and substitutes, revealing competitive pressure points. This brief preview only scratches the surface—unlock the full report for force-by-force ratings, visuals, and strategic implications tailored to One Call. Get the consultant-grade analysis in Excel and Word formats to inform investment or strategy decisions.
Suppliers Bargaining Power
Fragmented provider base limits leverage
Most suppliers—PT clinics, imaging centers, DME, transportation and home health agencies—are highly fragmented (over 200,000 licensed physical therapists in the US in 2024), which limits individual bargaining power. One Call can shift volume across thousands of credentialed providers to secure favorable rates. Local scarcity in rural areas (affecting roughly 20% of counties) or specialty modalities can elevate supplier leverage. Overall, diversification dampens pricing pressure from any single vendor.
Volume aggregation creates preferred rates
Aggregating payer demand allows One Call to negotiate tiered discounts and priority scheduling by offering providers committed volumes, steerage, and centralized referrals that lower providers’ unit costs. In exchange One Call enforces SLAs and quality metrics, shifting operational risk to suppliers. Over time this scale advantage reduces suppliers’ pricing power and increases One Call’s leverage in contract renewals.
Switching costs moderate but manageable
Vendor transitions require re-credentialing (often 30–60 days), data-exchange setup and workflow changes, creating moderate switching frictions; however, standardized contracts and broad provider networks in 2024 make replacements feasible. Performance scorecards and pay-for-performance clauses enable pruning underperformers, containing supplier opportunism and preserving negotiating leverage.
Regulatory reimbursement floors cap upside
State workers’ comp fee schedules and utilization rules — maintained by over 30 states in 2024 — cap provider price ceilings and anchor negotiations despite market pressure for discounts. Prior authorization and evidence-based guidelines limit visit counts, so providers resist deep cuts but cannot expand volume-driven revenue. Net effect: constrained supplier margin expansion.
- Regulated benchmarks: fee schedules anchor rates
- Utilization rules: limit visit/volume growth
- Prior authorization: reduces unnecessary services
Specialist scarcity pockets raise leverage
Highly specialized services—complex imaging, pain specialists, catastrophic home health—are often capacity constrained, giving providers scheduling priority and stronger commercial terms; BLS projects 21% growth for home health aides 2022–32, underscoring persistent demand pressure. One Call mitigates with multi-regional panels and outcome-based contracting, but local or episodic scarcity still elevates supplier leverage.
- Specialist scarcity: higher local leverage
- Demand trend: BLS 21% growth (2022–32)
- Mitigation: multi-regional panels
- Contracting: outcome-based terms
Scale and aggregated demand reduce supplier pricing power in a fragmented PT market
Suppliers are highly fragmented (≈200,000 licensed PTs in US, 2024), limiting single-vendor leverage, though ~20% of counties face local scarcity. State fee schedules (30+ states) and utilization rules cap rates; re-credentialing takes 30–60 days. Scale and aggregated demand let One Call secure tiered discounts and enforce SLAs, reducing supplier pricing power over time.
| Metric | Value | Impact |
|---|---|---|
| PTs (2024) | ≈200,000 | Low individual power |
| Rural counties | ≈20% | Higher local leverage |
| States w/ fee schedules | 30+ | Rate caps |
What is included in the product
Detailed Word Document
Tailored Porter’s Five Forces analysis for One Call that uncovers competitive intensity, customer and supplier power, substitution threats, and entry barriers to assess strategic vulnerability and profit potential.
Customizable Excel Spreadsheet
A single-sheet, customizable Five Forces tool that converts complex competitive dynamics into a clear radar chart and copy-ready visuals—no macros, easy to integrate into decks or dashboards.
Customers Bargaining Power
Consolidated payers exert pricing pressure
Large insurers, TPAs, and self-insured employers negotiate enterprise contracts and RFPs, with the top five payers accounting for roughly 60% of commercial enrollment in 2024, enabling extensive rate benchmarking and stringent SLAs. Their scale forces providers to accept performance-linked pricing and deliverables; 67% of large employers self-fund health plans, increasing buyer sophistication. Buyers demand measurable savings and outcomes reporting, heightening leverage on price and performance.
Outcome and compliance demands tighten terms
Buyers now demand demonstrable medical cost containment, faster return-to-work and strict guideline adherence, with contracts in 2024 increasingly embedding outcome metrics, denial management and audit rights. Failure to meet benchmarks can trigger rebates (commonly 5–15%) or reallocation of 20–40% of volumes in contracted networks. These enforcement tools amplify buyer power well beyond price alone.
Integration and workflow switching costs
Deep integrations into claims platforms, eligibility, and bill review create strong stickiness by embedding One Call into payer workflows. Training adjusters and aligning clinical workflows generate tangible switching frictions that raise operational costs and time to migrate. Rich data interfaces and historical analytics add lock-in value, together partially offsetting buyer bargaining power.
Multi-sourcing and carve-outs
- Multi-sourcing preserves competitive tension
- Steerage enables rapid volume shifts
- Continuous pressure on pricing and service
- 2024 carve-outs raise buyer leverage
Insourcing and direct contracting options
Larger payers can build internal networks or contract directly with providers, and in 2024 the top five US payers account for roughly two-thirds of commercial lives while Medicare Advantage enrollment exceeded 30 million, increasing payers' leverage. Use of existing medical networks or MPNs enables bypassing intermediaries, putting downward pressure on vendor margins. One Call must differentiate on breadth, measurable outcomes and ease-of-use to retain share.
- Top payers ≈ 65% market share (top 5)
- Medicare Advantage >30M enrollees (2024)
- Insourcing threatens vendor margins
- Differentiators: breadth, outcomes, UX
Buyers control care: top-5 cover 60-65%; MA >30M
Buyers (top payers, TPAs, self-funded employers) hold strong leverage—top-5 payers cover ~60–65% commercial lives in 2024 and Medicare Advantage >30M enrollees—forcing performance-linked pricing and SLAs. Typical enforcement includes 5–15% rebates and 20–40% volume reallocation; multi-sourcing and deep integrations create partial offsetting lock-in.
| Metric | 2024 |
|---|---|
| Top-5 commercial share | 60–65% |
| Medicare Advantage | >30M enrollees |
| Large employers self-fund | 67% |
| Common rebates | 5–15% |
| Volume reallocation | 20–40% |
Preview Before You Purchase
One Call Porter's Five Forces Analysis
This preview shows the exact One Call Porter's Five Forces Analysis you'll receive—no samples or placeholders. The document is fully formatted, professionally written and ready for immediate download after purchase. What you see here is precisely the deliverable you'll get.
Original: $10.00
-65%$10.00
$3.50Description
Go Beyond the Preview—Access the Full Strategic Report
This concise Porter's Five Forces snapshot for One Call highlights buyer power, supplier influence, rivalry, threat of entrants, and substitutes, revealing competitive pressure points. This brief preview only scratches the surface—unlock the full report for force-by-force ratings, visuals, and strategic implications tailored to One Call. Get the consultant-grade analysis in Excel and Word formats to inform investment or strategy decisions.
Suppliers Bargaining Power
Fragmented provider base limits leverage
Most suppliers—PT clinics, imaging centers, DME, transportation and home health agencies—are highly fragmented (over 200,000 licensed physical therapists in the US in 2024), which limits individual bargaining power. One Call can shift volume across thousands of credentialed providers to secure favorable rates. Local scarcity in rural areas (affecting roughly 20% of counties) or specialty modalities can elevate supplier leverage. Overall, diversification dampens pricing pressure from any single vendor.
Volume aggregation creates preferred rates
Aggregating payer demand allows One Call to negotiate tiered discounts and priority scheduling by offering providers committed volumes, steerage, and centralized referrals that lower providers’ unit costs. In exchange One Call enforces SLAs and quality metrics, shifting operational risk to suppliers. Over time this scale advantage reduces suppliers’ pricing power and increases One Call’s leverage in contract renewals.
Switching costs moderate but manageable
Vendor transitions require re-credentialing (often 30–60 days), data-exchange setup and workflow changes, creating moderate switching frictions; however, standardized contracts and broad provider networks in 2024 make replacements feasible. Performance scorecards and pay-for-performance clauses enable pruning underperformers, containing supplier opportunism and preserving negotiating leverage.
Regulatory reimbursement floors cap upside
State workers’ comp fee schedules and utilization rules — maintained by over 30 states in 2024 — cap provider price ceilings and anchor negotiations despite market pressure for discounts. Prior authorization and evidence-based guidelines limit visit counts, so providers resist deep cuts but cannot expand volume-driven revenue. Net effect: constrained supplier margin expansion.
- Regulated benchmarks: fee schedules anchor rates
- Utilization rules: limit visit/volume growth
- Prior authorization: reduces unnecessary services
Specialist scarcity pockets raise leverage
Highly specialized services—complex imaging, pain specialists, catastrophic home health—are often capacity constrained, giving providers scheduling priority and stronger commercial terms; BLS projects 21% growth for home health aides 2022–32, underscoring persistent demand pressure. One Call mitigates with multi-regional panels and outcome-based contracting, but local or episodic scarcity still elevates supplier leverage.
- Specialist scarcity: higher local leverage
- Demand trend: BLS 21% growth (2022–32)
- Mitigation: multi-regional panels
- Contracting: outcome-based terms
Scale and aggregated demand reduce supplier pricing power in a fragmented PT market
Suppliers are highly fragmented (≈200,000 licensed PTs in US, 2024), limiting single-vendor leverage, though ~20% of counties face local scarcity. State fee schedules (30+ states) and utilization rules cap rates; re-credentialing takes 30–60 days. Scale and aggregated demand let One Call secure tiered discounts and enforce SLAs, reducing supplier pricing power over time.
| Metric | Value | Impact |
|---|---|---|
| PTs (2024) | ≈200,000 | Low individual power |
| Rural counties | ≈20% | Higher local leverage |
| States w/ fee schedules | 30+ | Rate caps |
What is included in the product
Detailed Word Document
Tailored Porter’s Five Forces analysis for One Call that uncovers competitive intensity, customer and supplier power, substitution threats, and entry barriers to assess strategic vulnerability and profit potential.
Customizable Excel Spreadsheet
A single-sheet, customizable Five Forces tool that converts complex competitive dynamics into a clear radar chart and copy-ready visuals—no macros, easy to integrate into decks or dashboards.
Customers Bargaining Power
Consolidated payers exert pricing pressure
Large insurers, TPAs, and self-insured employers negotiate enterprise contracts and RFPs, with the top five payers accounting for roughly 60% of commercial enrollment in 2024, enabling extensive rate benchmarking and stringent SLAs. Their scale forces providers to accept performance-linked pricing and deliverables; 67% of large employers self-fund health plans, increasing buyer sophistication. Buyers demand measurable savings and outcomes reporting, heightening leverage on price and performance.
Outcome and compliance demands tighten terms
Buyers now demand demonstrable medical cost containment, faster return-to-work and strict guideline adherence, with contracts in 2024 increasingly embedding outcome metrics, denial management and audit rights. Failure to meet benchmarks can trigger rebates (commonly 5–15%) or reallocation of 20–40% of volumes in contracted networks. These enforcement tools amplify buyer power well beyond price alone.
Integration and workflow switching costs
Deep integrations into claims platforms, eligibility, and bill review create strong stickiness by embedding One Call into payer workflows. Training adjusters and aligning clinical workflows generate tangible switching frictions that raise operational costs and time to migrate. Rich data interfaces and historical analytics add lock-in value, together partially offsetting buyer bargaining power.
Multi-sourcing and carve-outs
- Multi-sourcing preserves competitive tension
- Steerage enables rapid volume shifts
- Continuous pressure on pricing and service
- 2024 carve-outs raise buyer leverage
Insourcing and direct contracting options
Larger payers can build internal networks or contract directly with providers, and in 2024 the top five US payers account for roughly two-thirds of commercial lives while Medicare Advantage enrollment exceeded 30 million, increasing payers' leverage. Use of existing medical networks or MPNs enables bypassing intermediaries, putting downward pressure on vendor margins. One Call must differentiate on breadth, measurable outcomes and ease-of-use to retain share.
- Top payers ≈ 65% market share (top 5)
- Medicare Advantage >30M enrollees (2024)
- Insourcing threatens vendor margins
- Differentiators: breadth, outcomes, UX
Buyers control care: top-5 cover 60-65%; MA >30M
Buyers (top payers, TPAs, self-funded employers) hold strong leverage—top-5 payers cover ~60–65% commercial lives in 2024 and Medicare Advantage >30M enrollees—forcing performance-linked pricing and SLAs. Typical enforcement includes 5–15% rebates and 20–40% volume reallocation; multi-sourcing and deep integrations create partial offsetting lock-in.
| Metric | 2024 |
|---|---|
| Top-5 commercial share | 60–65% |
| Medicare Advantage | >30M enrollees |
| Large employers self-fund | 67% |
| Common rebates | 5–15% |
| Volume reallocation | 20–40% |
Preview Before You Purchase
One Call Porter's Five Forces Analysis
This preview shows the exact One Call Porter's Five Forces Analysis you'll receive—no samples or placeholders. The document is fully formatted, professionally written and ready for immediate download after purchase. What you see here is precisely the deliverable you'll get.











