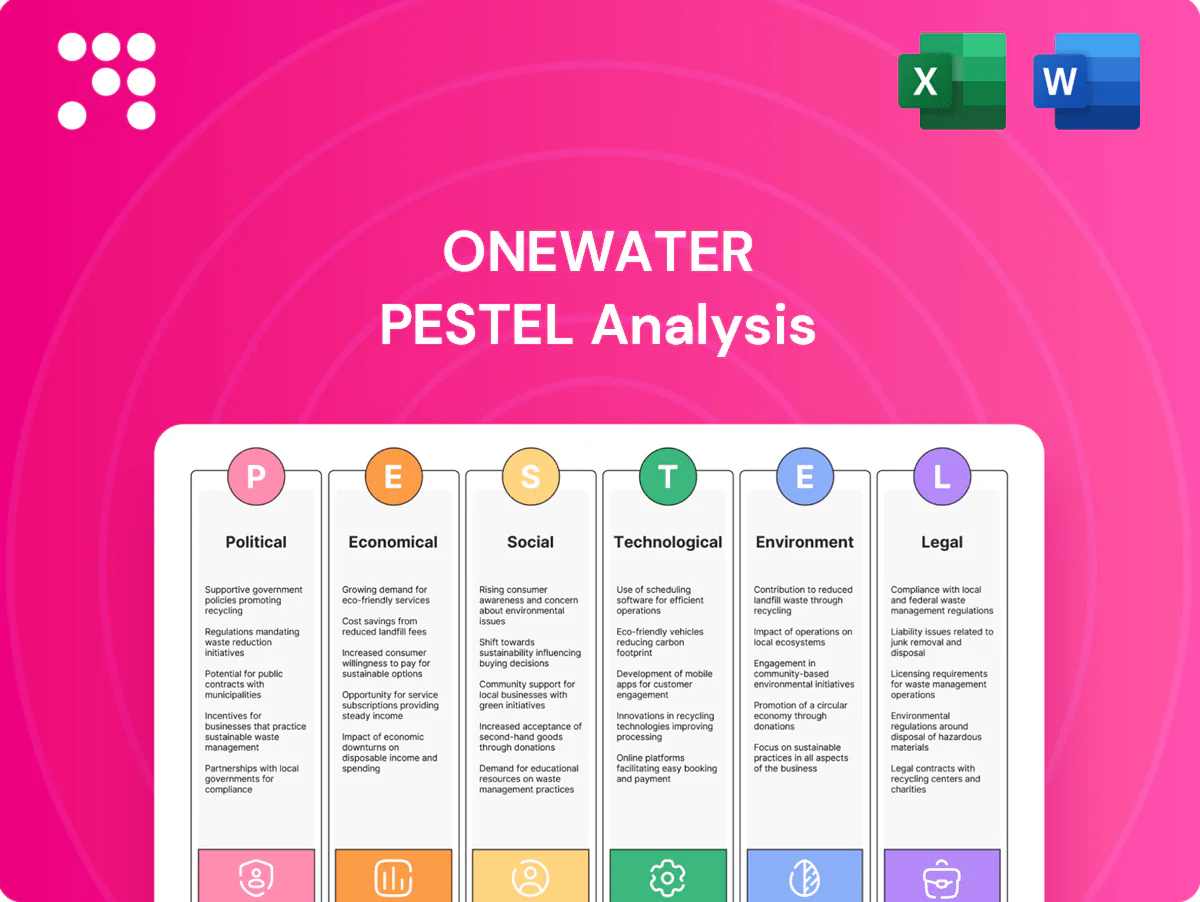
OneWater PESTLE Analysis

Your Shortcut to Market Insight Starts Here
Gain a strategic edge with our PESTLE Analysis of OneWater, revealing how political, economic, and environmental trends shape its outlook. Ideal for investors and strategists, this concise briefing highlights key external risks and opportunities. Purchase the full report to access the complete, actionable breakdown and ready-to-use insights.
Political factors

Marine policy shifts
Changes in federal and state marine policies can reshape boating access, fuel standards, and marina development, directly impacting OneWater inventory moves and service demand. OneWater sales may fluctuate if waterway usage rules tighten or expand; the US recreational boating industry contributes about $170 billion annually to the economy, so regulatory shifts have material revenue implications. Proactive advocacy and strict compliance help sustain dealership operations, making monitoring the Coast Guard and state boating agencies essential.
Trade and tariffs
Import tariffs on boats, engines and parts—including U.S. Section 301 measures that have reached up to 25%—directly raise wholesale costs and compress margins for dealers like OneWater. Currency swings (EUR/USD and CNY/USD volatility in 2023–24) and trade disputes have intermittently constrained availability of European and Asian components. Diversifying suppliers has become a common strategy to reduce tariff exposure. Pricing must be adjusted rapidly to pass through cost shifts to customers.

Infrastructure and spending
Public investment in ramps, marinas and coastal resilience supports boating demand; US recreational boating contributed about $170 billion to GDP (NMMA, 2022), underpinning retailer volumes. Budget cuts or permitting delays can constrain access and reduce boat usage, pressuring sales and service revenue. OneWater’s concentrated footprint in the Southeast and Gulf Coast makes it a direct beneficiary of local projects, and proactive municipal engagement can shape permitting, grant capture, and site outcomes.

State incentives and taxes
Variations in sales tax and luxury levies—five states have no statewide sales tax (Alaska, Delaware, Montana, New Hampshire, Oregon as of 2025) while California’s base rate is 7.25%—shape OneWater purchase timing and location; dealership clustering in low-tax jurisdictions raises throughput by concentrating inventory and sales volume. Cross-border buys are common for high-ticket boats and customers often use financing structures that roll sales tax into loans to mitigate upfront tax burdens.
- Tax-free states: Alaska, Delaware, Montana, New Hampshire, Oregon (2025)
- CA base sales tax: 7.25% (statewide)
- Dealership clustering increases regional throughput
- Financing can roll tax into loan to lower perceived upfront cost
Disaster and recovery policy
Hurricane and flood relief programs accelerate replacement cycles but cause short-term operational disruption and inventory shortages; U.S. coastal events drove an average of about 15 billion-dollar weather disasters per year from 2020–2024, increasing demand volatility. Government-backed NFIP flood coverage (~4.6 million policies in 2024) and rebuilding grants support regional rebounds, while preparedness policy shapes downtime and inventory risk. Coastal states list dealer network resilience as a political priority, influencing access to recovery funding and permitting.
- Replacement cycles: higher post-disaster demand
- NFIP ~4.6M policies (2024)
- Preparedness reduces downtime/inventory losses
- Coastal policy prioritizes dealer resilience
Tariffs up to 25% and disasters jolt the $170B US boating market
Federal/state boating rules, tariffs (up to 25%) and sales-tax differences (CA 7.25%; 5 tax-free states in 2025) materially affect OneWater margins, inventory and sales timing; US recreational boating supports about $170B annually. Weather disasters (avg ~15 billion-dollar events/yr 2020–24) and NFIP (≈4.6M policies in 2024) drive demand volatility and replacement cycles.
| Indicator | Value |
|---|---|
| Boating economic impact | $170B (NMMA) |
| Tariff peak | up to 25% |
| Disasters/yr | ~15 (2020–24) |
| NFIP policies | ≈4.6M (2024) |
| CA sales tax | 7.25% |
| Tax-free states | AK, DE, MT, NH, OR (2025) |
What is included in the product
 Detailed Word Document
Explores how external macro-environmental factors uniquely affect OneWater across Political, Economic, Social, Technological, Environmental and Legal dimensions, with each section backed by current data and market trends. Designed for executives, consultants and investors to identify threats, opportunities and support scenario planning.

 Customizable Excel Spreadsheet
A clean, summarized PESTLE of OneWater, visually segmented by category for quick interpretation and easily dropped into presentations or shared across teams to support planning, risk discussions, and client-ready reporting.
Economic factors

Interest rates sensitivity
Boat purchases are highly financed, so sensitivity to interest rates is acute given the federal funds target of 5.25–5.50% (June 2025); a 1ppt rise on a $50,000 10-year loan increases monthly payment by roughly $130, compressing demand. Higher rates both raise monthly payments and depress upgrade cycles as owners defer replacements. F&I penetration and promotional buy-downs (commonly used across dealers) can offset some pressure, but rate volatility complicates inventory planning and floorplan costs.
Consumer wealth effects
Disposable income rose ~2.5% in 2024, housing equity increased about 8% year-over-year and the S&P 500 gained roughly 20% in 2024, trends that boost discretionary spending and benefit OneWater’s premium models and accessories. Positive wealth effects lift average transaction values and add-on sales. Downturns historically shift mix toward pre-owned boats and higher-margin service revenue. Geographic diversification smooths regional demand shocks.

Fuel prices volatility
Volatile marine fuel—with Brent crude averaging about $85/barrel in 2024 and US regular gasoline near $3.60/gal (EIA 2024)—raises perceived ownership cost and can reduce boat usage frequency. Higher fuel pushes buyers to delay new purchases while increasing service and maintenance spend as owners keep vessels longer. Messaging on engine fuel-efficiency gains importance, and parts/accessories mix shifts toward efficiency upgrades and propeller/trim optimization.

Supply chain cycles
OEM production swings and component bottlenecks continue to drive inventory turns and model availability for OneWater, with tighter supply supporting dealer pricing power during peak spring/summer seasons in 2024–2025.
Strong OEM relationships secure allocations in peak seasons while strategic pre-owned sourcing and trade-ins buffer shortages and limit discounting pressure.
- Supply tightness: supports pricing power
- Oversupply: forces discounting risk
- OEM ties: secure peak allocations
- Pre-owned sourcing: mitigates shortages
Labor and wage dynamics
Technician wages and dealership staffing costs directly compress OneWater service margins as certified technicians command premium pay and benefits, especially post-2023 labor tightness; higher pay and expanded training budgets raise per-repair cost.
- Tight labor markets raise wages and training needs
- Productivity tools and certifications protect margins
- Regional pay differences change store profitability
Tariffs up to 25% and disasters jolt the $170B US boating market
Boat sales highly rate-sensitive: fed funds 5.25–5.50% (Jun 2025) raises financing costs and delays upgrades. Disposable income +2.5% in 2024 and S&P500 +20% (2024) supported premium sales; fuel (Brent ~$85/bbl, US gas ~$3.60/gal, 2024) dents usage. OEM supply tightness supports pricing; labor tightness raises service payrolls.
| Metric | Value | Impact |
|---|---|---|
| Fed funds | 5.25–5.50% | ↑ financing costs |
| Disposable income | +2.5% (2024) | ↑ TXV |
| Brent/gas | $85/bbl / $3.60/gal | ↓ usage |
Preview Before You Purchase
OneWater PESTLE Analysis
The preview shown here is the exact OneWater PESTLE Analysis you’ll receive after purchase—fully formatted and ready to use. It includes the same content, structure, and professional layout visible now. No placeholders or teasers—this is the final file, available immediately after checkout.

Your Shortcut to Market Insight Starts Here
Gain a strategic edge with our PESTLE Analysis of OneWater, revealing how political, economic, and environmental trends shape its outlook. Ideal for investors and strategists, this concise briefing highlights key external risks and opportunities. Purchase the full report to access the complete, actionable breakdown and ready-to-use insights.
Political factors
Marine policy shifts
Changes in federal and state marine policies can reshape boating access, fuel standards, and marina development, directly impacting OneWater inventory moves and service demand. OneWater sales may fluctuate if waterway usage rules tighten or expand; the US recreational boating industry contributes about $170 billion annually to the economy, so regulatory shifts have material revenue implications. Proactive advocacy and strict compliance help sustain dealership operations, making monitoring the Coast Guard and state boating agencies essential.
Trade and tariffs
Import tariffs on boats, engines and parts—including U.S. Section 301 measures that have reached up to 25%—directly raise wholesale costs and compress margins for dealers like OneWater. Currency swings (EUR/USD and CNY/USD volatility in 2023–24) and trade disputes have intermittently constrained availability of European and Asian components. Diversifying suppliers has become a common strategy to reduce tariff exposure. Pricing must be adjusted rapidly to pass through cost shifts to customers.
Infrastructure and spending
Public investment in ramps, marinas and coastal resilience supports boating demand; US recreational boating contributed about $170 billion to GDP (NMMA, 2022), underpinning retailer volumes. Budget cuts or permitting delays can constrain access and reduce boat usage, pressuring sales and service revenue. OneWater’s concentrated footprint in the Southeast and Gulf Coast makes it a direct beneficiary of local projects, and proactive municipal engagement can shape permitting, grant capture, and site outcomes.
State incentives and taxes
Variations in sales tax and luxury levies—five states have no statewide sales tax (Alaska, Delaware, Montana, New Hampshire, Oregon as of 2025) while California’s base rate is 7.25%—shape OneWater purchase timing and location; dealership clustering in low-tax jurisdictions raises throughput by concentrating inventory and sales volume. Cross-border buys are common for high-ticket boats and customers often use financing structures that roll sales tax into loans to mitigate upfront tax burdens.
- Tax-free states: Alaska, Delaware, Montana, New Hampshire, Oregon (2025)
- CA base sales tax: 7.25% (statewide)
- Dealership clustering increases regional throughput
- Financing can roll tax into loan to lower perceived upfront cost
Disaster and recovery policy
Hurricane and flood relief programs accelerate replacement cycles but cause short-term operational disruption and inventory shortages; U.S. coastal events drove an average of about 15 billion-dollar weather disasters per year from 2020–2024, increasing demand volatility. Government-backed NFIP flood coverage (~4.6 million policies in 2024) and rebuilding grants support regional rebounds, while preparedness policy shapes downtime and inventory risk. Coastal states list dealer network resilience as a political priority, influencing access to recovery funding and permitting.
- Replacement cycles: higher post-disaster demand
- NFIP ~4.6M policies (2024)
- Preparedness reduces downtime/inventory losses
- Coastal policy prioritizes dealer resilience
Tariffs up to 25% and disasters jolt the $170B US boating market
Federal/state boating rules, tariffs (up to 25%) and sales-tax differences (CA 7.25%; 5 tax-free states in 2025) materially affect OneWater margins, inventory and sales timing; US recreational boating supports about $170B annually. Weather disasters (avg ~15 billion-dollar events/yr 2020–24) and NFIP (≈4.6M policies in 2024) drive demand volatility and replacement cycles.
| Indicator | Value |
|---|---|
| Boating economic impact | $170B (NMMA) |
| Tariff peak | up to 25% |
| Disasters/yr | ~15 (2020–24) |
| NFIP policies | ≈4.6M (2024) |
| CA sales tax | 7.25% |
| Tax-free states | AK, DE, MT, NH, OR (2025) |
What is included in the product
Detailed Word Document
Explores how external macro-environmental factors uniquely affect OneWater across Political, Economic, Social, Technological, Environmental and Legal dimensions, with each section backed by current data and market trends. Designed for executives, consultants and investors to identify threats, opportunities and support scenario planning.
Customizable Excel Spreadsheet
A clean, summarized PESTLE of OneWater, visually segmented by category for quick interpretation and easily dropped into presentations or shared across teams to support planning, risk discussions, and client-ready reporting.
Economic factors
Interest rates sensitivity
Boat purchases are highly financed, so sensitivity to interest rates is acute given the federal funds target of 5.25–5.50% (June 2025); a 1ppt rise on a $50,000 10-year loan increases monthly payment by roughly $130, compressing demand. Higher rates both raise monthly payments and depress upgrade cycles as owners defer replacements. F&I penetration and promotional buy-downs (commonly used across dealers) can offset some pressure, but rate volatility complicates inventory planning and floorplan costs.
Consumer wealth effects
Disposable income rose ~2.5% in 2024, housing equity increased about 8% year-over-year and the S&P 500 gained roughly 20% in 2024, trends that boost discretionary spending and benefit OneWater’s premium models and accessories. Positive wealth effects lift average transaction values and add-on sales. Downturns historically shift mix toward pre-owned boats and higher-margin service revenue. Geographic diversification smooths regional demand shocks.
Fuel prices volatility
Volatile marine fuel—with Brent crude averaging about $85/barrel in 2024 and US regular gasoline near $3.60/gal (EIA 2024)—raises perceived ownership cost and can reduce boat usage frequency. Higher fuel pushes buyers to delay new purchases while increasing service and maintenance spend as owners keep vessels longer. Messaging on engine fuel-efficiency gains importance, and parts/accessories mix shifts toward efficiency upgrades and propeller/trim optimization.
Supply chain cycles
OEM production swings and component bottlenecks continue to drive inventory turns and model availability for OneWater, with tighter supply supporting dealer pricing power during peak spring/summer seasons in 2024–2025.
Strong OEM relationships secure allocations in peak seasons while strategic pre-owned sourcing and trade-ins buffer shortages and limit discounting pressure.
- Supply tightness: supports pricing power
- Oversupply: forces discounting risk
- OEM ties: secure peak allocations
- Pre-owned sourcing: mitigates shortages
Labor and wage dynamics
Technician wages and dealership staffing costs directly compress OneWater service margins as certified technicians command premium pay and benefits, especially post-2023 labor tightness; higher pay and expanded training budgets raise per-repair cost.
- Tight labor markets raise wages and training needs
- Productivity tools and certifications protect margins
- Regional pay differences change store profitability
Tariffs up to 25% and disasters jolt the $170B US boating market
Boat sales highly rate-sensitive: fed funds 5.25–5.50% (Jun 2025) raises financing costs and delays upgrades. Disposable income +2.5% in 2024 and S&P500 +20% (2024) supported premium sales; fuel (Brent ~$85/bbl, US gas ~$3.60/gal, 2024) dents usage. OEM supply tightness supports pricing; labor tightness raises service payrolls.
| Metric | Value | Impact |
|---|---|---|
| Fed funds | 5.25–5.50% | ↑ financing costs |
| Disposable income | +2.5% (2024) | ↑ TXV |
| Brent/gas | $85/bbl / $3.60/gal | ↓ usage |
Preview Before You Purchase
OneWater PESTLE Analysis
The preview shown here is the exact OneWater PESTLE Analysis you’ll receive after purchase—fully formatted and ready to use. It includes the same content, structure, and professional layout visible now. No placeholders or teasers—this is the final file, available immediately after checkout.
Original: $10.00
-65%$10.00
$3.50Description
Your Shortcut to Market Insight Starts Here
Gain a strategic edge with our PESTLE Analysis of OneWater, revealing how political, economic, and environmental trends shape its outlook. Ideal for investors and strategists, this concise briefing highlights key external risks and opportunities. Purchase the full report to access the complete, actionable breakdown and ready-to-use insights.
Political factors
Marine policy shifts
Changes in federal and state marine policies can reshape boating access, fuel standards, and marina development, directly impacting OneWater inventory moves and service demand. OneWater sales may fluctuate if waterway usage rules tighten or expand; the US recreational boating industry contributes about $170 billion annually to the economy, so regulatory shifts have material revenue implications. Proactive advocacy and strict compliance help sustain dealership operations, making monitoring the Coast Guard and state boating agencies essential.
Trade and tariffs
Import tariffs on boats, engines and parts—including U.S. Section 301 measures that have reached up to 25%—directly raise wholesale costs and compress margins for dealers like OneWater. Currency swings (EUR/USD and CNY/USD volatility in 2023–24) and trade disputes have intermittently constrained availability of European and Asian components. Diversifying suppliers has become a common strategy to reduce tariff exposure. Pricing must be adjusted rapidly to pass through cost shifts to customers.
Infrastructure and spending
Public investment in ramps, marinas and coastal resilience supports boating demand; US recreational boating contributed about $170 billion to GDP (NMMA, 2022), underpinning retailer volumes. Budget cuts or permitting delays can constrain access and reduce boat usage, pressuring sales and service revenue. OneWater’s concentrated footprint in the Southeast and Gulf Coast makes it a direct beneficiary of local projects, and proactive municipal engagement can shape permitting, grant capture, and site outcomes.
State incentives and taxes
Variations in sales tax and luxury levies—five states have no statewide sales tax (Alaska, Delaware, Montana, New Hampshire, Oregon as of 2025) while California’s base rate is 7.25%—shape OneWater purchase timing and location; dealership clustering in low-tax jurisdictions raises throughput by concentrating inventory and sales volume. Cross-border buys are common for high-ticket boats and customers often use financing structures that roll sales tax into loans to mitigate upfront tax burdens.
- Tax-free states: Alaska, Delaware, Montana, New Hampshire, Oregon (2025)
- CA base sales tax: 7.25% (statewide)
- Dealership clustering increases regional throughput
- Financing can roll tax into loan to lower perceived upfront cost
Disaster and recovery policy
Hurricane and flood relief programs accelerate replacement cycles but cause short-term operational disruption and inventory shortages; U.S. coastal events drove an average of about 15 billion-dollar weather disasters per year from 2020–2024, increasing demand volatility. Government-backed NFIP flood coverage (~4.6 million policies in 2024) and rebuilding grants support regional rebounds, while preparedness policy shapes downtime and inventory risk. Coastal states list dealer network resilience as a political priority, influencing access to recovery funding and permitting.
- Replacement cycles: higher post-disaster demand
- NFIP ~4.6M policies (2024)
- Preparedness reduces downtime/inventory losses
- Coastal policy prioritizes dealer resilience
Tariffs up to 25% and disasters jolt the $170B US boating market
Federal/state boating rules, tariffs (up to 25%) and sales-tax differences (CA 7.25%; 5 tax-free states in 2025) materially affect OneWater margins, inventory and sales timing; US recreational boating supports about $170B annually. Weather disasters (avg ~15 billion-dollar events/yr 2020–24) and NFIP (≈4.6M policies in 2024) drive demand volatility and replacement cycles.
| Indicator | Value |
|---|---|
| Boating economic impact | $170B (NMMA) |
| Tariff peak | up to 25% |
| Disasters/yr | ~15 (2020–24) |
| NFIP policies | ≈4.6M (2024) |
| CA sales tax | 7.25% |
| Tax-free states | AK, DE, MT, NH, OR (2025) |
What is included in the product
Detailed Word Document
Explores how external macro-environmental factors uniquely affect OneWater across Political, Economic, Social, Technological, Environmental and Legal dimensions, with each section backed by current data and market trends. Designed for executives, consultants and investors to identify threats, opportunities and support scenario planning.
Customizable Excel Spreadsheet
A clean, summarized PESTLE of OneWater, visually segmented by category for quick interpretation and easily dropped into presentations or shared across teams to support planning, risk discussions, and client-ready reporting.
Economic factors
Interest rates sensitivity
Boat purchases are highly financed, so sensitivity to interest rates is acute given the federal funds target of 5.25–5.50% (June 2025); a 1ppt rise on a $50,000 10-year loan increases monthly payment by roughly $130, compressing demand. Higher rates both raise monthly payments and depress upgrade cycles as owners defer replacements. F&I penetration and promotional buy-downs (commonly used across dealers) can offset some pressure, but rate volatility complicates inventory planning and floorplan costs.
Consumer wealth effects
Disposable income rose ~2.5% in 2024, housing equity increased about 8% year-over-year and the S&P 500 gained roughly 20% in 2024, trends that boost discretionary spending and benefit OneWater’s premium models and accessories. Positive wealth effects lift average transaction values and add-on sales. Downturns historically shift mix toward pre-owned boats and higher-margin service revenue. Geographic diversification smooths regional demand shocks.
Fuel prices volatility
Volatile marine fuel—with Brent crude averaging about $85/barrel in 2024 and US regular gasoline near $3.60/gal (EIA 2024)—raises perceived ownership cost and can reduce boat usage frequency. Higher fuel pushes buyers to delay new purchases while increasing service and maintenance spend as owners keep vessels longer. Messaging on engine fuel-efficiency gains importance, and parts/accessories mix shifts toward efficiency upgrades and propeller/trim optimization.
Supply chain cycles
OEM production swings and component bottlenecks continue to drive inventory turns and model availability for OneWater, with tighter supply supporting dealer pricing power during peak spring/summer seasons in 2024–2025.
Strong OEM relationships secure allocations in peak seasons while strategic pre-owned sourcing and trade-ins buffer shortages and limit discounting pressure.
- Supply tightness: supports pricing power
- Oversupply: forces discounting risk
- OEM ties: secure peak allocations
- Pre-owned sourcing: mitigates shortages
Labor and wage dynamics
Technician wages and dealership staffing costs directly compress OneWater service margins as certified technicians command premium pay and benefits, especially post-2023 labor tightness; higher pay and expanded training budgets raise per-repair cost.
- Tight labor markets raise wages and training needs
- Productivity tools and certifications protect margins
- Regional pay differences change store profitability
Tariffs up to 25% and disasters jolt the $170B US boating market
Boat sales highly rate-sensitive: fed funds 5.25–5.50% (Jun 2025) raises financing costs and delays upgrades. Disposable income +2.5% in 2024 and S&P500 +20% (2024) supported premium sales; fuel (Brent ~$85/bbl, US gas ~$3.60/gal, 2024) dents usage. OEM supply tightness supports pricing; labor tightness raises service payrolls.
| Metric | Value | Impact |
|---|---|---|
| Fed funds | 5.25–5.50% | ↑ financing costs |
| Disposable income | +2.5% (2024) | ↑ TXV |
| Brent/gas | $85/bbl / $3.60/gal | ↓ usage |
Preview Before You Purchase
OneWater PESTLE Analysis
The preview shown here is the exact OneWater PESTLE Analysis you’ll receive after purchase—fully formatted and ready to use. It includes the same content, structure, and professional layout visible now. No placeholders or teasers—this is the final file, available immediately after checkout.











