Oil & Natural Gas Boston Consulting Group Matrix

Visual. Strategic. Downloadable.
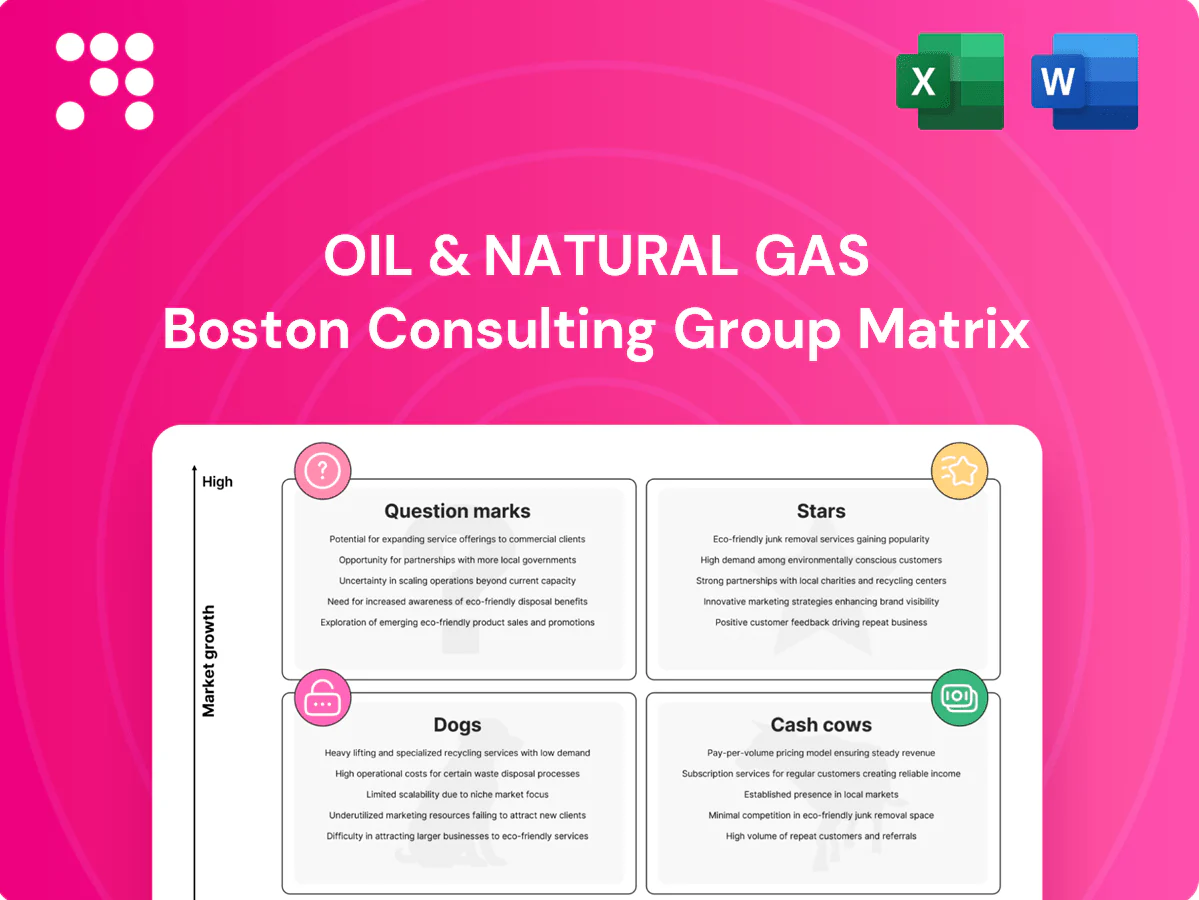
The Oil & Natural Gas BCG Matrix cuts through industry noise to show which assets are Stars driving growth, which are Cash Cows funding operations, and which are draining value—so you can act, not guess. This preview maps market share and growth at a glance, but the full BCG Matrix gives quadrant-by-quadrant insights, data-backed recommendations, and a ready-to-use strategic roadmap. Purchase the full report for Word and Excel deliverables and start reallocating capital with confidence today.
Stars

Domestic offshore gas ramp‑up (KG‑DWN‑98/2)
KG‑DWN‑98/2 is an ONGC‑operated deepwater Krishna–Godavari block positioned to capture India’s rising gas demand as the government reiterated a national target of 15% gas in the energy mix by 2030 (statement reiterated in 2024). ONGC has the resource base and execution lead, but the project is capital hungry today; aggressive investment should secure off‑take and pricing leverage. Keep the throttle on to convert current momentum into durable cash—classic invest‑to‑win Star.
Integrated upstream leadership in India
Core integrated upstream hold captures a dominant share in India’s structurally expanding gas market, with policy push to raise gas share to 15% of the energy mix by 2030 and reported gas demand growth of about 5% in 2024. Policy tailwinds and fuel-switching lift volumes and pricing power. Maintaining the lead requires sustained annual upstream capex and advanced seismic/production tech. Stay aggressive while market expands.

Gas marketing and evacuation to priority sectors
Rising city gas, power and industrial demand place ONGC’s molecules in the sweet spot as India targets a 15% gas share of primary energy by 2030. ONGC and partners supply roughly half of India’s domestic gas, giving strong allocation visibility but requiring expanded network, long-term contracts and reliability upgrades. Growth is rapid while private and global players are accelerating capacity and retail access. Targeted capex to cement market share is essential.

Offshore development clusters (western offshore hubs)
Offshore development clusters in western hubs are Stars: scale fields and shared infrastructure plus a steady 2024 project pipeline create strong velocity. High capex now (initial clusters require hundreds of millions to multi‑billion spend), but tie‑backs typically cut unit costs 20–40% and boost volumes as wells ramp; execution excellence preserves share in a growing offshore slate, so double down while growth lasts.
- 2024 pipeline: multiple sanctioned clusters accelerating tie‑backs
- Capex: upfront heavy, recovery via lower unit opex
- Unit cost savings: 20–40% with tie‑backs
- Sanction-to-first‑oil: often 2–4 years
Subsurface tech and digital (seismic, AI, EOR analytics)
Subsurface tech (advanced seismic, AI-led interpretation, EOR analytics) is a Stars quadrant play, delivering documented uplifts—industry studies cite ~10–25% recovery or find-rate gains—while requiring large upfront data, tools and skills investments; payback improves with portfolio scale, keeping ONGC ahead in the 2024 growth window and justifying ambitious funding.
- Uplift: 10–25% recovery/find-rate
- Cost: high upfront data+skills CAPEX
- Scale: payback rises with portfolio
- Strategy: fund ambitiously to sustain ONGC lead
KG‑DWN‑98/2 & western clusters: aggressive capex to seize ~5% 2024 gas growth, hit 15% by 2030
KG‑DWN‑98/2 and western clusters are Stars: heavy near‑term capex to capture ~5% gas demand growth in 2024 and policy support for a 15% gas share by 2030; ONGC supplies ~50% of domestic gas, giving allocation visibility. Tie‑backs cut unit costs 20–40%; subsurface tech adds 10–25% recovery; sustain aggressive capex to convert growth into cash.
| Metric | 2024 |
|---|---|
| ONGC share | ~50% |
| Gas demand growth | ~5% |
| Gas target | 15% by 2030 |
| Tie‑back savings | 20–40% |
| Subsurface uplift | 10–25% |
What is included in the product
 Detailed Word Document
In-depth BCG Matrix review of oil & gas units, with strategic moves—invest, hold, divest—plus risks, trends, and competitive edges.

 Customizable Excel Spreadsheet
One-page Oil & Natural Gas BCG Matrix that clarifies portfolio risks and priorities for faster executive decisions.
Cash Cows

Legacy onshore oil fields (Gujarat, Assam)
Legacy onshore oil fields in Gujarat and Assam are mature, high‑share assets generating steady cash flows while overall reserves face low growth and predictable decline managed through IOR programs and infill drilling. Operational focus remains tight opex and strict safety protocols to preserve cash generation. Strategy: milk these assets, avoid heavy capex that risks reducing near‑term free cash flow.
Western offshore mature oil (Mumbai High base)
Western offshore mature oil (Mumbai High base) supplies steady barrels and generates high free cash after maintenance, with operators targeting >$70/boe breakevens amid 2024 Brent averaging roughly $86/bl; growth is limited and margins depend on uptime and operating-cost control. Priority is debottlenecking and disciplined waterflooding to sustain recovery; harvest cash flows to fund lower-carbon investments and future frontier projects.

Refining and marketing stakes (HPCL, MRPL)
Refining & marketing stakes HPCL (combined refining capacity ~15.8 MMTPA) and MRPL (≈15.0 MMTPA) represent meaningful presence in a mature segment, delivering cyclical but net positive cash over cycles. Focus on optimizing turnarounds, crude baskets and retail marketing yields to protect margins. Maintain assets, collect dividends and avoid empire building to preserve cash cow returns.

Midstream pipelines and evacuation infrastructure
Midstream pipelines and evacuation infrastructure deliver regulated, utilized cash flows with modest capex; U.S. pipeline utilization commonly exceeds 90% and midstream sectors returned roughly $20B in distributions/dividends in 2023, sustaining ~stable free cash flow into 2024. Incremental upgrades (compressor/pigging) typically lift throughput and reliability at low cost while tight integrity programs keep leakages minimal and operating expense predictable.
- Stable cash flows — regulated tariffs, high utilization
- Low incremental capex — upgrades boost throughput cheaply
- Integrity focus — minimizes leaks, preserves uptime
- Reliable payer — quietly funds corporate dividends/FCF
Field services and logistics backbone
Field services and logistics backbone—owned rigs, marine, and support—serve captive demand and drove steady cash generation in 2024 as operators shifted spend on efficiency over growth. Market maturity means incremental efficiency gains flow straight to cash; standardize workflows, outsource noncore tasks selectively, and sweat high-utilization assets to boost free cash flow.
- 2024 focus: capture opex savings
- Standardize and automate
- Outsource low-value work
- Sweat assets, bank savings
Harvest cash: high-util midstream, profitable offshore and refineries fund transition
Legacy onshore (Gujarat/Assam) cash-positive with declining reserves; Mumbai High offshore breakeven >$70/boe vs 2024 Brent ≈$86/bl; HPCL ~15.8 MMTPA, MRPL ~15.0 MMTPA provide cyclical cash; midstream >90% utilization, sector returned ~$20B in distributions (2023); rigs/marine high utilization in 2024. Strategy: minimal growth capex, harvest cash to fund transition.
| Asset | 2024 metric | Role |
|---|---|---|
| Onshore | Stable opex, IOR | Cash generator |
| Offshore | Breakeven >$70/boe | High FCF |
| Refining | 15.8 /15.0 MMTPA | Cyclical cash |
| Midstream | >90% util, ~$20B | Stable cash |
What You See Is What You Get
Oil & Natural Gas BCG Matrix
The file you're previewing is the final Oil & Natural Gas BCG Matrix you'll receive after purchase. No watermarks, no demo content—just a fully formatted, ready-to-use strategic report. Built with sector-specific metrics and market-backed analysis for clear decision-making. Immediately downloadable, editable, and presentation-ready. One-time purchase, no surprises—ready to plug into planning or investor decks.

Visual. Strategic. Downloadable.
The Oil & Natural Gas BCG Matrix cuts through industry noise to show which assets are Stars driving growth, which are Cash Cows funding operations, and which are draining value—so you can act, not guess. This preview maps market share and growth at a glance, but the full BCG Matrix gives quadrant-by-quadrant insights, data-backed recommendations, and a ready-to-use strategic roadmap. Purchase the full report for Word and Excel deliverables and start reallocating capital with confidence today.
Stars
Domestic offshore gas ramp‑up (KG‑DWN‑98/2)
KG‑DWN‑98/2 is an ONGC‑operated deepwater Krishna–Godavari block positioned to capture India’s rising gas demand as the government reiterated a national target of 15% gas in the energy mix by 2030 (statement reiterated in 2024). ONGC has the resource base and execution lead, but the project is capital hungry today; aggressive investment should secure off‑take and pricing leverage. Keep the throttle on to convert current momentum into durable cash—classic invest‑to‑win Star.
Integrated upstream leadership in India
Core integrated upstream hold captures a dominant share in India’s structurally expanding gas market, with policy push to raise gas share to 15% of the energy mix by 2030 and reported gas demand growth of about 5% in 2024. Policy tailwinds and fuel-switching lift volumes and pricing power. Maintaining the lead requires sustained annual upstream capex and advanced seismic/production tech. Stay aggressive while market expands.
Gas marketing and evacuation to priority sectors
Rising city gas, power and industrial demand place ONGC’s molecules in the sweet spot as India targets a 15% gas share of primary energy by 2030. ONGC and partners supply roughly half of India’s domestic gas, giving strong allocation visibility but requiring expanded network, long-term contracts and reliability upgrades. Growth is rapid while private and global players are accelerating capacity and retail access. Targeted capex to cement market share is essential.
Offshore development clusters (western offshore hubs)
Offshore development clusters in western hubs are Stars: scale fields and shared infrastructure plus a steady 2024 project pipeline create strong velocity. High capex now (initial clusters require hundreds of millions to multi‑billion spend), but tie‑backs typically cut unit costs 20–40% and boost volumes as wells ramp; execution excellence preserves share in a growing offshore slate, so double down while growth lasts.
- 2024 pipeline: multiple sanctioned clusters accelerating tie‑backs
- Capex: upfront heavy, recovery via lower unit opex
- Unit cost savings: 20–40% with tie‑backs
- Sanction-to-first‑oil: often 2–4 years
Subsurface tech and digital (seismic, AI, EOR analytics)
Subsurface tech (advanced seismic, AI-led interpretation, EOR analytics) is a Stars quadrant play, delivering documented uplifts—industry studies cite ~10–25% recovery or find-rate gains—while requiring large upfront data, tools and skills investments; payback improves with portfolio scale, keeping ONGC ahead in the 2024 growth window and justifying ambitious funding.
- Uplift: 10–25% recovery/find-rate
- Cost: high upfront data+skills CAPEX
- Scale: payback rises with portfolio
- Strategy: fund ambitiously to sustain ONGC lead
KG‑DWN‑98/2 & western clusters: aggressive capex to seize ~5% 2024 gas growth, hit 15% by 2030
KG‑DWN‑98/2 and western clusters are Stars: heavy near‑term capex to capture ~5% gas demand growth in 2024 and policy support for a 15% gas share by 2030; ONGC supplies ~50% of domestic gas, giving allocation visibility. Tie‑backs cut unit costs 20–40%; subsurface tech adds 10–25% recovery; sustain aggressive capex to convert growth into cash.
| Metric | 2024 |
|---|---|
| ONGC share | ~50% |
| Gas demand growth | ~5% |
| Gas target | 15% by 2030 |
| Tie‑back savings | 20–40% |
| Subsurface uplift | 10–25% |
What is included in the product
Detailed Word Document
In-depth BCG Matrix review of oil & gas units, with strategic moves—invest, hold, divest—plus risks, trends, and competitive edges.
Customizable Excel Spreadsheet
One-page Oil & Natural Gas BCG Matrix that clarifies portfolio risks and priorities for faster executive decisions.
Cash Cows
Legacy onshore oil fields (Gujarat, Assam)
Legacy onshore oil fields in Gujarat and Assam are mature, high‑share assets generating steady cash flows while overall reserves face low growth and predictable decline managed through IOR programs and infill drilling. Operational focus remains tight opex and strict safety protocols to preserve cash generation. Strategy: milk these assets, avoid heavy capex that risks reducing near‑term free cash flow.
Western offshore mature oil (Mumbai High base)
Western offshore mature oil (Mumbai High base) supplies steady barrels and generates high free cash after maintenance, with operators targeting >$70/boe breakevens amid 2024 Brent averaging roughly $86/bl; growth is limited and margins depend on uptime and operating-cost control. Priority is debottlenecking and disciplined waterflooding to sustain recovery; harvest cash flows to fund lower-carbon investments and future frontier projects.
Refining and marketing stakes (HPCL, MRPL)
Refining & marketing stakes HPCL (combined refining capacity ~15.8 MMTPA) and MRPL (≈15.0 MMTPA) represent meaningful presence in a mature segment, delivering cyclical but net positive cash over cycles. Focus on optimizing turnarounds, crude baskets and retail marketing yields to protect margins. Maintain assets, collect dividends and avoid empire building to preserve cash cow returns.
Midstream pipelines and evacuation infrastructure
Midstream pipelines and evacuation infrastructure deliver regulated, utilized cash flows with modest capex; U.S. pipeline utilization commonly exceeds 90% and midstream sectors returned roughly $20B in distributions/dividends in 2023, sustaining ~stable free cash flow into 2024. Incremental upgrades (compressor/pigging) typically lift throughput and reliability at low cost while tight integrity programs keep leakages minimal and operating expense predictable.
- Stable cash flows — regulated tariffs, high utilization
- Low incremental capex — upgrades boost throughput cheaply
- Integrity focus — minimizes leaks, preserves uptime
- Reliable payer — quietly funds corporate dividends/FCF
Field services and logistics backbone
Field services and logistics backbone—owned rigs, marine, and support—serve captive demand and drove steady cash generation in 2024 as operators shifted spend on efficiency over growth. Market maturity means incremental efficiency gains flow straight to cash; standardize workflows, outsource noncore tasks selectively, and sweat high-utilization assets to boost free cash flow.
- 2024 focus: capture opex savings
- Standardize and automate
- Outsource low-value work
- Sweat assets, bank savings
Harvest cash: high-util midstream, profitable offshore and refineries fund transition
Legacy onshore (Gujarat/Assam) cash-positive with declining reserves; Mumbai High offshore breakeven >$70/boe vs 2024 Brent ≈$86/bl; HPCL ~15.8 MMTPA, MRPL ~15.0 MMTPA provide cyclical cash; midstream >90% utilization, sector returned ~$20B in distributions (2023); rigs/marine high utilization in 2024. Strategy: minimal growth capex, harvest cash to fund transition.
| Asset | 2024 metric | Role |
|---|---|---|
| Onshore | Stable opex, IOR | Cash generator |
| Offshore | Breakeven >$70/boe | High FCF |
| Refining | 15.8 /15.0 MMTPA | Cyclical cash |
| Midstream | >90% util, ~$20B | Stable cash |
What You See Is What You Get
Oil & Natural Gas BCG Matrix
The file you're previewing is the final Oil & Natural Gas BCG Matrix you'll receive after purchase. No watermarks, no demo content—just a fully formatted, ready-to-use strategic report. Built with sector-specific metrics and market-backed analysis for clear decision-making. Immediately downloadable, editable, and presentation-ready. One-time purchase, no surprises—ready to plug into planning or investor decks.
Original: $10.00
-65%$10.00
$3.50Description
Visual. Strategic. Downloadable.
The Oil & Natural Gas BCG Matrix cuts through industry noise to show which assets are Stars driving growth, which are Cash Cows funding operations, and which are draining value—so you can act, not guess. This preview maps market share and growth at a glance, but the full BCG Matrix gives quadrant-by-quadrant insights, data-backed recommendations, and a ready-to-use strategic roadmap. Purchase the full report for Word and Excel deliverables and start reallocating capital with confidence today.
Stars
Domestic offshore gas ramp‑up (KG‑DWN‑98/2)
KG‑DWN‑98/2 is an ONGC‑operated deepwater Krishna–Godavari block positioned to capture India’s rising gas demand as the government reiterated a national target of 15% gas in the energy mix by 2030 (statement reiterated in 2024). ONGC has the resource base and execution lead, but the project is capital hungry today; aggressive investment should secure off‑take and pricing leverage. Keep the throttle on to convert current momentum into durable cash—classic invest‑to‑win Star.
Integrated upstream leadership in India
Core integrated upstream hold captures a dominant share in India’s structurally expanding gas market, with policy push to raise gas share to 15% of the energy mix by 2030 and reported gas demand growth of about 5% in 2024. Policy tailwinds and fuel-switching lift volumes and pricing power. Maintaining the lead requires sustained annual upstream capex and advanced seismic/production tech. Stay aggressive while market expands.
Gas marketing and evacuation to priority sectors
Rising city gas, power and industrial demand place ONGC’s molecules in the sweet spot as India targets a 15% gas share of primary energy by 2030. ONGC and partners supply roughly half of India’s domestic gas, giving strong allocation visibility but requiring expanded network, long-term contracts and reliability upgrades. Growth is rapid while private and global players are accelerating capacity and retail access. Targeted capex to cement market share is essential.
Offshore development clusters (western offshore hubs)
Offshore development clusters in western hubs are Stars: scale fields and shared infrastructure plus a steady 2024 project pipeline create strong velocity. High capex now (initial clusters require hundreds of millions to multi‑billion spend), but tie‑backs typically cut unit costs 20–40% and boost volumes as wells ramp; execution excellence preserves share in a growing offshore slate, so double down while growth lasts.
- 2024 pipeline: multiple sanctioned clusters accelerating tie‑backs
- Capex: upfront heavy, recovery via lower unit opex
- Unit cost savings: 20–40% with tie‑backs
- Sanction-to-first‑oil: often 2–4 years
Subsurface tech and digital (seismic, AI, EOR analytics)
Subsurface tech (advanced seismic, AI-led interpretation, EOR analytics) is a Stars quadrant play, delivering documented uplifts—industry studies cite ~10–25% recovery or find-rate gains—while requiring large upfront data, tools and skills investments; payback improves with portfolio scale, keeping ONGC ahead in the 2024 growth window and justifying ambitious funding.
- Uplift: 10–25% recovery/find-rate
- Cost: high upfront data+skills CAPEX
- Scale: payback rises with portfolio
- Strategy: fund ambitiously to sustain ONGC lead
KG‑DWN‑98/2 & western clusters: aggressive capex to seize ~5% 2024 gas growth, hit 15% by 2030
KG‑DWN‑98/2 and western clusters are Stars: heavy near‑term capex to capture ~5% gas demand growth in 2024 and policy support for a 15% gas share by 2030; ONGC supplies ~50% of domestic gas, giving allocation visibility. Tie‑backs cut unit costs 20–40%; subsurface tech adds 10–25% recovery; sustain aggressive capex to convert growth into cash.
| Metric | 2024 |
|---|---|
| ONGC share | ~50% |
| Gas demand growth | ~5% |
| Gas target | 15% by 2030 |
| Tie‑back savings | 20–40% |
| Subsurface uplift | 10–25% |
What is included in the product
Detailed Word Document
In-depth BCG Matrix review of oil & gas units, with strategic moves—invest, hold, divest—plus risks, trends, and competitive edges.
Customizable Excel Spreadsheet
One-page Oil & Natural Gas BCG Matrix that clarifies portfolio risks and priorities for faster executive decisions.
Cash Cows
Legacy onshore oil fields (Gujarat, Assam)
Legacy onshore oil fields in Gujarat and Assam are mature, high‑share assets generating steady cash flows while overall reserves face low growth and predictable decline managed through IOR programs and infill drilling. Operational focus remains tight opex and strict safety protocols to preserve cash generation. Strategy: milk these assets, avoid heavy capex that risks reducing near‑term free cash flow.
Western offshore mature oil (Mumbai High base)
Western offshore mature oil (Mumbai High base) supplies steady barrels and generates high free cash after maintenance, with operators targeting >$70/boe breakevens amid 2024 Brent averaging roughly $86/bl; growth is limited and margins depend on uptime and operating-cost control. Priority is debottlenecking and disciplined waterflooding to sustain recovery; harvest cash flows to fund lower-carbon investments and future frontier projects.
Refining and marketing stakes (HPCL, MRPL)
Refining & marketing stakes HPCL (combined refining capacity ~15.8 MMTPA) and MRPL (≈15.0 MMTPA) represent meaningful presence in a mature segment, delivering cyclical but net positive cash over cycles. Focus on optimizing turnarounds, crude baskets and retail marketing yields to protect margins. Maintain assets, collect dividends and avoid empire building to preserve cash cow returns.
Midstream pipelines and evacuation infrastructure
Midstream pipelines and evacuation infrastructure deliver regulated, utilized cash flows with modest capex; U.S. pipeline utilization commonly exceeds 90% and midstream sectors returned roughly $20B in distributions/dividends in 2023, sustaining ~stable free cash flow into 2024. Incremental upgrades (compressor/pigging) typically lift throughput and reliability at low cost while tight integrity programs keep leakages minimal and operating expense predictable.
- Stable cash flows — regulated tariffs, high utilization
- Low incremental capex — upgrades boost throughput cheaply
- Integrity focus — minimizes leaks, preserves uptime
- Reliable payer — quietly funds corporate dividends/FCF
Field services and logistics backbone
Field services and logistics backbone—owned rigs, marine, and support—serve captive demand and drove steady cash generation in 2024 as operators shifted spend on efficiency over growth. Market maturity means incremental efficiency gains flow straight to cash; standardize workflows, outsource noncore tasks selectively, and sweat high-utilization assets to boost free cash flow.
- 2024 focus: capture opex savings
- Standardize and automate
- Outsource low-value work
- Sweat assets, bank savings
Harvest cash: high-util midstream, profitable offshore and refineries fund transition
Legacy onshore (Gujarat/Assam) cash-positive with declining reserves; Mumbai High offshore breakeven >$70/boe vs 2024 Brent ≈$86/bl; HPCL ~15.8 MMTPA, MRPL ~15.0 MMTPA provide cyclical cash; midstream >90% utilization, sector returned ~$20B in distributions (2023); rigs/marine high utilization in 2024. Strategy: minimal growth capex, harvest cash to fund transition.
| Asset | 2024 metric | Role |
|---|---|---|
| Onshore | Stable opex, IOR | Cash generator |
| Offshore | Breakeven >$70/boe | High FCF |
| Refining | 15.8 /15.0 MMTPA | Cyclical cash |
| Midstream | >90% util, ~$20B | Stable cash |
What You See Is What You Get
Oil & Natural Gas BCG Matrix
The file you're previewing is the final Oil & Natural Gas BCG Matrix you'll receive after purchase. No watermarks, no demo content—just a fully formatted, ready-to-use strategic report. Built with sector-specific metrics and market-backed analysis for clear decision-making. Immediately downloadable, editable, and presentation-ready. One-time purchase, no surprises—ready to plug into planning or investor decks.











