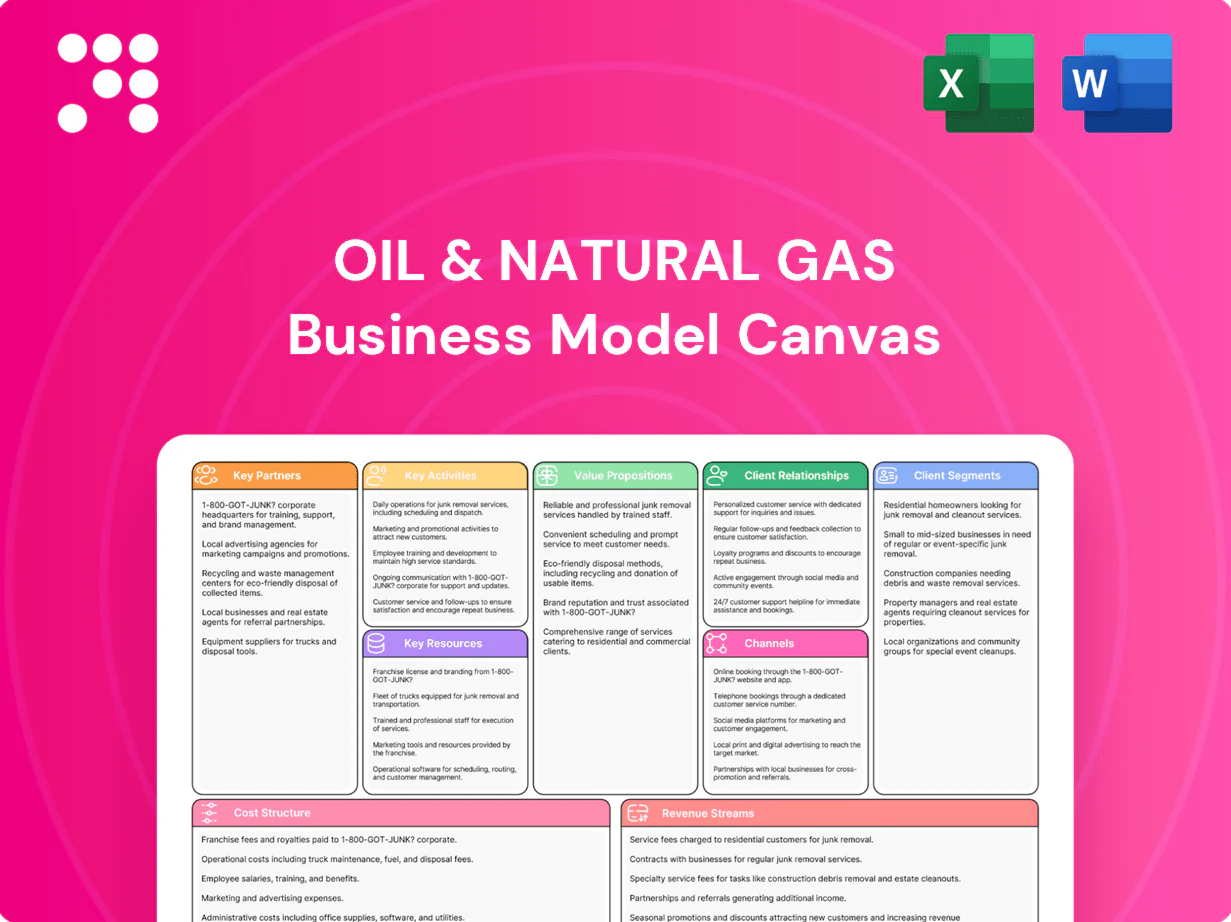
Oil & Natural Gas Business Model Canvas

Unlock the strategic Business Model Canvas for energy investors and planners
Unlock the full strategic blueprint behind Oil & Natural Gas's business model with our concise Business Model Canvas. This snapshot reveals value propositions, key partners, revenue streams and cost drivers. Ideal for investors, consultants, and entrepreneurs seeking actionable insight. Purchase the complete, editable Canvas to benchmark, plan, and scale with confidence.
Partnerships

Government & PSUs
Ministry and regulator alignment on licenses, pricing frameworks and policy stability enables stable operations for India’s oil sector, supporting a refining capacity of ~250 mtpa (≈5.0 mbpd) in 2024. Coordination with IOCL, BPCL and HPCL—which together handle roughly 75% of domestic throughput—secures crude offtake and product evacuation. Synchronized maintenance and supply planning reduces downtime and inventory shocks; links to 5.33 MMT strategic reserves bolster national energy security and market access.
Global E&P JVs
Alliances with foreign NOCs and IOCs de-risk exploration by sharing capital exposure and expertise, leveraging NOCs that hold about 70% of global oil reserves (IEA 2024). Access to frontier basins and advanced recovery techniques via JVs raises commercial discovery and recovery rates, shortening time-to-first-production. Joint ventures diversify portfolios across geographies while structured knowledge transfer accelerates project execution and operational scaling.

Oilfield Services
Drilling, seismic, subsea and EPC vendors supply core execution capacity, with Baker Hughes reporting a US rig count averaging roughly 740 in 2024, underscoring sustained demand for contractor fleets. Performance‑based contracts have delivered industry case‑study uptime gains of 10–20% and unit‑cost reductions, improving project IRR. Local suppliers reduce last‑mile logistics risk in remote terrains. Partnerships enable 30–50% surge capacity for campaign spikes.

Tech & R&D Partners
Universities and tech firms advance reservoir modeling and EOR workflows that can increase ultimate recovery by 10–20%; joint labs accelerate pilot-to-scale timelines. Digital twins, AI and IoT drive 3–10% upstream productivity gains per McKinsey and reduce operational risk while improving safety. Cyber and data partnerships mitigate breaches that cost about $4.45M on average in 2024 (IBM), hardening resilience.
- res_eor: +10–20% recovery
- digital_uplift: 3–10% productivity
- time_to_scale: accelerated via collaborations
- cyber_cost_2024: $4.45M avg breach
Midstream & Logistics
GAIL and regional pipeline operators move gas to demand centers via a network of roughly 13,000 km, while port, FPSO and shipping partners enable crude evacuation and export logistics. Storage and terminal tie-ups provide seasonal and operational buffers, complementing India's ~42 MMTPA LNG regas capacity in 2024. Integrated scheduling and real-time coordination cut demurrage and shrinkage, improving asset utilization.
- GAIL network ~13,000 km
- India LNG regas ~42 MMTPA (2024)
- Ports/FPSO enable export evacuation
- Storage/terminals smooth supply variability
- Integrated scheduling reduces demurrage
NOC-regulator alignment secures ~250 mtpa refining and pricing stability
Regulator + NOC alignment secures licenses, pricing stability and supports ~250 mtpa refining (≈5.0 mbpd) in 2024; IOCL/BPCL/HPCL handle ~75% domestic throughput. JVs with IOCs/NOCs de‑risk exploration (NOCs hold ~70% global reserves, IEA 2024) and improve recovery; vendor & tech alliances drive 3–10% digital uplift and +10–20% EOR gains. GAIL/pipe network ~13,000 km and 42 MMTPA LNG regas capacity enable evacuation and seasonal buffering.
| Partnership | Metric | 2024 |
|---|---|---|
| Refiners | Throughput share | ~75% |
| Refining | Capacity | ~250 mtpa |
| GAIL/pipes | Network | ~13,000 km |
| LNG regas | Capacity | 42 MMTPA |
What is included in the product
 Detailed Word Document
A comprehensive Business Model Canvas tailored to the Oil & Natural Gas sector, detailing customer segments, channels, value propositions, key activities, resources, partners, cost structure, and revenue streams. Designed for analysts and executives to evaluate strategy, competitive advantages, risks, and investment readiness.

 Customizable Excel Spreadsheet
High-level view of the oil & natural gas business model with editable cells, letting teams quickly identify upstream, midstream, downstream, cost drivers and revenue streams for faster decision-making. Great for boardrooms, investor pitches, and cross-functional collaboration to save hours of structuring your own model.
Activities

Exploration & Appraisal
Acquire seismic, drill wildcats (typical 2024 wildcat cost $30–80M) and evaluate prospects; global wildcat success averages ~25% guiding hit/miss budgeting. Basin modeling and petrophysics refine resource estimates and uncertainty ranges (P90–P50–P10) for reserves and recoverable volumes. Appraisal wells (often $10–40M each) define development plans and unit economics; portfolio ranking by NPV/IRR (hurdle ~15%) directs capital allocation.
Drilling & Production
Execute onshore and offshore drilling campaigns with industry safety standards while contributing to 2024 global oil demand of about 101.7 million b/d (IEA). Commission facilities, flowlines, and artificial lift to achieve typical production uptime targets near 98% and initial well rates ranging from hundreds to >1,000 bbl/d. Optimize lift costs and uptime through preventive maintenance and real-time surveillance to reduce unplanned downtime.

Reservoir & EOR
Build dynamic reservoir models to forecast recovery and optimize field economics, targeting recovery improvements of roughly 5–20 percentage points with EOR. Deploy waterflood, gas injection and chemical EOR tailored to reservoir type; EOR can add high-value barrels at lower breakevens versus new developments. Routine workovers and infill drilling sustain plateau rates, often offsetting 10–25% of natural decline. Integrate seismic, well and production data to tighten decline-curve forecasts and CAPEX planning.

Refining & Petrochem
- Subsidiary/JV ops
- Crude diet: +$3–5/bbl
- Turnarounds: −20% downtime
- Byproduct valorization: +2–3ppt yield
Marketing & Trading
Manage crude and gas sales contracts and tenders, aligning offtake volumes to market windows and physical logistics while referencing 2024 global oil demand of 101.6 million b/d (IEA) to size offers. Balance offtake with demand forecasts and vessel/terminal windows, hedge exposures within approved risk limits, and provide scheduling and nomination support to large B2B customers.
- Contracting: tenders & long/short-term sales
- Logistics: offtake vs vessel/terminal slots
- Risk: hedging within limits
- Customer: scheduling support for B2B
Wildcats: $30-80M, ~25% success; rank wells by NPV/IRR (>15%)
Explore: seismic, wildcats ($30–80M, ~25% success) and appraisal wells ($10–40M) to define P90–P50–P10 volumes and rank by NPV/IRR (hurdle ~15%). Develop: drilling, facilities, lift to hit ~98% uptime and initial well rates 100s–1,000+ bbl/d; EOR adds ~5–20ppt recovery. Market: sell/hedge aligning to 2024 demand ~101.7M b/d.
| Metric | 2024 |
|---|---|
| Wildcat cost | $30–80M |
| Success rate | ~25% |
| Global demand | 101.7M b/d |
| Uptime | ~98% |
Preview Before You Purchase
Business Model Canvas
The document you're previewing is the exact Oil & Natural Gas Business Model Canvas you'll receive after purchase. It's not a mockup—this live preview reflects the final editable file, fully structured for strategy, valuation inputs, and stakeholder use. Purchase grants immediate download in Word and Excel, ready to present or customize.

Unlock the strategic Business Model Canvas for energy investors and planners
Unlock the full strategic blueprint behind Oil & Natural Gas's business model with our concise Business Model Canvas. This snapshot reveals value propositions, key partners, revenue streams and cost drivers. Ideal for investors, consultants, and entrepreneurs seeking actionable insight. Purchase the complete, editable Canvas to benchmark, plan, and scale with confidence.
Partnerships
Government & PSUs
Ministry and regulator alignment on licenses, pricing frameworks and policy stability enables stable operations for India’s oil sector, supporting a refining capacity of ~250 mtpa (≈5.0 mbpd) in 2024. Coordination with IOCL, BPCL and HPCL—which together handle roughly 75% of domestic throughput—secures crude offtake and product evacuation. Synchronized maintenance and supply planning reduces downtime and inventory shocks; links to 5.33 MMT strategic reserves bolster national energy security and market access.
Global E&P JVs
Alliances with foreign NOCs and IOCs de-risk exploration by sharing capital exposure and expertise, leveraging NOCs that hold about 70% of global oil reserves (IEA 2024). Access to frontier basins and advanced recovery techniques via JVs raises commercial discovery and recovery rates, shortening time-to-first-production. Joint ventures diversify portfolios across geographies while structured knowledge transfer accelerates project execution and operational scaling.
Oilfield Services
Drilling, seismic, subsea and EPC vendors supply core execution capacity, with Baker Hughes reporting a US rig count averaging roughly 740 in 2024, underscoring sustained demand for contractor fleets. Performance‑based contracts have delivered industry case‑study uptime gains of 10–20% and unit‑cost reductions, improving project IRR. Local suppliers reduce last‑mile logistics risk in remote terrains. Partnerships enable 30–50% surge capacity for campaign spikes.
Tech & R&D Partners
Universities and tech firms advance reservoir modeling and EOR workflows that can increase ultimate recovery by 10–20%; joint labs accelerate pilot-to-scale timelines. Digital twins, AI and IoT drive 3–10% upstream productivity gains per McKinsey and reduce operational risk while improving safety. Cyber and data partnerships mitigate breaches that cost about $4.45M on average in 2024 (IBM), hardening resilience.
- res_eor: +10–20% recovery
- digital_uplift: 3–10% productivity
- time_to_scale: accelerated via collaborations
- cyber_cost_2024: $4.45M avg breach
Midstream & Logistics
GAIL and regional pipeline operators move gas to demand centers via a network of roughly 13,000 km, while port, FPSO and shipping partners enable crude evacuation and export logistics. Storage and terminal tie-ups provide seasonal and operational buffers, complementing India's ~42 MMTPA LNG regas capacity in 2024. Integrated scheduling and real-time coordination cut demurrage and shrinkage, improving asset utilization.
- GAIL network ~13,000 km
- India LNG regas ~42 MMTPA (2024)
- Ports/FPSO enable export evacuation
- Storage/terminals smooth supply variability
- Integrated scheduling reduces demurrage
NOC-regulator alignment secures ~250 mtpa refining and pricing stability
Regulator + NOC alignment secures licenses, pricing stability and supports ~250 mtpa refining (≈5.0 mbpd) in 2024; IOCL/BPCL/HPCL handle ~75% domestic throughput. JVs with IOCs/NOCs de‑risk exploration (NOCs hold ~70% global reserves, IEA 2024) and improve recovery; vendor & tech alliances drive 3–10% digital uplift and +10–20% EOR gains. GAIL/pipe network ~13,000 km and 42 MMTPA LNG regas capacity enable evacuation and seasonal buffering.
| Partnership | Metric | 2024 |
|---|---|---|
| Refiners | Throughput share | ~75% |
| Refining | Capacity | ~250 mtpa |
| GAIL/pipes | Network | ~13,000 km |
| LNG regas | Capacity | 42 MMTPA |
What is included in the product
Detailed Word Document
A comprehensive Business Model Canvas tailored to the Oil & Natural Gas sector, detailing customer segments, channels, value propositions, key activities, resources, partners, cost structure, and revenue streams. Designed for analysts and executives to evaluate strategy, competitive advantages, risks, and investment readiness.
Customizable Excel Spreadsheet
High-level view of the oil & natural gas business model with editable cells, letting teams quickly identify upstream, midstream, downstream, cost drivers and revenue streams for faster decision-making. Great for boardrooms, investor pitches, and cross-functional collaboration to save hours of structuring your own model.
Activities
Exploration & Appraisal
Acquire seismic, drill wildcats (typical 2024 wildcat cost $30–80M) and evaluate prospects; global wildcat success averages ~25% guiding hit/miss budgeting. Basin modeling and petrophysics refine resource estimates and uncertainty ranges (P90–P50–P10) for reserves and recoverable volumes. Appraisal wells (often $10–40M each) define development plans and unit economics; portfolio ranking by NPV/IRR (hurdle ~15%) directs capital allocation.
Drilling & Production
Execute onshore and offshore drilling campaigns with industry safety standards while contributing to 2024 global oil demand of about 101.7 million b/d (IEA). Commission facilities, flowlines, and artificial lift to achieve typical production uptime targets near 98% and initial well rates ranging from hundreds to >1,000 bbl/d. Optimize lift costs and uptime through preventive maintenance and real-time surveillance to reduce unplanned downtime.
Reservoir & EOR
Build dynamic reservoir models to forecast recovery and optimize field economics, targeting recovery improvements of roughly 5–20 percentage points with EOR. Deploy waterflood, gas injection and chemical EOR tailored to reservoir type; EOR can add high-value barrels at lower breakevens versus new developments. Routine workovers and infill drilling sustain plateau rates, often offsetting 10–25% of natural decline. Integrate seismic, well and production data to tighten decline-curve forecasts and CAPEX planning.
Refining & Petrochem
- Subsidiary/JV ops
- Crude diet: +$3–5/bbl
- Turnarounds: −20% downtime
- Byproduct valorization: +2–3ppt yield
Marketing & Trading
Manage crude and gas sales contracts and tenders, aligning offtake volumes to market windows and physical logistics while referencing 2024 global oil demand of 101.6 million b/d (IEA) to size offers. Balance offtake with demand forecasts and vessel/terminal windows, hedge exposures within approved risk limits, and provide scheduling and nomination support to large B2B customers.
- Contracting: tenders & long/short-term sales
- Logistics: offtake vs vessel/terminal slots
- Risk: hedging within limits
- Customer: scheduling support for B2B
Wildcats: $30-80M, ~25% success; rank wells by NPV/IRR (>15%)
Explore: seismic, wildcats ($30–80M, ~25% success) and appraisal wells ($10–40M) to define P90–P50–P10 volumes and rank by NPV/IRR (hurdle ~15%). Develop: drilling, facilities, lift to hit ~98% uptime and initial well rates 100s–1,000+ bbl/d; EOR adds ~5–20ppt recovery. Market: sell/hedge aligning to 2024 demand ~101.7M b/d.
| Metric | 2024 |
|---|---|
| Wildcat cost | $30–80M |
| Success rate | ~25% |
| Global demand | 101.7M b/d |
| Uptime | ~98% |
Preview Before You Purchase
Business Model Canvas
The document you're previewing is the exact Oil & Natural Gas Business Model Canvas you'll receive after purchase. It's not a mockup—this live preview reflects the final editable file, fully structured for strategy, valuation inputs, and stakeholder use. Purchase grants immediate download in Word and Excel, ready to present or customize.
Description
Unlock the strategic Business Model Canvas for energy investors and planners
Unlock the full strategic blueprint behind Oil & Natural Gas's business model with our concise Business Model Canvas. This snapshot reveals value propositions, key partners, revenue streams and cost drivers. Ideal for investors, consultants, and entrepreneurs seeking actionable insight. Purchase the complete, editable Canvas to benchmark, plan, and scale with confidence.
Partnerships
Government & PSUs
Ministry and regulator alignment on licenses, pricing frameworks and policy stability enables stable operations for India’s oil sector, supporting a refining capacity of ~250 mtpa (≈5.0 mbpd) in 2024. Coordination with IOCL, BPCL and HPCL—which together handle roughly 75% of domestic throughput—secures crude offtake and product evacuation. Synchronized maintenance and supply planning reduces downtime and inventory shocks; links to 5.33 MMT strategic reserves bolster national energy security and market access.
Global E&P JVs
Alliances with foreign NOCs and IOCs de-risk exploration by sharing capital exposure and expertise, leveraging NOCs that hold about 70% of global oil reserves (IEA 2024). Access to frontier basins and advanced recovery techniques via JVs raises commercial discovery and recovery rates, shortening time-to-first-production. Joint ventures diversify portfolios across geographies while structured knowledge transfer accelerates project execution and operational scaling.
Oilfield Services
Drilling, seismic, subsea and EPC vendors supply core execution capacity, with Baker Hughes reporting a US rig count averaging roughly 740 in 2024, underscoring sustained demand for contractor fleets. Performance‑based contracts have delivered industry case‑study uptime gains of 10–20% and unit‑cost reductions, improving project IRR. Local suppliers reduce last‑mile logistics risk in remote terrains. Partnerships enable 30–50% surge capacity for campaign spikes.
Tech & R&D Partners
Universities and tech firms advance reservoir modeling and EOR workflows that can increase ultimate recovery by 10–20%; joint labs accelerate pilot-to-scale timelines. Digital twins, AI and IoT drive 3–10% upstream productivity gains per McKinsey and reduce operational risk while improving safety. Cyber and data partnerships mitigate breaches that cost about $4.45M on average in 2024 (IBM), hardening resilience.
- res_eor: +10–20% recovery
- digital_uplift: 3–10% productivity
- time_to_scale: accelerated via collaborations
- cyber_cost_2024: $4.45M avg breach
Midstream & Logistics
GAIL and regional pipeline operators move gas to demand centers via a network of roughly 13,000 km, while port, FPSO and shipping partners enable crude evacuation and export logistics. Storage and terminal tie-ups provide seasonal and operational buffers, complementing India's ~42 MMTPA LNG regas capacity in 2024. Integrated scheduling and real-time coordination cut demurrage and shrinkage, improving asset utilization.
- GAIL network ~13,000 km
- India LNG regas ~42 MMTPA (2024)
- Ports/FPSO enable export evacuation
- Storage/terminals smooth supply variability
- Integrated scheduling reduces demurrage
NOC-regulator alignment secures ~250 mtpa refining and pricing stability
Regulator + NOC alignment secures licenses, pricing stability and supports ~250 mtpa refining (≈5.0 mbpd) in 2024; IOCL/BPCL/HPCL handle ~75% domestic throughput. JVs with IOCs/NOCs de‑risk exploration (NOCs hold ~70% global reserves, IEA 2024) and improve recovery; vendor & tech alliances drive 3–10% digital uplift and +10–20% EOR gains. GAIL/pipe network ~13,000 km and 42 MMTPA LNG regas capacity enable evacuation and seasonal buffering.
| Partnership | Metric | 2024 |
|---|---|---|
| Refiners | Throughput share | ~75% |
| Refining | Capacity | ~250 mtpa |
| GAIL/pipes | Network | ~13,000 km |
| LNG regas | Capacity | 42 MMTPA |
What is included in the product
Detailed Word Document
A comprehensive Business Model Canvas tailored to the Oil & Natural Gas sector, detailing customer segments, channels, value propositions, key activities, resources, partners, cost structure, and revenue streams. Designed for analysts and executives to evaluate strategy, competitive advantages, risks, and investment readiness.
Customizable Excel Spreadsheet
High-level view of the oil & natural gas business model with editable cells, letting teams quickly identify upstream, midstream, downstream, cost drivers and revenue streams for faster decision-making. Great for boardrooms, investor pitches, and cross-functional collaboration to save hours of structuring your own model.
Activities
Exploration & Appraisal
Acquire seismic, drill wildcats (typical 2024 wildcat cost $30–80M) and evaluate prospects; global wildcat success averages ~25% guiding hit/miss budgeting. Basin modeling and petrophysics refine resource estimates and uncertainty ranges (P90–P50–P10) for reserves and recoverable volumes. Appraisal wells (often $10–40M each) define development plans and unit economics; portfolio ranking by NPV/IRR (hurdle ~15%) directs capital allocation.
Drilling & Production
Execute onshore and offshore drilling campaigns with industry safety standards while contributing to 2024 global oil demand of about 101.7 million b/d (IEA). Commission facilities, flowlines, and artificial lift to achieve typical production uptime targets near 98% and initial well rates ranging from hundreds to >1,000 bbl/d. Optimize lift costs and uptime through preventive maintenance and real-time surveillance to reduce unplanned downtime.
Reservoir & EOR
Build dynamic reservoir models to forecast recovery and optimize field economics, targeting recovery improvements of roughly 5–20 percentage points with EOR. Deploy waterflood, gas injection and chemical EOR tailored to reservoir type; EOR can add high-value barrels at lower breakevens versus new developments. Routine workovers and infill drilling sustain plateau rates, often offsetting 10–25% of natural decline. Integrate seismic, well and production data to tighten decline-curve forecasts and CAPEX planning.
Refining & Petrochem
- Subsidiary/JV ops
- Crude diet: +$3–5/bbl
- Turnarounds: −20% downtime
- Byproduct valorization: +2–3ppt yield
Marketing & Trading
Manage crude and gas sales contracts and tenders, aligning offtake volumes to market windows and physical logistics while referencing 2024 global oil demand of 101.6 million b/d (IEA) to size offers. Balance offtake with demand forecasts and vessel/terminal windows, hedge exposures within approved risk limits, and provide scheduling and nomination support to large B2B customers.
- Contracting: tenders & long/short-term sales
- Logistics: offtake vs vessel/terminal slots
- Risk: hedging within limits
- Customer: scheduling support for B2B
Wildcats: $30-80M, ~25% success; rank wells by NPV/IRR (>15%)
Explore: seismic, wildcats ($30–80M, ~25% success) and appraisal wells ($10–40M) to define P90–P50–P10 volumes and rank by NPV/IRR (hurdle ~15%). Develop: drilling, facilities, lift to hit ~98% uptime and initial well rates 100s–1,000+ bbl/d; EOR adds ~5–20ppt recovery. Market: sell/hedge aligning to 2024 demand ~101.7M b/d.
| Metric | 2024 |
|---|---|
| Wildcat cost | $30–80M |
| Success rate | ~25% |
| Global demand | 101.7M b/d |
| Uptime | ~98% |
Preview Before You Purchase
Business Model Canvas
The document you're previewing is the exact Oil & Natural Gas Business Model Canvas you'll receive after purchase. It's not a mockup—this live preview reflects the final editable file, fully structured for strategy, valuation inputs, and stakeholder use. Purchase grants immediate download in Word and Excel, ready to present or customize.











