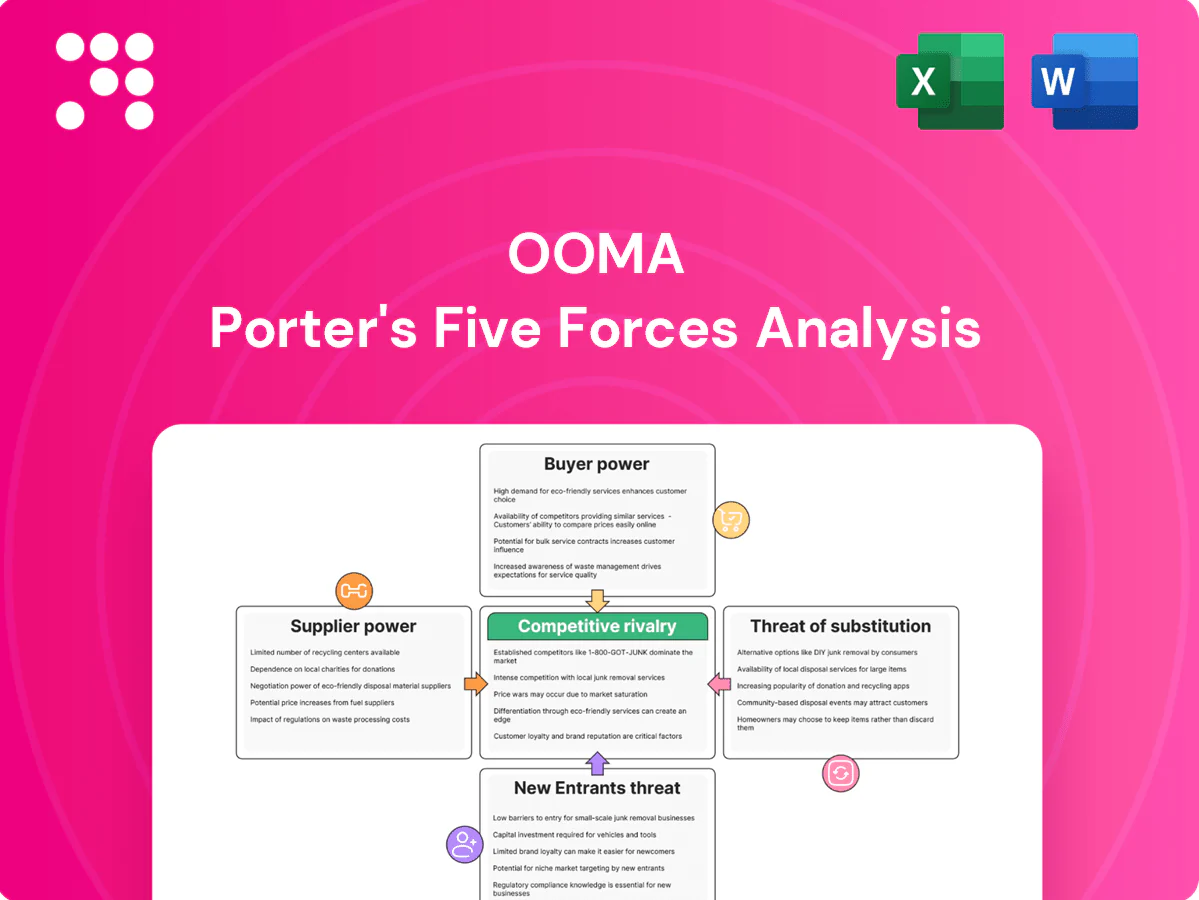
Ooma Porter's Five Forces Analysis

From Overview to Strategy Blueprint
Ooma’s Five Forces assessment shows strong rivalry from VoIP and unified-communications providers. Buyer power is moderate among price-sensitive SMBs, while suppliers—hardware and network partners—retain selective leverage. Cloud-native substitutes elevate threat levels even as software distribution lowers entry barriers.
This brief snapshot only scratches the surface. Unlock the full Porter's Five Forces Analysis to explore Ooma’s competitive dynamics, market pressures, and strategic advantages in detail.
Suppliers Bargaining Power

Dependence on carriers
Voice termination and origination rely on telecom carriers that control routes, quality, and fees; concentrated wholesale carriers can push prices or reduce flexibility, particularly as consolidation continued into 2024. Ooma mitigates supplier power through multi-homing and least-cost routing but switching carriers incurs operational friction and porting delays. Regulatory fees and surcharges—which rose modestly in 2024—further compress margins for retail VoIP providers.
Cloud infrastructure reliance
Ooma’s platforms depend on third-party cloud and data-center providers for uptime and scalability, exposing it to supplier pricing changes, egress fees and tiering. Hyperscalers held 2024 market share of roughly AWS 32%, Microsoft 22% and Google 11%, concentrating supplier power. Service disruptions or SLAs outside Ooma’s control create operational risk; diversification and edge PoPs mitigate but do not remove dependency.

Hardware and device suppliers
Hardware and device supply for Ooma (IP phones, adapters, security devices) is concentrated among a limited set of OEM/ODM partners, which raises supplier bargaining power. Component cycles and shortages — especially chips and radio modules — continued to affect cost and lead times into 2024, with over 60% of global foundry capacity concentrated in Taiwan and South Korea. Custom firmware and integration create moderate switching costs, while volume commitments secure pricing but raise exposure to obsolete inventory and demand swings.

Software and feature stack
Licensing for codecs, analytics and security modules raises supplier leverage and can compress Ooma’s gross margins if terms tighten; compliance modules like e911 and STIR/SHAKEN mandated in the US in 2024 further lock Ooma to certified vendors. Open-source options reduce vendor lock-in but increase integration and support costs, shifting spend from licensing to engineering.
- Supplier leverage: licensing dependency
- Margin risk: license term changes
- Open-source: lower fees, higher integration costs
- Compliance: e911/STIR-SHAKEN ties to certified vendors
Internet access quality
Service quality ultimately depends on customers' ISPs, creating an external dependency. ISPs can throttle or prioritize traffic, degrading perceived call quality. Ooma must invest in QoS tooling and diagnostics to detect and mitigate issues. Limited leverage over concentrated ISP markets elevates indirect supplier power.
- ISPs control last-mile; majority of US households use a small set of providers
- Ooma investment in QoS/diagnostics reduces churn and support costs
- High indirect supplier power limits pricing/leverage
Concentration (> 60%) of carriers, hyperscalers & foundries compresses margins, raises egress risk
Supplier power is moderate-high: wholesale carriers and ISP concentration (>60% US households with top providers) can push rates; carrier consolidation continued into 2024. Hyperscalers (AWS 32%, Azure 22%, GCP 11% in 2024) raise cloud pricing and egress risk. OEM/component concentration (foundries >60% capacity in Taiwan/ROK) and licensing/compliance (e911/STIR-SHAKEN mandates) compress margins.
| Metric | 2024 value | Implication |
|---|---|---|
| Top ISPs share | >60% | Last-mile leverage |
| Hyperscalers | AWS 32% Azure 22% GCP 11% | Cloud dependency |
| Foundry concentration | >60% | Supply risk |
| Compliance | e911/STIR-SHAKEN mandated | Vendor lock |
What is included in the product
 Detailed Word Document
Concise Porter’s Five Forces analysis tailored to Ooma, uncovering competitive intensity, buyer and supplier leverage, threat of substitutes and new entrants, and highlighting disruptive technologies, pricing pressures, and strategic barriers that shape Ooma’s profitability and market positioning.

 Customizable Excel Spreadsheet
A one-sheet Porter’s Five Forces for Ooma that visualizes competitive pressure with an editable radar chart, letting teams customize force levels, swap in current data, and paste directly into decks—no code required.
Customers Bargaining Power

SMB price sensitivity
Small and mid-sized businesses, which account for 99.9% of US firms per the U.S. SBA, are highly price-conscious and routinely compare per-seat rates across vendors. Transparent pricing on platforms like Ooma amplifies customer bargaining power. Discounts, bundles and promos are often expected as buying norms. Churn risk rises sharply when budgets tighten during economic slowdowns.
Low-to-moderate switching costs
Porting numbers, device reprovisioning and training create tangible but manageable switching costs for Ooma; 2024 industry reports estimate migration time averages 2–5 days per site and implementation spend often under $1,000 per user. Competing UCaaS vendors increasingly bundle migration tools, lowering barriers, while multi-homing — used by roughly two-thirds of enterprises in 2024 — reduces customer lock-in. Annual contracts provide revenue visibility but do not eliminate churn.

Feature parity expectations
Buyers now expect virtual receptionist, video, analytics and prebuilt integrations by default; a 2024 industry survey found 68% of buyers list these as baseline requirements. Rapid imitation across UCaaS compresses differentiation and drives pricing pressure. Feature gaps trigger vendor switches at renewals—churn risk rises notably when roadmaps lag. Continuous roadmap delivery is required to retain accounts.

Enterprise procurement leverage
Enterprise procurement exerts strong leverage: large customers demand volume discounts, strict SLAs and custom integrations, and use formal RFPs to force vendor concessions; lengthy security and compliance reviews frequently delay or cancel deals. Ooma improves negotiating power through customer references and industry certifications, which shorten procurement cycles and reduce perceived risk.
- Volume discounts required
- RFPs drive price concessions
- Security/compliance can derail deals
- References & certifications boost leverage
Consumer substitution options
Home users can shift to mobile-only or OTT apps quickly; the global OTT market reached about $170B in 2024, increasing substitution pressure on fixed-voice providers. Month-to-month plans raise bargaining power by enabling churn rates to spike into the mid-single digits monthly for telco services. Aggressive cable and wireless bundle promotions continue to lure defections, so Ooma must deliver clear value in reliability, features, and cost to retain users.
- Substitution: OTT ~$170B (2024)
- Churn risk: mid-single-digit monthly
- Drivers: reliability, features, cost
SMB UCaaS: price-sensitive buyers, 68% demand baseline; mid churn
Buyers (99.9% SMBs in US) are price-sensitive, expect discounts and baseline UCaaS features (68% in 2024), and churn rises in downturns. Switching costs (migration 2–5 days; implementation <$1,000/user) are real but falling; two-thirds multi-home in 2024. OTT substitution (~$170B 2024) and month-to-month plans drive mid-single-digit monthly churn. Large enterprises use RFPs, SLAs and discounts to extract concessions.
| Metric | 2024 |
|---|---|
| SMB share (US) | 99.9% |
| Baseline feature demand | 68% |
| Migration time | 2–5 days |
| OTT market | $170B |
| Monthly churn | mid-single-digit% |
Full Version Awaits
Ooma Porter's Five Forces Analysis
This preview shows the exact Porter’s Five Forces analysis for Ooma you’ll receive—no surprises, no placeholders. It evaluates competitive rivalry, supplier and buyer power, threats of substitutes and entrants, and strategic implications for Ooma’s VoIP and SMB markets. The document is fully formatted and ready for immediate download after purchase.

From Overview to Strategy Blueprint
Ooma’s Five Forces assessment shows strong rivalry from VoIP and unified-communications providers. Buyer power is moderate among price-sensitive SMBs, while suppliers—hardware and network partners—retain selective leverage. Cloud-native substitutes elevate threat levels even as software distribution lowers entry barriers.
This brief snapshot only scratches the surface. Unlock the full Porter's Five Forces Analysis to explore Ooma’s competitive dynamics, market pressures, and strategic advantages in detail.
Suppliers Bargaining Power
Dependence on carriers
Voice termination and origination rely on telecom carriers that control routes, quality, and fees; concentrated wholesale carriers can push prices or reduce flexibility, particularly as consolidation continued into 2024. Ooma mitigates supplier power through multi-homing and least-cost routing but switching carriers incurs operational friction and porting delays. Regulatory fees and surcharges—which rose modestly in 2024—further compress margins for retail VoIP providers.
Cloud infrastructure reliance
Ooma’s platforms depend on third-party cloud and data-center providers for uptime and scalability, exposing it to supplier pricing changes, egress fees and tiering. Hyperscalers held 2024 market share of roughly AWS 32%, Microsoft 22% and Google 11%, concentrating supplier power. Service disruptions or SLAs outside Ooma’s control create operational risk; diversification and edge PoPs mitigate but do not remove dependency.
Hardware and device suppliers
Hardware and device supply for Ooma (IP phones, adapters, security devices) is concentrated among a limited set of OEM/ODM partners, which raises supplier bargaining power. Component cycles and shortages — especially chips and radio modules — continued to affect cost and lead times into 2024, with over 60% of global foundry capacity concentrated in Taiwan and South Korea. Custom firmware and integration create moderate switching costs, while volume commitments secure pricing but raise exposure to obsolete inventory and demand swings.
Software and feature stack
Licensing for codecs, analytics and security modules raises supplier leverage and can compress Ooma’s gross margins if terms tighten; compliance modules like e911 and STIR/SHAKEN mandated in the US in 2024 further lock Ooma to certified vendors. Open-source options reduce vendor lock-in but increase integration and support costs, shifting spend from licensing to engineering.
- Supplier leverage: licensing dependency
- Margin risk: license term changes
- Open-source: lower fees, higher integration costs
- Compliance: e911/STIR-SHAKEN ties to certified vendors
Internet access quality
Service quality ultimately depends on customers' ISPs, creating an external dependency. ISPs can throttle or prioritize traffic, degrading perceived call quality. Ooma must invest in QoS tooling and diagnostics to detect and mitigate issues. Limited leverage over concentrated ISP markets elevates indirect supplier power.
- ISPs control last-mile; majority of US households use a small set of providers
- Ooma investment in QoS/diagnostics reduces churn and support costs
- High indirect supplier power limits pricing/leverage
Concentration (> 60%) of carriers, hyperscalers & foundries compresses margins, raises egress risk
Supplier power is moderate-high: wholesale carriers and ISP concentration (>60% US households with top providers) can push rates; carrier consolidation continued into 2024. Hyperscalers (AWS 32%, Azure 22%, GCP 11% in 2024) raise cloud pricing and egress risk. OEM/component concentration (foundries >60% capacity in Taiwan/ROK) and licensing/compliance (e911/STIR-SHAKEN mandates) compress margins.
| Metric | 2024 value | Implication |
|---|---|---|
| Top ISPs share | >60% | Last-mile leverage |
| Hyperscalers | AWS 32% Azure 22% GCP 11% | Cloud dependency |
| Foundry concentration | >60% | Supply risk |
| Compliance | e911/STIR-SHAKEN mandated | Vendor lock |
What is included in the product
Detailed Word Document
Concise Porter’s Five Forces analysis tailored to Ooma, uncovering competitive intensity, buyer and supplier leverage, threat of substitutes and new entrants, and highlighting disruptive technologies, pricing pressures, and strategic barriers that shape Ooma’s profitability and market positioning.
Customizable Excel Spreadsheet
A one-sheet Porter’s Five Forces for Ooma that visualizes competitive pressure with an editable radar chart, letting teams customize force levels, swap in current data, and paste directly into decks—no code required.
Customers Bargaining Power
SMB price sensitivity
Small and mid-sized businesses, which account for 99.9% of US firms per the U.S. SBA, are highly price-conscious and routinely compare per-seat rates across vendors. Transparent pricing on platforms like Ooma amplifies customer bargaining power. Discounts, bundles and promos are often expected as buying norms. Churn risk rises sharply when budgets tighten during economic slowdowns.
Low-to-moderate switching costs
Porting numbers, device reprovisioning and training create tangible but manageable switching costs for Ooma; 2024 industry reports estimate migration time averages 2–5 days per site and implementation spend often under $1,000 per user. Competing UCaaS vendors increasingly bundle migration tools, lowering barriers, while multi-homing — used by roughly two-thirds of enterprises in 2024 — reduces customer lock-in. Annual contracts provide revenue visibility but do not eliminate churn.
Feature parity expectations
Buyers now expect virtual receptionist, video, analytics and prebuilt integrations by default; a 2024 industry survey found 68% of buyers list these as baseline requirements. Rapid imitation across UCaaS compresses differentiation and drives pricing pressure. Feature gaps trigger vendor switches at renewals—churn risk rises notably when roadmaps lag. Continuous roadmap delivery is required to retain accounts.
Enterprise procurement leverage
Enterprise procurement exerts strong leverage: large customers demand volume discounts, strict SLAs and custom integrations, and use formal RFPs to force vendor concessions; lengthy security and compliance reviews frequently delay or cancel deals. Ooma improves negotiating power through customer references and industry certifications, which shorten procurement cycles and reduce perceived risk.
- Volume discounts required
- RFPs drive price concessions
- Security/compliance can derail deals
- References & certifications boost leverage
Consumer substitution options
Home users can shift to mobile-only or OTT apps quickly; the global OTT market reached about $170B in 2024, increasing substitution pressure on fixed-voice providers. Month-to-month plans raise bargaining power by enabling churn rates to spike into the mid-single digits monthly for telco services. Aggressive cable and wireless bundle promotions continue to lure defections, so Ooma must deliver clear value in reliability, features, and cost to retain users.
- Substitution: OTT ~$170B (2024)
- Churn risk: mid-single-digit monthly
- Drivers: reliability, features, cost
SMB UCaaS: price-sensitive buyers, 68% demand baseline; mid churn
Buyers (99.9% SMBs in US) are price-sensitive, expect discounts and baseline UCaaS features (68% in 2024), and churn rises in downturns. Switching costs (migration 2–5 days; implementation <$1,000/user) are real but falling; two-thirds multi-home in 2024. OTT substitution (~$170B 2024) and month-to-month plans drive mid-single-digit monthly churn. Large enterprises use RFPs, SLAs and discounts to extract concessions.
| Metric | 2024 |
|---|---|
| SMB share (US) | 99.9% |
| Baseline feature demand | 68% |
| Migration time | 2–5 days |
| OTT market | $170B |
| Monthly churn | mid-single-digit% |
Full Version Awaits
Ooma Porter's Five Forces Analysis
This preview shows the exact Porter’s Five Forces analysis for Ooma you’ll receive—no surprises, no placeholders. It evaluates competitive rivalry, supplier and buyer power, threats of substitutes and entrants, and strategic implications for Ooma’s VoIP and SMB markets. The document is fully formatted and ready for immediate download after purchase.
Original: $10.00
-65%$10.00
$3.50Description
From Overview to Strategy Blueprint
Ooma’s Five Forces assessment shows strong rivalry from VoIP and unified-communications providers. Buyer power is moderate among price-sensitive SMBs, while suppliers—hardware and network partners—retain selective leverage. Cloud-native substitutes elevate threat levels even as software distribution lowers entry barriers.
This brief snapshot only scratches the surface. Unlock the full Porter's Five Forces Analysis to explore Ooma’s competitive dynamics, market pressures, and strategic advantages in detail.
Suppliers Bargaining Power
Dependence on carriers
Voice termination and origination rely on telecom carriers that control routes, quality, and fees; concentrated wholesale carriers can push prices or reduce flexibility, particularly as consolidation continued into 2024. Ooma mitigates supplier power through multi-homing and least-cost routing but switching carriers incurs operational friction and porting delays. Regulatory fees and surcharges—which rose modestly in 2024—further compress margins for retail VoIP providers.
Cloud infrastructure reliance
Ooma’s platforms depend on third-party cloud and data-center providers for uptime and scalability, exposing it to supplier pricing changes, egress fees and tiering. Hyperscalers held 2024 market share of roughly AWS 32%, Microsoft 22% and Google 11%, concentrating supplier power. Service disruptions or SLAs outside Ooma’s control create operational risk; diversification and edge PoPs mitigate but do not remove dependency.
Hardware and device suppliers
Hardware and device supply for Ooma (IP phones, adapters, security devices) is concentrated among a limited set of OEM/ODM partners, which raises supplier bargaining power. Component cycles and shortages — especially chips and radio modules — continued to affect cost and lead times into 2024, with over 60% of global foundry capacity concentrated in Taiwan and South Korea. Custom firmware and integration create moderate switching costs, while volume commitments secure pricing but raise exposure to obsolete inventory and demand swings.
Software and feature stack
Licensing for codecs, analytics and security modules raises supplier leverage and can compress Ooma’s gross margins if terms tighten; compliance modules like e911 and STIR/SHAKEN mandated in the US in 2024 further lock Ooma to certified vendors. Open-source options reduce vendor lock-in but increase integration and support costs, shifting spend from licensing to engineering.
- Supplier leverage: licensing dependency
- Margin risk: license term changes
- Open-source: lower fees, higher integration costs
- Compliance: e911/STIR-SHAKEN ties to certified vendors
Internet access quality
Service quality ultimately depends on customers' ISPs, creating an external dependency. ISPs can throttle or prioritize traffic, degrading perceived call quality. Ooma must invest in QoS tooling and diagnostics to detect and mitigate issues. Limited leverage over concentrated ISP markets elevates indirect supplier power.
- ISPs control last-mile; majority of US households use a small set of providers
- Ooma investment in QoS/diagnostics reduces churn and support costs
- High indirect supplier power limits pricing/leverage
Concentration (> 60%) of carriers, hyperscalers & foundries compresses margins, raises egress risk
Supplier power is moderate-high: wholesale carriers and ISP concentration (>60% US households with top providers) can push rates; carrier consolidation continued into 2024. Hyperscalers (AWS 32%, Azure 22%, GCP 11% in 2024) raise cloud pricing and egress risk. OEM/component concentration (foundries >60% capacity in Taiwan/ROK) and licensing/compliance (e911/STIR-SHAKEN mandates) compress margins.
| Metric | 2024 value | Implication |
|---|---|---|
| Top ISPs share | >60% | Last-mile leverage |
| Hyperscalers | AWS 32% Azure 22% GCP 11% | Cloud dependency |
| Foundry concentration | >60% | Supply risk |
| Compliance | e911/STIR-SHAKEN mandated | Vendor lock |
What is included in the product
Detailed Word Document
Concise Porter’s Five Forces analysis tailored to Ooma, uncovering competitive intensity, buyer and supplier leverage, threat of substitutes and new entrants, and highlighting disruptive technologies, pricing pressures, and strategic barriers that shape Ooma’s profitability and market positioning.
Customizable Excel Spreadsheet
A one-sheet Porter’s Five Forces for Ooma that visualizes competitive pressure with an editable radar chart, letting teams customize force levels, swap in current data, and paste directly into decks—no code required.
Customers Bargaining Power
SMB price sensitivity
Small and mid-sized businesses, which account for 99.9% of US firms per the U.S. SBA, are highly price-conscious and routinely compare per-seat rates across vendors. Transparent pricing on platforms like Ooma amplifies customer bargaining power. Discounts, bundles and promos are often expected as buying norms. Churn risk rises sharply when budgets tighten during economic slowdowns.
Low-to-moderate switching costs
Porting numbers, device reprovisioning and training create tangible but manageable switching costs for Ooma; 2024 industry reports estimate migration time averages 2–5 days per site and implementation spend often under $1,000 per user. Competing UCaaS vendors increasingly bundle migration tools, lowering barriers, while multi-homing — used by roughly two-thirds of enterprises in 2024 — reduces customer lock-in. Annual contracts provide revenue visibility but do not eliminate churn.
Feature parity expectations
Buyers now expect virtual receptionist, video, analytics and prebuilt integrations by default; a 2024 industry survey found 68% of buyers list these as baseline requirements. Rapid imitation across UCaaS compresses differentiation and drives pricing pressure. Feature gaps trigger vendor switches at renewals—churn risk rises notably when roadmaps lag. Continuous roadmap delivery is required to retain accounts.
Enterprise procurement leverage
Enterprise procurement exerts strong leverage: large customers demand volume discounts, strict SLAs and custom integrations, and use formal RFPs to force vendor concessions; lengthy security and compliance reviews frequently delay or cancel deals. Ooma improves negotiating power through customer references and industry certifications, which shorten procurement cycles and reduce perceived risk.
- Volume discounts required
- RFPs drive price concessions
- Security/compliance can derail deals
- References & certifications boost leverage
Consumer substitution options
Home users can shift to mobile-only or OTT apps quickly; the global OTT market reached about $170B in 2024, increasing substitution pressure on fixed-voice providers. Month-to-month plans raise bargaining power by enabling churn rates to spike into the mid-single digits monthly for telco services. Aggressive cable and wireless bundle promotions continue to lure defections, so Ooma must deliver clear value in reliability, features, and cost to retain users.
- Substitution: OTT ~$170B (2024)
- Churn risk: mid-single-digit monthly
- Drivers: reliability, features, cost
SMB UCaaS: price-sensitive buyers, 68% demand baseline; mid churn
Buyers (99.9% SMBs in US) are price-sensitive, expect discounts and baseline UCaaS features (68% in 2024), and churn rises in downturns. Switching costs (migration 2–5 days; implementation <$1,000/user) are real but falling; two-thirds multi-home in 2024. OTT substitution (~$170B 2024) and month-to-month plans drive mid-single-digit monthly churn. Large enterprises use RFPs, SLAs and discounts to extract concessions.
| Metric | 2024 |
|---|---|
| SMB share (US) | 99.9% |
| Baseline feature demand | 68% |
| Migration time | 2–5 days |
| OTT market | $170B |
| Monthly churn | mid-single-digit% |
Full Version Awaits
Ooma Porter's Five Forces Analysis
This preview shows the exact Porter’s Five Forces analysis for Ooma you’ll receive—no surprises, no placeholders. It evaluates competitive rivalry, supplier and buyer power, threats of substitutes and entrants, and strategic implications for Ooma’s VoIP and SMB markets. The document is fully formatted and ready for immediate download after purchase.











