OPmobility Porter's Five Forces Analysis

A Must-Have Tool for Decision-Makers
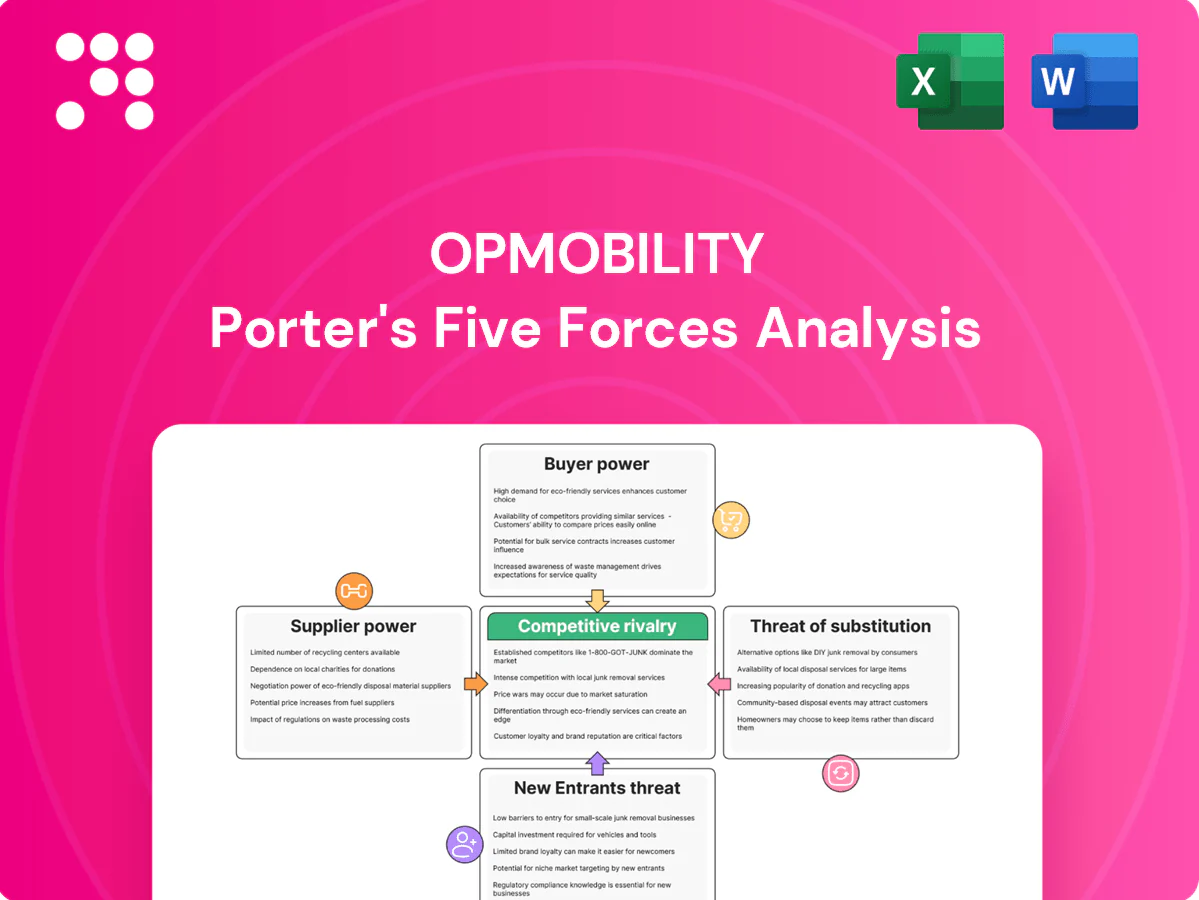
This snapshot highlights OPmobility’s competitive tensions across supplier power, buyer influence, rivalry, substitutes, and entry threats, showing strategic pressure points and opportunities. The full Porter's Five Forces Analysis delivers force-by-force ratings, visuals, and tactical recommendations to inform investment or strategy decisions—unlock the complete report for a consultant-grade deep dive.
Suppliers Bargaining Power

Concentrated petrochemical inputs
Key polymers and resins are supplied by a concentrated set of majors—in 2024 the top five petrochemical groups account for roughly half of global polymer capacity—concentrating pricing power upstream. Feedstock swings (ethylene/naphtha) that can represent up to 60% of polymer cost compress margins and force repricing. Hedging and formula contracts reduce but do not remove volatility. OPmobility mitigates risk via multisourcing and increased recycled-content use.
Specialized tooling and molds
High-precision molds (typically $100k–$1.5M) and painting/assembly equipment ($250k–$3M) are capital- and supplier-specific, with tooling lead times of 6–18 months creating switching frictions that can raise procurement and downtime costs by ~5–12%. Co-investment or owned tooling reduces supplier dependence but locks 15–40% of project CAPEX. Early supplier involvement commonly trims lifecycle cost by ~8–15%.

Electronics and sensor components
Intelligent exterior systems depend on cameras, radars and ECUs sourced from a constrained semiconductor ecosystem—automotive semiconductors were roughly 9% of global chip revenue in 2024—so allocation cycles often favor higher-margin segments, tightening supply. Design-to-dual-source and approved-vendor lists are essential mitigants. Vertical roadmap collaboration and multi-year wafer allocations help secure capacity and reduce obsolescence risk.

Hydrogen and advanced materials
Clean-energy systems require certified carbon fiber, liners, valves and H2 components from niche vendors, raising supplier bargaining power as safety regs restrict acceptable sources; certified carbon fiber prices in 2024 are roughly $20–30/kg. Long-term offtake agreements and joint development (5–10 year terms common) stabilize cost and supply risk, while volume scaling can cut unit costs by ~20–30% over time.
Local content and logistics constraints
OEM mandates for local sourcing and JIT delivery in 2024 concentrated procurement regionally, narrowing supplier pools and increasing leverage for proximate vendors; freight and tariff dynamics post-2021 supply shocks further shifted bargaining power toward nearby suppliers. Regional dual sourcing and nearshoring initiatives in 2024 lowered single-supplier dependency, while expanded digital supply-chain visibility enabled preemptive disruption management and timely contract renegotiations.
- Local mandates/JIT concentrate options regionally
- Freight/tariffs favor proximate suppliers
- Dual sourcing/nearshoring reduce dependency
- Real-time visibility strengthens renegotiation
Top-5 ≈50% polymer control and $20-30/kg carbon fiber squeeze suppliers
Top‑5 petrochemical groups hold ≈50% polymer capacity (2024) and carbon fiber costs $20–30/kg, giving suppliers strong leverage. Tooling lead times (6–18m) and semiconductor allocations raise switching costs. Dual‑sourcing, long offtakes and nearshoring reduce risk.
| Supplier | 2024 metric | Impact |
|---|---|---|
| Polymers | Top‑5 ≈50% cap | Price leverage |
| Carbon fiber | $20–30/kg | Source constraint |
| Tooling | Lead 6–18m | Switching cost |
What is included in the product
 Detailed Word Document
Tailored Porter's Five Forces analysis for OPmobility that uncovers competitive drivers, buyer and supplier power, entry barriers, substitutes, and disruptive threats to its market share, with strategic insights to inform pricing, positioning, and investor or internal strategy materials.

 Customizable Excel Spreadsheet
One-sheet Porter's Five Forces for OPmobility that turns complex competitive dynamics into a single, actionable view—customize pressure levels, swap in your data, and export a ready-to-use radar chart for decks or dashboards. No code, easy duplication for scenario analysis (pre/post regulation, new entrants) and seamless integration into reports.
Customers Bargaining Power

Highly concentrated OEM customers
Global automakers are few and large—top seven OEMs accounted for roughly 60% of global light-vehicle output (~78 million units in 2024), giving them outsized negotiating leverage. Platform nominations and RFQ cycles of 12–36 months intensify price and service pressure; losing a platform can reduce loadings by an estimated 15–30%. Deep account management and clear innovation value-add (cost-down, electrification solutions) are essential to defend margins.
Stringent quality and penalty regimes
IATF 16949 and PPAP drive zero-defect expectations, shifting risk to suppliers via warranties and chargebacks; COPQ can reach up to 15% of program revenue and erase margins. Robust APQP and end-to-end traceability are mandatory to contain exposure, while predictive quality and in-line inspection data reduce defects and strengthen suppliers’ bargaining power on payment and warranty terms.

Price-down and open-book norms
Annual productivity givebacks of roughly 2–5% p.a. and open-book costing are standard in automotive; buyers push continuous cost reductions across program life and use open books to enforce targets. Suppliers can trade documented material and process efficiencies for incremental volume or scope, often gaining 5–15% margin relief. Indexation clauses, common since 2020, hedge raw-material swings that have varied up to ±25% y/y and temper buyer power.

Switching costs vs re-sourcing threats
Tooling and validation create switching costs—typical launch cycles add 6–18 months and tooling investments often range from $1–10M—yet OEMs routinely dual-source critical modules to preserve leverage, with industry surveys in 2024 showing dual-sourcing for key parts exceeding 50% in top OEM programs.
- Performance slippage triggers re-sourcing, keeping prices keen
- Launch excellence and flawless delivery secure sticky incumbency
- Modular innovation raises buyer exit costs, softening customer power
EV transition reshaping specs
Shift to EVs changes module integration, thermal management and exterior sensor placement, driving buyers to demand lighter, smarter fascias at equal or lower cost; global EV share rose to ~16% in 2024, intensifying spec shifts and supplier consolidation. Early co-development on ADAS and aero secures design locks, raising specification influence and pricing power.
OEM concentration and dual-sourcing, 16% EV share spurs co-development demand
Large OEM concentration (top 7 ≈60% of ~78M light vehicles in 2024) and 12–36 month RFQs give buyers strong price leverage; platform loss can cut loadings 15–30%. Quality-driven chargebacks push COPQ up to ~15% of program revenue while dual-sourcing >50% of key parts preserves buyer options. EV share ~16% in 2024 raises spec churn, increasing demand for co-development to lock designs.
| Metric | 2024 value |
|---|---|
| Top 7 OEM share | ≈60% |
| Global LV output | ~78M units |
| EV share | ~16% |
| Dual-sourcing (key parts) | >50% |
| COPQ | up to 15% revenue |
| Platform loss impact | 15–30% |
| Tooling investment | $1–10M |
What You See Is What You Get
OPmobility Porter's Five Forces Analysis
This preview is the exact OPmobility Porter's Five Forces analysis you will receive upon purchase—fully formatted, complete, and ready to use. It includes supplier, buyer, rivalry, entrant, and substitute assessments with supporting evidence. No placeholders or samples; instant download upon payment.

A Must-Have Tool for Decision-Makers
This snapshot highlights OPmobility’s competitive tensions across supplier power, buyer influence, rivalry, substitutes, and entry threats, showing strategic pressure points and opportunities. The full Porter's Five Forces Analysis delivers force-by-force ratings, visuals, and tactical recommendations to inform investment or strategy decisions—unlock the complete report for a consultant-grade deep dive.
Suppliers Bargaining Power
Concentrated petrochemical inputs
Key polymers and resins are supplied by a concentrated set of majors—in 2024 the top five petrochemical groups account for roughly half of global polymer capacity—concentrating pricing power upstream. Feedstock swings (ethylene/naphtha) that can represent up to 60% of polymer cost compress margins and force repricing. Hedging and formula contracts reduce but do not remove volatility. OPmobility mitigates risk via multisourcing and increased recycled-content use.
Specialized tooling and molds
High-precision molds (typically $100k–$1.5M) and painting/assembly equipment ($250k–$3M) are capital- and supplier-specific, with tooling lead times of 6–18 months creating switching frictions that can raise procurement and downtime costs by ~5–12%. Co-investment or owned tooling reduces supplier dependence but locks 15–40% of project CAPEX. Early supplier involvement commonly trims lifecycle cost by ~8–15%.
Electronics and sensor components
Intelligent exterior systems depend on cameras, radars and ECUs sourced from a constrained semiconductor ecosystem—automotive semiconductors were roughly 9% of global chip revenue in 2024—so allocation cycles often favor higher-margin segments, tightening supply. Design-to-dual-source and approved-vendor lists are essential mitigants. Vertical roadmap collaboration and multi-year wafer allocations help secure capacity and reduce obsolescence risk.
Hydrogen and advanced materials
Clean-energy systems require certified carbon fiber, liners, valves and H2 components from niche vendors, raising supplier bargaining power as safety regs restrict acceptable sources; certified carbon fiber prices in 2024 are roughly $20–30/kg. Long-term offtake agreements and joint development (5–10 year terms common) stabilize cost and supply risk, while volume scaling can cut unit costs by ~20–30% over time.
Local content and logistics constraints
OEM mandates for local sourcing and JIT delivery in 2024 concentrated procurement regionally, narrowing supplier pools and increasing leverage for proximate vendors; freight and tariff dynamics post-2021 supply shocks further shifted bargaining power toward nearby suppliers. Regional dual sourcing and nearshoring initiatives in 2024 lowered single-supplier dependency, while expanded digital supply-chain visibility enabled preemptive disruption management and timely contract renegotiations.
- Local mandates/JIT concentrate options regionally
- Freight/tariffs favor proximate suppliers
- Dual sourcing/nearshoring reduce dependency
- Real-time visibility strengthens renegotiation
Top-5 ≈50% polymer control and $20-30/kg carbon fiber squeeze suppliers
Top‑5 petrochemical groups hold ≈50% polymer capacity (2024) and carbon fiber costs $20–30/kg, giving suppliers strong leverage. Tooling lead times (6–18m) and semiconductor allocations raise switching costs. Dual‑sourcing, long offtakes and nearshoring reduce risk.
| Supplier | 2024 metric | Impact |
|---|---|---|
| Polymers | Top‑5 ≈50% cap | Price leverage |
| Carbon fiber | $20–30/kg | Source constraint |
| Tooling | Lead 6–18m | Switching cost |
What is included in the product
Detailed Word Document
Tailored Porter's Five Forces analysis for OPmobility that uncovers competitive drivers, buyer and supplier power, entry barriers, substitutes, and disruptive threats to its market share, with strategic insights to inform pricing, positioning, and investor or internal strategy materials.
Customizable Excel Spreadsheet
One-sheet Porter's Five Forces for OPmobility that turns complex competitive dynamics into a single, actionable view—customize pressure levels, swap in your data, and export a ready-to-use radar chart for decks or dashboards. No code, easy duplication for scenario analysis (pre/post regulation, new entrants) and seamless integration into reports.
Customers Bargaining Power
Highly concentrated OEM customers
Global automakers are few and large—top seven OEMs accounted for roughly 60% of global light-vehicle output (~78 million units in 2024), giving them outsized negotiating leverage. Platform nominations and RFQ cycles of 12–36 months intensify price and service pressure; losing a platform can reduce loadings by an estimated 15–30%. Deep account management and clear innovation value-add (cost-down, electrification solutions) are essential to defend margins.
Stringent quality and penalty regimes
IATF 16949 and PPAP drive zero-defect expectations, shifting risk to suppliers via warranties and chargebacks; COPQ can reach up to 15% of program revenue and erase margins. Robust APQP and end-to-end traceability are mandatory to contain exposure, while predictive quality and in-line inspection data reduce defects and strengthen suppliers’ bargaining power on payment and warranty terms.
Price-down and open-book norms
Annual productivity givebacks of roughly 2–5% p.a. and open-book costing are standard in automotive; buyers push continuous cost reductions across program life and use open books to enforce targets. Suppliers can trade documented material and process efficiencies for incremental volume or scope, often gaining 5–15% margin relief. Indexation clauses, common since 2020, hedge raw-material swings that have varied up to ±25% y/y and temper buyer power.
Switching costs vs re-sourcing threats
Tooling and validation create switching costs—typical launch cycles add 6–18 months and tooling investments often range from $1–10M—yet OEMs routinely dual-source critical modules to preserve leverage, with industry surveys in 2024 showing dual-sourcing for key parts exceeding 50% in top OEM programs.
- Performance slippage triggers re-sourcing, keeping prices keen
- Launch excellence and flawless delivery secure sticky incumbency
- Modular innovation raises buyer exit costs, softening customer power
EV transition reshaping specs
Shift to EVs changes module integration, thermal management and exterior sensor placement, driving buyers to demand lighter, smarter fascias at equal or lower cost; global EV share rose to ~16% in 2024, intensifying spec shifts and supplier consolidation. Early co-development on ADAS and aero secures design locks, raising specification influence and pricing power.
OEM concentration and dual-sourcing, 16% EV share spurs co-development demand
Large OEM concentration (top 7 ≈60% of ~78M light vehicles in 2024) and 12–36 month RFQs give buyers strong price leverage; platform loss can cut loadings 15–30%. Quality-driven chargebacks push COPQ up to ~15% of program revenue while dual-sourcing >50% of key parts preserves buyer options. EV share ~16% in 2024 raises spec churn, increasing demand for co-development to lock designs.
| Metric | 2024 value |
|---|---|
| Top 7 OEM share | ≈60% |
| Global LV output | ~78M units |
| EV share | ~16% |
| Dual-sourcing (key parts) | >50% |
| COPQ | up to 15% revenue |
| Platform loss impact | 15–30% |
| Tooling investment | $1–10M |
What You See Is What You Get
OPmobility Porter's Five Forces Analysis
This preview is the exact OPmobility Porter's Five Forces analysis you will receive upon purchase—fully formatted, complete, and ready to use. It includes supplier, buyer, rivalry, entrant, and substitute assessments with supporting evidence. No placeholders or samples; instant download upon payment.
Original: $10.00
-65%$10.00
$3.50Description
A Must-Have Tool for Decision-Makers
This snapshot highlights OPmobility’s competitive tensions across supplier power, buyer influence, rivalry, substitutes, and entry threats, showing strategic pressure points and opportunities. The full Porter's Five Forces Analysis delivers force-by-force ratings, visuals, and tactical recommendations to inform investment or strategy decisions—unlock the complete report for a consultant-grade deep dive.
Suppliers Bargaining Power
Concentrated petrochemical inputs
Key polymers and resins are supplied by a concentrated set of majors—in 2024 the top five petrochemical groups account for roughly half of global polymer capacity—concentrating pricing power upstream. Feedstock swings (ethylene/naphtha) that can represent up to 60% of polymer cost compress margins and force repricing. Hedging and formula contracts reduce but do not remove volatility. OPmobility mitigates risk via multisourcing and increased recycled-content use.
Specialized tooling and molds
High-precision molds (typically $100k–$1.5M) and painting/assembly equipment ($250k–$3M) are capital- and supplier-specific, with tooling lead times of 6–18 months creating switching frictions that can raise procurement and downtime costs by ~5–12%. Co-investment or owned tooling reduces supplier dependence but locks 15–40% of project CAPEX. Early supplier involvement commonly trims lifecycle cost by ~8–15%.
Electronics and sensor components
Intelligent exterior systems depend on cameras, radars and ECUs sourced from a constrained semiconductor ecosystem—automotive semiconductors were roughly 9% of global chip revenue in 2024—so allocation cycles often favor higher-margin segments, tightening supply. Design-to-dual-source and approved-vendor lists are essential mitigants. Vertical roadmap collaboration and multi-year wafer allocations help secure capacity and reduce obsolescence risk.
Hydrogen and advanced materials
Clean-energy systems require certified carbon fiber, liners, valves and H2 components from niche vendors, raising supplier bargaining power as safety regs restrict acceptable sources; certified carbon fiber prices in 2024 are roughly $20–30/kg. Long-term offtake agreements and joint development (5–10 year terms common) stabilize cost and supply risk, while volume scaling can cut unit costs by ~20–30% over time.
Local content and logistics constraints
OEM mandates for local sourcing and JIT delivery in 2024 concentrated procurement regionally, narrowing supplier pools and increasing leverage for proximate vendors; freight and tariff dynamics post-2021 supply shocks further shifted bargaining power toward nearby suppliers. Regional dual sourcing and nearshoring initiatives in 2024 lowered single-supplier dependency, while expanded digital supply-chain visibility enabled preemptive disruption management and timely contract renegotiations.
- Local mandates/JIT concentrate options regionally
- Freight/tariffs favor proximate suppliers
- Dual sourcing/nearshoring reduce dependency
- Real-time visibility strengthens renegotiation
Top-5 ≈50% polymer control and $20-30/kg carbon fiber squeeze suppliers
Top‑5 petrochemical groups hold ≈50% polymer capacity (2024) and carbon fiber costs $20–30/kg, giving suppliers strong leverage. Tooling lead times (6–18m) and semiconductor allocations raise switching costs. Dual‑sourcing, long offtakes and nearshoring reduce risk.
| Supplier | 2024 metric | Impact |
|---|---|---|
| Polymers | Top‑5 ≈50% cap | Price leverage |
| Carbon fiber | $20–30/kg | Source constraint |
| Tooling | Lead 6–18m | Switching cost |
What is included in the product
Detailed Word Document
Tailored Porter's Five Forces analysis for OPmobility that uncovers competitive drivers, buyer and supplier power, entry barriers, substitutes, and disruptive threats to its market share, with strategic insights to inform pricing, positioning, and investor or internal strategy materials.
Customizable Excel Spreadsheet
One-sheet Porter's Five Forces for OPmobility that turns complex competitive dynamics into a single, actionable view—customize pressure levels, swap in your data, and export a ready-to-use radar chart for decks or dashboards. No code, easy duplication for scenario analysis (pre/post regulation, new entrants) and seamless integration into reports.
Customers Bargaining Power
Highly concentrated OEM customers
Global automakers are few and large—top seven OEMs accounted for roughly 60% of global light-vehicle output (~78 million units in 2024), giving them outsized negotiating leverage. Platform nominations and RFQ cycles of 12–36 months intensify price and service pressure; losing a platform can reduce loadings by an estimated 15–30%. Deep account management and clear innovation value-add (cost-down, electrification solutions) are essential to defend margins.
Stringent quality and penalty regimes
IATF 16949 and PPAP drive zero-defect expectations, shifting risk to suppliers via warranties and chargebacks; COPQ can reach up to 15% of program revenue and erase margins. Robust APQP and end-to-end traceability are mandatory to contain exposure, while predictive quality and in-line inspection data reduce defects and strengthen suppliers’ bargaining power on payment and warranty terms.
Price-down and open-book norms
Annual productivity givebacks of roughly 2–5% p.a. and open-book costing are standard in automotive; buyers push continuous cost reductions across program life and use open books to enforce targets. Suppliers can trade documented material and process efficiencies for incremental volume or scope, often gaining 5–15% margin relief. Indexation clauses, common since 2020, hedge raw-material swings that have varied up to ±25% y/y and temper buyer power.
Switching costs vs re-sourcing threats
Tooling and validation create switching costs—typical launch cycles add 6–18 months and tooling investments often range from $1–10M—yet OEMs routinely dual-source critical modules to preserve leverage, with industry surveys in 2024 showing dual-sourcing for key parts exceeding 50% in top OEM programs.
- Performance slippage triggers re-sourcing, keeping prices keen
- Launch excellence and flawless delivery secure sticky incumbency
- Modular innovation raises buyer exit costs, softening customer power
EV transition reshaping specs
Shift to EVs changes module integration, thermal management and exterior sensor placement, driving buyers to demand lighter, smarter fascias at equal or lower cost; global EV share rose to ~16% in 2024, intensifying spec shifts and supplier consolidation. Early co-development on ADAS and aero secures design locks, raising specification influence and pricing power.
OEM concentration and dual-sourcing, 16% EV share spurs co-development demand
Large OEM concentration (top 7 ≈60% of ~78M light vehicles in 2024) and 12–36 month RFQs give buyers strong price leverage; platform loss can cut loadings 15–30%. Quality-driven chargebacks push COPQ up to ~15% of program revenue while dual-sourcing >50% of key parts preserves buyer options. EV share ~16% in 2024 raises spec churn, increasing demand for co-development to lock designs.
| Metric | 2024 value |
|---|---|
| Top 7 OEM share | ≈60% |
| Global LV output | ~78M units |
| EV share | ~16% |
| Dual-sourcing (key parts) | >50% |
| COPQ | up to 15% revenue |
| Platform loss impact | 15–30% |
| Tooling investment | $1–10M |
What You See Is What You Get
OPmobility Porter's Five Forces Analysis
This preview is the exact OPmobility Porter's Five Forces analysis you will receive upon purchase—fully formatted, complete, and ready to use. It includes supplier, buyer, rivalry, entrant, and substitute assessments with supporting evidence. No placeholders or samples; instant download upon payment.











