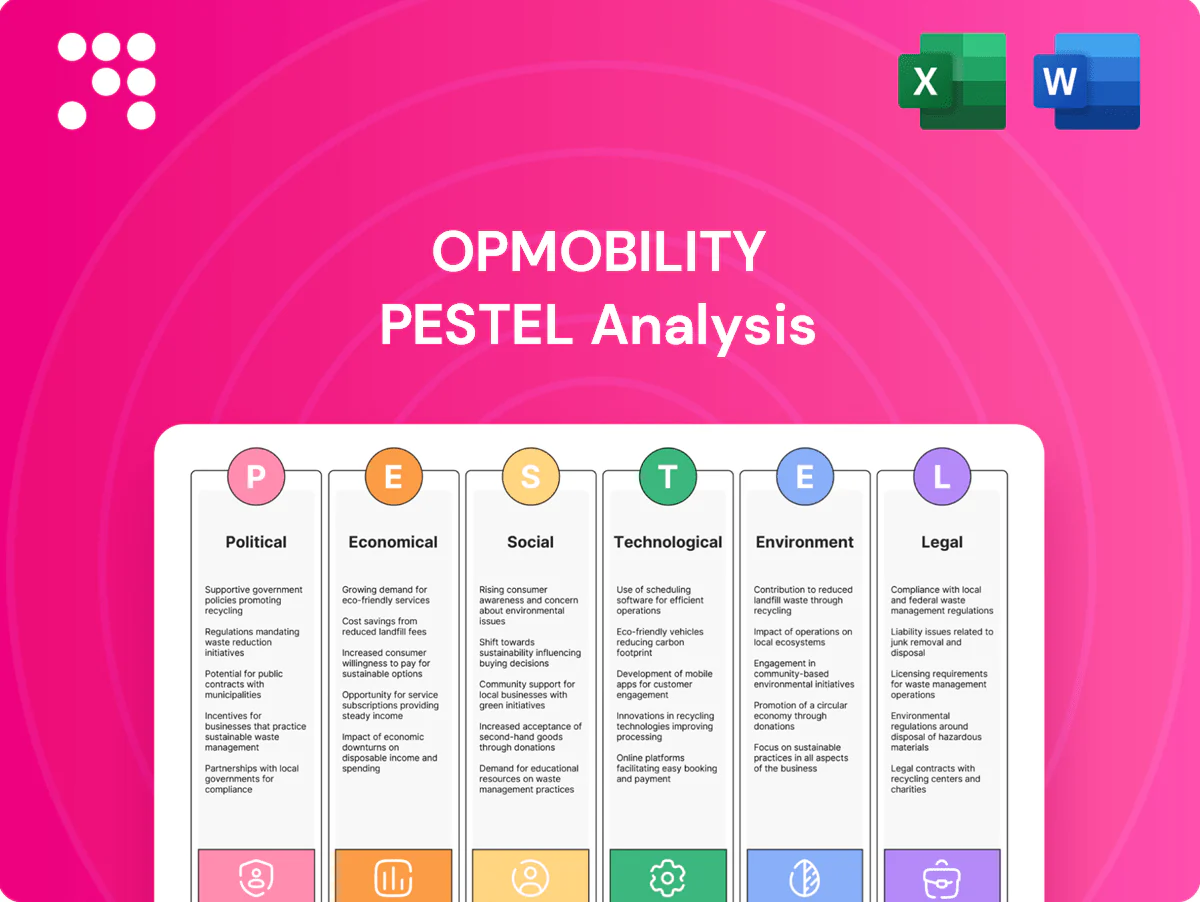
OPmobility PESTLE Analysis

Plan Smarter. Present Sharper. Compete Stronger.
Unlock strategic clarity with our PESTLE Analysis of OPmobility—concise, evidence-based insights into political, economic, social, technological, legal, and environmental drivers shaping the company’s outlook. Ideal for investors, consultants, and planners, this ready-to-use report highlights risks and growth levers you can act on immediately. Purchase the full analysis to access the complete, editable breakdown and make informed decisions faster.
Political factors

EV and hydrogen policy incentives
Government subsidies and mandates for EVs and hydrogen mobility—driven by the EU Green Deal/Fit for 55, the U.S. Inflation Reduction Act (about 369 billion USD for clean energy) and China NEV policies—directly shape OEM roadmaps and OPmobility’s product mix. These policies have helped push NEV adoption into multi-million unit markets (China 2023 ~7.8M NEVs), accelerating demand for clean energy systems and lightweight modules. Rapid changes to incentive eligibility can quickly reallocate volumes across battery, e-motor and hydrogen technologies. Active policy monitoring allows OPmobility to reassign capacity and R&D spend within quarters to capture shifting demand.
Trade tariffs and localization pressures
Rising trade tariffs—many US-China tariffs remain at up to 25%—and local-content rules drive suppliers to regionalize manufacturing. OPmobility must balance cost, resilience and proximity to OEM plants across EU, USMCA and China while leveraging IRA incentives (roughly $369 billion program) and the up-to-$7,500 EV tax credit. Geopolitical frictions can disrupt cross-border flows of resins, electronics and tanks, so diversified footprints and dual-sourcing reduce exposure.

Public procurement and safety priorities
Governments push road safety and decarbonization in public fleets—public procurement accounts for about 14% of EU GDP and the EU mandates 100% zero‑emission new cars by 2035—shaping component standards. ADAS‑ready front‑end modules and impact‑resistant exteriors gain procurement priority as Euro NCAP and similar bodies weight pedestrian protection and ADAS in ratings. Compliance with evolving crash and pedestrian norms is a competitive lever; early alignment secures approvals and preferred supplier status.

Industrial policy and subsidies for manufacturing
Sanctions and export controls
Controls on advanced electronics, materials and dual-use tech tightened since 2022, with major US/EU/UK measures targeting advanced semiconductors and tooling and 40+ allied jurisdictions coordinating sanctions, constraining OPmobility module designs and supplier choices. Sanctions have closed or distorted select markets and complicated JV structures, so OPmobility needs robust compliance programs to screen partners and parts flows. Scenario planning and contract clauses reduce revenue shocks from sudden restrictions.
- Compliance: screen partners, parts, and end‑use
- Design: specify alternative components and suppliers
- Legal: tighten JV exit and force‑majeure clauses
- Risk: run scenario models for sudden market closures
IRA, EU Fit for 55, China NEV growth drive regionalized EV/hydrogen R&D and sourcing shifts
Government EV/hydrogen policies (EU Fit for 55, IRA $369B, China NEV ~7.8M in 2023) steer OPmobility product mix and R&D timing.
Trade tariffs up to 25% and local‑content rules force regionalization; IRA and $7,500 EV tax credit reshape sourcing.
Safety/decarbonization mandates (EU 100% ZEV by 2035, public procurement ~14% EU GDP) prioritize ADAS‑ready, compliant modules.
| Tag | Metric | Impact |
|---|---|---|
| IRA | $369B | Capex incentives |
| NEVs | 7.8M (CN 2023) | Demand |
| Tariffs | up to 25% | Regionalize |
What is included in the product
 Detailed Word Document
Explores how macro-environmental factors uniquely affect OPmobility across Political, Economic, Social, Technological, Environmental, and Legal dimensions, with data-backed trends and region-specific regulatory context; designed for executives and investors, it delivers actionable, forward-looking insights and cleanly formatted findings ready for business plans, pitch decks, or scenario planning.

 Customizable Excel Spreadsheet
OPmobility PESTLE Analysis delivers a clean, visually segmented summary of external factors that teams can edit, share, and drop into presentations to streamline risk discussions and strategic planning.
Economic factors

Automotive demand cycles
Vehicle production swings, which have caused plant utilization to move by roughly 10–15 percentage points in recent cycles, directly affect OPmobility order visibility and backlog management. Mix shifts toward SUVs (about 50% of US sales in 2024) and rising EV penetration (around 18% global retail share in 2024) increase exterior and energy-system content per vehicle. OPmobility must flex capacity and retool to protect margins, while long-term OEM agreements smooth throughput and reduce revenue volatility.
Raw material and energy cost volatility
Prices for polymers (~$1,200–1,400/t for PP in 2024), aluminum (LME ~$2,200–2,400/t) and carbon fiber (industrial grades ~$6–20/kg) plus electricity (industrial EU €0.12–0.25/kWh vs US $0.06–0.09/kWh) directly drive COGS; index‑linked contracts and hedges blunt spikes but can lag spot moves, so process efficiency and material substitution are key to protecting margins and regional energy differentials shape plant competitiveness.

FX and interest rate environment
Multi-currency revenues and costs leave OPmobility exposed to FX swings as the US dollar broad index (DXY) averaged about 103–106 in 2024–H1 2025, repricing imports and transfer pricing versus EUR/JPY moves. Fed policy rates hovered near 5.25–5.50% and US 10-year yields around 4.0% in 2024–2025, raising capex and working-capital financing costs. Natural hedges and selective local-currency debt reduce earnings volatility.

OEM pricing pressure
OEMs demand annual cost downs (typically 2–5%) and >95% OTIF delivery; missed targets risk program removal. Differentiated tech and validated quality secure premium pricing or design-in wins, often adding ~10% price advantage. Value engineering and automation sustain unit economics, while platform-lifecycle collaboration locks multi-year volumes (platform runs 5–10 years).
- Cost-downs: 2–5%
- Delivery: >95% OTIF
- Premium: ~10% for validated tech
- Platform runs: 5–10 years
Supply chain resilience economics
Inventory buffers and dual tooling raise carrying costs—working capital up 10–30% per McKinsey 2023—while cutting disruption risk. Nearshoring lowers ocean/logistics exposure but can raise labor costs 10–25% in Mexico/Central Europe (2024 studies). Lane-and-platform TCO models typically identify 5–15% cost savings by route. Data-sharing with OEMs can improve forecast accuracy 10–25% and shorten lead times.
- Buffers: +10–30% working capital
- Nearshoring: +10–25% labor cost
- TCO: 5–15% cost optimization
- Data-sharing: +10–25% forecast accuracy
IRA, EU Fit for 55, China NEV growth drive regionalized EV/hydrogen R&D and sourcing shifts
Production swings (±10–15 ppt) and mix shifts (US SUVs ~50% 2024; EVs ~18% global 2024) raise content and retooling needs, pressuring margins. Key input costs — PP $1,200–1,400/t, Al $2,200–2,400/t, CF $6–20/kg — plus electricity (EU €0.12–0.25/kWh; US $0.06–0.09/kWh) drive COGS. FX (DXY 103–106) and rates (Fed 5.25–5.5%) raise financing costs; working capital +10–30% with nearshoring +10–25% labor.
| Metric | 2024–H1 2025 |
|---|---|
| Plant utilization swing | ±10–15 ppt |
| US SUV share | ~50% |
| EV global retail | ~18% |
| PP | $1,200–1,400/t |
| Al (LME) | $2,200–2,400/t |
| Carbon fiber | $6–20/kg |
| Electricity | EU €0.12–0.25 / US $0.06–0.09 |
| DXY | 103–106 |
| Fed rate | 5.25–5.50% |
| Working capital | +10–30% |
| Nearshoring labor | +10–25% |
Preview Before You Purchase
OPmobility PESTLE Analysis
The preview shown here is the exact OPmobility PESTLE Analysis you’ll receive after purchase—fully formatted, professionally structured, and ready to use. It’s a real screenshot of the final document with no placeholders or teasers, so there are no surprises at checkout. The layout, content, and analysis visible here are exactly what you’ll download immediately after payment.

Plan Smarter. Present Sharper. Compete Stronger.
Unlock strategic clarity with our PESTLE Analysis of OPmobility—concise, evidence-based insights into political, economic, social, technological, legal, and environmental drivers shaping the company’s outlook. Ideal for investors, consultants, and planners, this ready-to-use report highlights risks and growth levers you can act on immediately. Purchase the full analysis to access the complete, editable breakdown and make informed decisions faster.
Political factors
EV and hydrogen policy incentives
Government subsidies and mandates for EVs and hydrogen mobility—driven by the EU Green Deal/Fit for 55, the U.S. Inflation Reduction Act (about 369 billion USD for clean energy) and China NEV policies—directly shape OEM roadmaps and OPmobility’s product mix. These policies have helped push NEV adoption into multi-million unit markets (China 2023 ~7.8M NEVs), accelerating demand for clean energy systems and lightweight modules. Rapid changes to incentive eligibility can quickly reallocate volumes across battery, e-motor and hydrogen technologies. Active policy monitoring allows OPmobility to reassign capacity and R&D spend within quarters to capture shifting demand.
Trade tariffs and localization pressures
Rising trade tariffs—many US-China tariffs remain at up to 25%—and local-content rules drive suppliers to regionalize manufacturing. OPmobility must balance cost, resilience and proximity to OEM plants across EU, USMCA and China while leveraging IRA incentives (roughly $369 billion program) and the up-to-$7,500 EV tax credit. Geopolitical frictions can disrupt cross-border flows of resins, electronics and tanks, so diversified footprints and dual-sourcing reduce exposure.
Public procurement and safety priorities
Governments push road safety and decarbonization in public fleets—public procurement accounts for about 14% of EU GDP and the EU mandates 100% zero‑emission new cars by 2035—shaping component standards. ADAS‑ready front‑end modules and impact‑resistant exteriors gain procurement priority as Euro NCAP and similar bodies weight pedestrian protection and ADAS in ratings. Compliance with evolving crash and pedestrian norms is a competitive lever; early alignment secures approvals and preferred supplier status.
Industrial policy and subsidies for manufacturing
Sanctions and export controls
Controls on advanced electronics, materials and dual-use tech tightened since 2022, with major US/EU/UK measures targeting advanced semiconductors and tooling and 40+ allied jurisdictions coordinating sanctions, constraining OPmobility module designs and supplier choices. Sanctions have closed or distorted select markets and complicated JV structures, so OPmobility needs robust compliance programs to screen partners and parts flows. Scenario planning and contract clauses reduce revenue shocks from sudden restrictions.
- Compliance: screen partners, parts, and end‑use
- Design: specify alternative components and suppliers
- Legal: tighten JV exit and force‑majeure clauses
- Risk: run scenario models for sudden market closures
IRA, EU Fit for 55, China NEV growth drive regionalized EV/hydrogen R&D and sourcing shifts
Government EV/hydrogen policies (EU Fit for 55, IRA $369B, China NEV ~7.8M in 2023) steer OPmobility product mix and R&D timing.
Trade tariffs up to 25% and local‑content rules force regionalization; IRA and $7,500 EV tax credit reshape sourcing.
Safety/decarbonization mandates (EU 100% ZEV by 2035, public procurement ~14% EU GDP) prioritize ADAS‑ready, compliant modules.
| Tag | Metric | Impact |
|---|---|---|
| IRA | $369B | Capex incentives |
| NEVs | 7.8M (CN 2023) | Demand |
| Tariffs | up to 25% | Regionalize |
What is included in the product
Detailed Word Document
Explores how macro-environmental factors uniquely affect OPmobility across Political, Economic, Social, Technological, Environmental, and Legal dimensions, with data-backed trends and region-specific regulatory context; designed for executives and investors, it delivers actionable, forward-looking insights and cleanly formatted findings ready for business plans, pitch decks, or scenario planning.
Customizable Excel Spreadsheet
OPmobility PESTLE Analysis delivers a clean, visually segmented summary of external factors that teams can edit, share, and drop into presentations to streamline risk discussions and strategic planning.
Economic factors
Automotive demand cycles
Vehicle production swings, which have caused plant utilization to move by roughly 10–15 percentage points in recent cycles, directly affect OPmobility order visibility and backlog management. Mix shifts toward SUVs (about 50% of US sales in 2024) and rising EV penetration (around 18% global retail share in 2024) increase exterior and energy-system content per vehicle. OPmobility must flex capacity and retool to protect margins, while long-term OEM agreements smooth throughput and reduce revenue volatility.
Raw material and energy cost volatility
Prices for polymers (~$1,200–1,400/t for PP in 2024), aluminum (LME ~$2,200–2,400/t) and carbon fiber (industrial grades ~$6–20/kg) plus electricity (industrial EU €0.12–0.25/kWh vs US $0.06–0.09/kWh) directly drive COGS; index‑linked contracts and hedges blunt spikes but can lag spot moves, so process efficiency and material substitution are key to protecting margins and regional energy differentials shape plant competitiveness.
FX and interest rate environment
Multi-currency revenues and costs leave OPmobility exposed to FX swings as the US dollar broad index (DXY) averaged about 103–106 in 2024–H1 2025, repricing imports and transfer pricing versus EUR/JPY moves. Fed policy rates hovered near 5.25–5.50% and US 10-year yields around 4.0% in 2024–2025, raising capex and working-capital financing costs. Natural hedges and selective local-currency debt reduce earnings volatility.
OEM pricing pressure
OEMs demand annual cost downs (typically 2–5%) and >95% OTIF delivery; missed targets risk program removal. Differentiated tech and validated quality secure premium pricing or design-in wins, often adding ~10% price advantage. Value engineering and automation sustain unit economics, while platform-lifecycle collaboration locks multi-year volumes (platform runs 5–10 years).
- Cost-downs: 2–5%
- Delivery: >95% OTIF
- Premium: ~10% for validated tech
- Platform runs: 5–10 years
Supply chain resilience economics
Inventory buffers and dual tooling raise carrying costs—working capital up 10–30% per McKinsey 2023—while cutting disruption risk. Nearshoring lowers ocean/logistics exposure but can raise labor costs 10–25% in Mexico/Central Europe (2024 studies). Lane-and-platform TCO models typically identify 5–15% cost savings by route. Data-sharing with OEMs can improve forecast accuracy 10–25% and shorten lead times.
- Buffers: +10–30% working capital
- Nearshoring: +10–25% labor cost
- TCO: 5–15% cost optimization
- Data-sharing: +10–25% forecast accuracy
IRA, EU Fit for 55, China NEV growth drive regionalized EV/hydrogen R&D and sourcing shifts
Production swings (±10–15 ppt) and mix shifts (US SUVs ~50% 2024; EVs ~18% global 2024) raise content and retooling needs, pressuring margins. Key input costs — PP $1,200–1,400/t, Al $2,200–2,400/t, CF $6–20/kg — plus electricity (EU €0.12–0.25/kWh; US $0.06–0.09/kWh) drive COGS. FX (DXY 103–106) and rates (Fed 5.25–5.5%) raise financing costs; working capital +10–30% with nearshoring +10–25% labor.
| Metric | 2024–H1 2025 |
|---|---|
| Plant utilization swing | ±10–15 ppt |
| US SUV share | ~50% |
| EV global retail | ~18% |
| PP | $1,200–1,400/t |
| Al (LME) | $2,200–2,400/t |
| Carbon fiber | $6–20/kg |
| Electricity | EU €0.12–0.25 / US $0.06–0.09 |
| DXY | 103–106 |
| Fed rate | 5.25–5.50% |
| Working capital | +10–30% |
| Nearshoring labor | +10–25% |
Preview Before You Purchase
OPmobility PESTLE Analysis
The preview shown here is the exact OPmobility PESTLE Analysis you’ll receive after purchase—fully formatted, professionally structured, and ready to use. It’s a real screenshot of the final document with no placeholders or teasers, so there are no surprises at checkout. The layout, content, and analysis visible here are exactly what you’ll download immediately after payment.
Original: $10.00
-65%$10.00
$3.50Description
Plan Smarter. Present Sharper. Compete Stronger.
Unlock strategic clarity with our PESTLE Analysis of OPmobility—concise, evidence-based insights into political, economic, social, technological, legal, and environmental drivers shaping the company’s outlook. Ideal for investors, consultants, and planners, this ready-to-use report highlights risks and growth levers you can act on immediately. Purchase the full analysis to access the complete, editable breakdown and make informed decisions faster.
Political factors
EV and hydrogen policy incentives
Government subsidies and mandates for EVs and hydrogen mobility—driven by the EU Green Deal/Fit for 55, the U.S. Inflation Reduction Act (about 369 billion USD for clean energy) and China NEV policies—directly shape OEM roadmaps and OPmobility’s product mix. These policies have helped push NEV adoption into multi-million unit markets (China 2023 ~7.8M NEVs), accelerating demand for clean energy systems and lightweight modules. Rapid changes to incentive eligibility can quickly reallocate volumes across battery, e-motor and hydrogen technologies. Active policy monitoring allows OPmobility to reassign capacity and R&D spend within quarters to capture shifting demand.
Trade tariffs and localization pressures
Rising trade tariffs—many US-China tariffs remain at up to 25%—and local-content rules drive suppliers to regionalize manufacturing. OPmobility must balance cost, resilience and proximity to OEM plants across EU, USMCA and China while leveraging IRA incentives (roughly $369 billion program) and the up-to-$7,500 EV tax credit. Geopolitical frictions can disrupt cross-border flows of resins, electronics and tanks, so diversified footprints and dual-sourcing reduce exposure.
Public procurement and safety priorities
Governments push road safety and decarbonization in public fleets—public procurement accounts for about 14% of EU GDP and the EU mandates 100% zero‑emission new cars by 2035—shaping component standards. ADAS‑ready front‑end modules and impact‑resistant exteriors gain procurement priority as Euro NCAP and similar bodies weight pedestrian protection and ADAS in ratings. Compliance with evolving crash and pedestrian norms is a competitive lever; early alignment secures approvals and preferred supplier status.
Industrial policy and subsidies for manufacturing
Sanctions and export controls
Controls on advanced electronics, materials and dual-use tech tightened since 2022, with major US/EU/UK measures targeting advanced semiconductors and tooling and 40+ allied jurisdictions coordinating sanctions, constraining OPmobility module designs and supplier choices. Sanctions have closed or distorted select markets and complicated JV structures, so OPmobility needs robust compliance programs to screen partners and parts flows. Scenario planning and contract clauses reduce revenue shocks from sudden restrictions.
- Compliance: screen partners, parts, and end‑use
- Design: specify alternative components and suppliers
- Legal: tighten JV exit and force‑majeure clauses
- Risk: run scenario models for sudden market closures
IRA, EU Fit for 55, China NEV growth drive regionalized EV/hydrogen R&D and sourcing shifts
Government EV/hydrogen policies (EU Fit for 55, IRA $369B, China NEV ~7.8M in 2023) steer OPmobility product mix and R&D timing.
Trade tariffs up to 25% and local‑content rules force regionalization; IRA and $7,500 EV tax credit reshape sourcing.
Safety/decarbonization mandates (EU 100% ZEV by 2035, public procurement ~14% EU GDP) prioritize ADAS‑ready, compliant modules.
| Tag | Metric | Impact |
|---|---|---|
| IRA | $369B | Capex incentives |
| NEVs | 7.8M (CN 2023) | Demand |
| Tariffs | up to 25% | Regionalize |
What is included in the product
Detailed Word Document
Explores how macro-environmental factors uniquely affect OPmobility across Political, Economic, Social, Technological, Environmental, and Legal dimensions, with data-backed trends and region-specific regulatory context; designed for executives and investors, it delivers actionable, forward-looking insights and cleanly formatted findings ready for business plans, pitch decks, or scenario planning.
Customizable Excel Spreadsheet
OPmobility PESTLE Analysis delivers a clean, visually segmented summary of external factors that teams can edit, share, and drop into presentations to streamline risk discussions and strategic planning.
Economic factors
Automotive demand cycles
Vehicle production swings, which have caused plant utilization to move by roughly 10–15 percentage points in recent cycles, directly affect OPmobility order visibility and backlog management. Mix shifts toward SUVs (about 50% of US sales in 2024) and rising EV penetration (around 18% global retail share in 2024) increase exterior and energy-system content per vehicle. OPmobility must flex capacity and retool to protect margins, while long-term OEM agreements smooth throughput and reduce revenue volatility.
Raw material and energy cost volatility
Prices for polymers (~$1,200–1,400/t for PP in 2024), aluminum (LME ~$2,200–2,400/t) and carbon fiber (industrial grades ~$6–20/kg) plus electricity (industrial EU €0.12–0.25/kWh vs US $0.06–0.09/kWh) directly drive COGS; index‑linked contracts and hedges blunt spikes but can lag spot moves, so process efficiency and material substitution are key to protecting margins and regional energy differentials shape plant competitiveness.
FX and interest rate environment
Multi-currency revenues and costs leave OPmobility exposed to FX swings as the US dollar broad index (DXY) averaged about 103–106 in 2024–H1 2025, repricing imports and transfer pricing versus EUR/JPY moves. Fed policy rates hovered near 5.25–5.50% and US 10-year yields around 4.0% in 2024–2025, raising capex and working-capital financing costs. Natural hedges and selective local-currency debt reduce earnings volatility.
OEM pricing pressure
OEMs demand annual cost downs (typically 2–5%) and >95% OTIF delivery; missed targets risk program removal. Differentiated tech and validated quality secure premium pricing or design-in wins, often adding ~10% price advantage. Value engineering and automation sustain unit economics, while platform-lifecycle collaboration locks multi-year volumes (platform runs 5–10 years).
- Cost-downs: 2–5%
- Delivery: >95% OTIF
- Premium: ~10% for validated tech
- Platform runs: 5–10 years
Supply chain resilience economics
Inventory buffers and dual tooling raise carrying costs—working capital up 10–30% per McKinsey 2023—while cutting disruption risk. Nearshoring lowers ocean/logistics exposure but can raise labor costs 10–25% in Mexico/Central Europe (2024 studies). Lane-and-platform TCO models typically identify 5–15% cost savings by route. Data-sharing with OEMs can improve forecast accuracy 10–25% and shorten lead times.
- Buffers: +10–30% working capital
- Nearshoring: +10–25% labor cost
- TCO: 5–15% cost optimization
- Data-sharing: +10–25% forecast accuracy
IRA, EU Fit for 55, China NEV growth drive regionalized EV/hydrogen R&D and sourcing shifts
Production swings (±10–15 ppt) and mix shifts (US SUVs ~50% 2024; EVs ~18% global 2024) raise content and retooling needs, pressuring margins. Key input costs — PP $1,200–1,400/t, Al $2,200–2,400/t, CF $6–20/kg — plus electricity (EU €0.12–0.25/kWh; US $0.06–0.09/kWh) drive COGS. FX (DXY 103–106) and rates (Fed 5.25–5.5%) raise financing costs; working capital +10–30% with nearshoring +10–25% labor.
| Metric | 2024–H1 2025 |
|---|---|
| Plant utilization swing | ±10–15 ppt |
| US SUV share | ~50% |
| EV global retail | ~18% |
| PP | $1,200–1,400/t |
| Al (LME) | $2,200–2,400/t |
| Carbon fiber | $6–20/kg |
| Electricity | EU €0.12–0.25 / US $0.06–0.09 |
| DXY | 103–106 |
| Fed rate | 5.25–5.50% |
| Working capital | +10–30% |
| Nearshoring labor | +10–25% |
Preview Before You Purchase
OPmobility PESTLE Analysis
The preview shown here is the exact OPmobility PESTLE Analysis you’ll receive after purchase—fully formatted, professionally structured, and ready to use. It’s a real screenshot of the final document with no placeholders or teasers, so there are no surprises at checkout. The layout, content, and analysis visible here are exactly what you’ll download immediately after payment.











