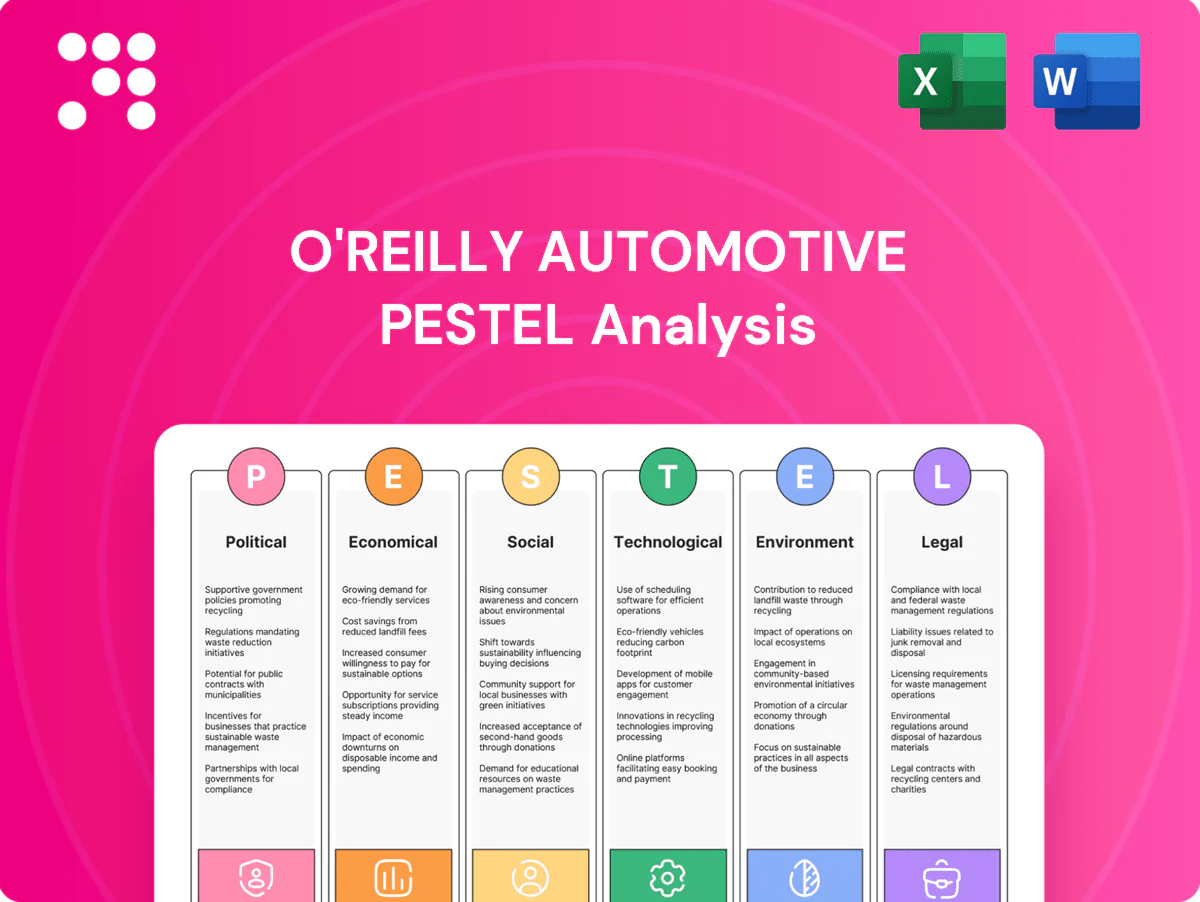
O'Reilly Automotive PESTLE Analysis

Plan Smarter. Present Sharper. Compete Stronger.
Our PESTLE analysis for O'Reilly Automotive reveals how political regulations, economic cycles, shifting consumer behaviors, technological disruption in auto parts retailing, and environmental and legal pressures converge on the company’s strategy and margins. Gain clear, actionable context to forecast risks and spot growth levers. Purchase the full, editable report to access the complete breakdown and strategic recommendations instantly.
Political factors

Trade policy and tariffs on auto parts
Many aftermarket parts are sourced globally, making OReilly sensitive to tariffs and import duties on imported components. U.S. tariffs on Chinese goods implemented since 2018 reach up to 25%, and shifts in U.S.–China or Mexico trade relations can lift input costs and compress margins. The company may adjust pricing, diversify suppliers or nearshore sourcing under USMCA rules to mitigate volatility. Proactive inventory planning and buffer stock help absorb sudden policy shifts.
Infrastructure and transportation funding
Federal infrastructure funding from the Bipartisan Infrastructure Law (about 1.2 trillion total, including roughly 110 billion for roads/bridges) and ~67 billion/year in highway formula grants supports higher VMT (US VMT ~3.26 trillion in 2023), boosting demand for parts and OReilly’s FY2024 sales (~17.8 billion). Improved roads also cut logistics costs, while project delays can locally suppress parts demand.

State-level incentives and taxes
State-by-state variations in sales taxes and permitting materially affect O’Reilly’s expansion economics, with the average combined U.S. sales tax ~7.1% (Tax Foundation, 2024). Favorable state credits and abatements for distribution centers—often worth millions over 10–20 years—can materially lower operating costs. Higher local sales taxes and strict store-permit rules can slow DIY parts demand and delay openings. O’Reilly, with ≈6,500 stores (2025), optimizes footprint and state pricing accordingly.

Fleet electrification policies
Public-sector mandates like California’s Advanced Clean Fleets (adopted 2023) and the EU ban on new ICE cars from 2035 shift parts-mix demand away from oil-dependent components toward EV-specific items; EVs need fewer brake/oil parts but more thermal-management, high-voltage connectors and specialty tools. Policy pace drives regional adoption curves, so OReilly can prioritize assortments where mandates and fleet conversions are fastest.
- Mandates: CA ACF 2023, EU ICE sales ban 2035
- Parts shift: fewer oil/brake SKUs, more thermal/EV-tool SKUs
- Strategy: assort where mandates concentrate
Labor and immigration policy
O'Reilly's store and distribution roles rely on stable labor; the company posted $16.17 billion in FY2024 revenue and ~88,000 employees, so tighter immigration or labor rules that lift wages can increase turnover and operating costs. Under constraints, expanded training pipelines and retention programs are essential. Policy clarity enables multi-year staffing plans.
- Labor reliance: ~88,000 employees (2024)
- Revenue: $16.17B FY2024
- Risks: higher wages, turnover costs
- Mitigants: training, retention, policy clarity
Tariffs, infrastructure spending and rising VMT reshape auto-parts supply economics
OReilly is exposed to tariffs (US-China up to 25%) and trade shifts that raise input costs and spur supplier diversification. Federal infrastructure (Bipartisan Infrastructure Law ~1.2T; ~110B roads) and ~3.26T VMT (2023) support parts demand. State tax/permit variation affects store economics; OReilly ~6,500 stores (2025), $16.17B revenue, ~88,000 employees (FY2024).
| Factor | Key metric |
|---|---|
| Tariffs | Up to 25% |
| Infrastructure | $1.2T total; $110B roads |
| VMT | 3.26T (2023) |
| Company scale | 6,500 stores; $16.17B; 88,000 emp |
What is included in the product
 Detailed Word Document
Explores how external macro-environmental factors uniquely affect O'Reilly Automotive across Political, Economic, Social, Technological, Environmental and Legal dimensions, with data-backed trends and forward-looking insights to inform strategy, risk management and investor communications. Designed for executives, consultants and investors, the analysis translates market and regulatory dynamics into actionable opportunities and threats.

 Customizable Excel Spreadsheet
A clean, summarized O'Reilly Automotive PESTLE that’s visually segmented by category for quick interpretation and ready-to-drop into PowerPoints or planning sessions, helping teams align fast on external risks and market positioning.
Economic factors

Miles driven and vehicle parc age
Higher miles driven—about 13,700 miles per year per driver—raise parts wear and demand, while the U.S. light-vehicle parc, roughly 284 million vehicles with an average age near 12.5 years (2024), sustains replacement cycles for brakes, batteries and alternators; OReilly’s core categories benefit as older vehicles remain in service. Economic slowdowns may trim discretionary DIY sales but routine maintenance stays resilient.
Consumer discretionary pressure
Rising inflation (~3.4% in 2024) and elevated Fed policy rates (~5.25% in 2024–25) shift consumers toward DIY to avoid higher DIFM labor costs, supporting aftermarket demand as average U.S. vehicle age reached ~12.6 years in 2024. Budget pressure can still push shoppers to value brands, but OReilly’s tiered assortments and FY2024 sales of about $15.2B let it capture both value and premium segments.

Professional shop throughput
Service bay utilization drives DIFM orders and delivery frequency, with busy shops increasing parts turnover and O'Reilly supporting that demand through its national logistics network; O'Reilly reported net sales of about 15.6 billion dollars in fiscal 2024. Tight labor at garages can cap throughput even when demand is healthy, limiting how often parts are ordered and installed. O'Reilly’s rapid delivery and broad inventory reduce bay downtime, and counter-cyclical maintenance helps smooth revenue versus OEM sales swings.

Supply chain costs and freight
Ocean rates, fuel and domestic trucking costs directly pressure OReillys gross margin; in fiscal 2024 OReilly reported about $14.0 billion in net sales with a gross margin near 51.8%, making freight a material cost lever.
Strategic inventory positioning and regional distribution centers shorten freight miles and lower transport spend while preserving fill rates across the store base.
Vendor negotiations and expanded private-label sourcing reduce input inflation exposure; OReilly balances service levels with working-capital discipline to maintain inventory turns and cash conversion efficiency.
- FY2024 net sales: ~14.0 billion; gross margin: ~51.8%
- Regional DCs reduce long-haul freight and transit times
- Private-label and vendor terms mitigate supplier cost pass-through
- Focus on service vs working capital preserves in-stock rates and turnover
Used car market dynamics
Elevated used-car prices and a record average vehicle age near 12.8 years (IHS Markit, 2024) keep older cars on road longer, sustaining wear-part demand for O'Reilly; dealer and independent reconditioning boosts DIFM volumes, while a gradual price normalization could shift retail vs DIFM mix but preserve baseline maintenance needs.
- Avg vehicle age ~12.8 yrs (IHS Markit 2024)
- Used values ~+20% vs 2019 (NADA/Cox 2024)
- Reconditioning ↑ DIFM volumes
- Normalization may shift mix, not baseline demand
Tariffs, infrastructure spending and rising VMT reshape auto-parts supply economics
Stronger miles driven and a 12.8-year avg vehicle age (IHS Markit 2024) sustain replacement part demand; FY2024 net sales ~$15.6B with gross margin ~51.8% keep scale advantages. Elevated 2024 inflation ~3.4% and Fed rate ~5.25% push DIY demand, while freight and labor costs pressure margins.
| Metric | 2024 |
|---|---|
| Net sales | $15.6B |
| Gross margin | 51.8% |
| Avg vehicle age | 12.8 yrs |
| Inflation | 3.4% |
| Fed rate | ~5.25% |
Full Version Awaits
O'Reilly Automotive PESTLE Analysis
This O'Reilly Automotive PESTLE analysis provides a concise evaluation of political, economic, social, technological, legal, and environmental factors affecting the company. The preview shown here is the exact document you’ll receive after purchase—fully formatted and ready to use. No placeholders or teasers; the layout, content, and structure visible are exactly what you'll download upon payment.

Plan Smarter. Present Sharper. Compete Stronger.
Our PESTLE analysis for O'Reilly Automotive reveals how political regulations, economic cycles, shifting consumer behaviors, technological disruption in auto parts retailing, and environmental and legal pressures converge on the company’s strategy and margins. Gain clear, actionable context to forecast risks and spot growth levers. Purchase the full, editable report to access the complete breakdown and strategic recommendations instantly.
Political factors
Trade policy and tariffs on auto parts
Many aftermarket parts are sourced globally, making OReilly sensitive to tariffs and import duties on imported components. U.S. tariffs on Chinese goods implemented since 2018 reach up to 25%, and shifts in U.S.–China or Mexico trade relations can lift input costs and compress margins. The company may adjust pricing, diversify suppliers or nearshore sourcing under USMCA rules to mitigate volatility. Proactive inventory planning and buffer stock help absorb sudden policy shifts.
Infrastructure and transportation funding
Federal infrastructure funding from the Bipartisan Infrastructure Law (about 1.2 trillion total, including roughly 110 billion for roads/bridges) and ~67 billion/year in highway formula grants supports higher VMT (US VMT ~3.26 trillion in 2023), boosting demand for parts and OReilly’s FY2024 sales (~17.8 billion). Improved roads also cut logistics costs, while project delays can locally suppress parts demand.
State-level incentives and taxes
State-by-state variations in sales taxes and permitting materially affect O’Reilly’s expansion economics, with the average combined U.S. sales tax ~7.1% (Tax Foundation, 2024). Favorable state credits and abatements for distribution centers—often worth millions over 10–20 years—can materially lower operating costs. Higher local sales taxes and strict store-permit rules can slow DIY parts demand and delay openings. O’Reilly, with ≈6,500 stores (2025), optimizes footprint and state pricing accordingly.
Fleet electrification policies
Public-sector mandates like California’s Advanced Clean Fleets (adopted 2023) and the EU ban on new ICE cars from 2035 shift parts-mix demand away from oil-dependent components toward EV-specific items; EVs need fewer brake/oil parts but more thermal-management, high-voltage connectors and specialty tools. Policy pace drives regional adoption curves, so OReilly can prioritize assortments where mandates and fleet conversions are fastest.
- Mandates: CA ACF 2023, EU ICE sales ban 2035
- Parts shift: fewer oil/brake SKUs, more thermal/EV-tool SKUs
- Strategy: assort where mandates concentrate
Labor and immigration policy
O'Reilly's store and distribution roles rely on stable labor; the company posted $16.17 billion in FY2024 revenue and ~88,000 employees, so tighter immigration or labor rules that lift wages can increase turnover and operating costs. Under constraints, expanded training pipelines and retention programs are essential. Policy clarity enables multi-year staffing plans.
- Labor reliance: ~88,000 employees (2024)
- Revenue: $16.17B FY2024
- Risks: higher wages, turnover costs
- Mitigants: training, retention, policy clarity
Tariffs, infrastructure spending and rising VMT reshape auto-parts supply economics
OReilly is exposed to tariffs (US-China up to 25%) and trade shifts that raise input costs and spur supplier diversification. Federal infrastructure (Bipartisan Infrastructure Law ~1.2T; ~110B roads) and ~3.26T VMT (2023) support parts demand. State tax/permit variation affects store economics; OReilly ~6,500 stores (2025), $16.17B revenue, ~88,000 employees (FY2024).
| Factor | Key metric |
|---|---|
| Tariffs | Up to 25% |
| Infrastructure | $1.2T total; $110B roads |
| VMT | 3.26T (2023) |
| Company scale | 6,500 stores; $16.17B; 88,000 emp |
What is included in the product
Detailed Word Document
Explores how external macro-environmental factors uniquely affect O'Reilly Automotive across Political, Economic, Social, Technological, Environmental and Legal dimensions, with data-backed trends and forward-looking insights to inform strategy, risk management and investor communications. Designed for executives, consultants and investors, the analysis translates market and regulatory dynamics into actionable opportunities and threats.
Customizable Excel Spreadsheet
A clean, summarized O'Reilly Automotive PESTLE that’s visually segmented by category for quick interpretation and ready-to-drop into PowerPoints or planning sessions, helping teams align fast on external risks and market positioning.
Economic factors
Miles driven and vehicle parc age
Higher miles driven—about 13,700 miles per year per driver—raise parts wear and demand, while the U.S. light-vehicle parc, roughly 284 million vehicles with an average age near 12.5 years (2024), sustains replacement cycles for brakes, batteries and alternators; OReilly’s core categories benefit as older vehicles remain in service. Economic slowdowns may trim discretionary DIY sales but routine maintenance stays resilient.
Consumer discretionary pressure
Rising inflation (~3.4% in 2024) and elevated Fed policy rates (~5.25% in 2024–25) shift consumers toward DIY to avoid higher DIFM labor costs, supporting aftermarket demand as average U.S. vehicle age reached ~12.6 years in 2024. Budget pressure can still push shoppers to value brands, but OReilly’s tiered assortments and FY2024 sales of about $15.2B let it capture both value and premium segments.
Professional shop throughput
Service bay utilization drives DIFM orders and delivery frequency, with busy shops increasing parts turnover and O'Reilly supporting that demand through its national logistics network; O'Reilly reported net sales of about 15.6 billion dollars in fiscal 2024. Tight labor at garages can cap throughput even when demand is healthy, limiting how often parts are ordered and installed. O'Reilly’s rapid delivery and broad inventory reduce bay downtime, and counter-cyclical maintenance helps smooth revenue versus OEM sales swings.
Supply chain costs and freight
Ocean rates, fuel and domestic trucking costs directly pressure OReillys gross margin; in fiscal 2024 OReilly reported about $14.0 billion in net sales with a gross margin near 51.8%, making freight a material cost lever.
Strategic inventory positioning and regional distribution centers shorten freight miles and lower transport spend while preserving fill rates across the store base.
Vendor negotiations and expanded private-label sourcing reduce input inflation exposure; OReilly balances service levels with working-capital discipline to maintain inventory turns and cash conversion efficiency.
- FY2024 net sales: ~14.0 billion; gross margin: ~51.8%
- Regional DCs reduce long-haul freight and transit times
- Private-label and vendor terms mitigate supplier cost pass-through
- Focus on service vs working capital preserves in-stock rates and turnover
Used car market dynamics
Elevated used-car prices and a record average vehicle age near 12.8 years (IHS Markit, 2024) keep older cars on road longer, sustaining wear-part demand for O'Reilly; dealer and independent reconditioning boosts DIFM volumes, while a gradual price normalization could shift retail vs DIFM mix but preserve baseline maintenance needs.
- Avg vehicle age ~12.8 yrs (IHS Markit 2024)
- Used values ~+20% vs 2019 (NADA/Cox 2024)
- Reconditioning ↑ DIFM volumes
- Normalization may shift mix, not baseline demand
Tariffs, infrastructure spending and rising VMT reshape auto-parts supply economics
Stronger miles driven and a 12.8-year avg vehicle age (IHS Markit 2024) sustain replacement part demand; FY2024 net sales ~$15.6B with gross margin ~51.8% keep scale advantages. Elevated 2024 inflation ~3.4% and Fed rate ~5.25% push DIY demand, while freight and labor costs pressure margins.
| Metric | 2024 |
|---|---|
| Net sales | $15.6B |
| Gross margin | 51.8% |
| Avg vehicle age | 12.8 yrs |
| Inflation | 3.4% |
| Fed rate | ~5.25% |
Full Version Awaits
O'Reilly Automotive PESTLE Analysis
This O'Reilly Automotive PESTLE analysis provides a concise evaluation of political, economic, social, technological, legal, and environmental factors affecting the company. The preview shown here is the exact document you’ll receive after purchase—fully formatted and ready to use. No placeholders or teasers; the layout, content, and structure visible are exactly what you'll download upon payment.
Original: $10.00
-65%$10.00
$3.50Description
Plan Smarter. Present Sharper. Compete Stronger.
Our PESTLE analysis for O'Reilly Automotive reveals how political regulations, economic cycles, shifting consumer behaviors, technological disruption in auto parts retailing, and environmental and legal pressures converge on the company’s strategy and margins. Gain clear, actionable context to forecast risks and spot growth levers. Purchase the full, editable report to access the complete breakdown and strategic recommendations instantly.
Political factors
Trade policy and tariffs on auto parts
Many aftermarket parts are sourced globally, making OReilly sensitive to tariffs and import duties on imported components. U.S. tariffs on Chinese goods implemented since 2018 reach up to 25%, and shifts in U.S.–China or Mexico trade relations can lift input costs and compress margins. The company may adjust pricing, diversify suppliers or nearshore sourcing under USMCA rules to mitigate volatility. Proactive inventory planning and buffer stock help absorb sudden policy shifts.
Infrastructure and transportation funding
Federal infrastructure funding from the Bipartisan Infrastructure Law (about 1.2 trillion total, including roughly 110 billion for roads/bridges) and ~67 billion/year in highway formula grants supports higher VMT (US VMT ~3.26 trillion in 2023), boosting demand for parts and OReilly’s FY2024 sales (~17.8 billion). Improved roads also cut logistics costs, while project delays can locally suppress parts demand.
State-level incentives and taxes
State-by-state variations in sales taxes and permitting materially affect O’Reilly’s expansion economics, with the average combined U.S. sales tax ~7.1% (Tax Foundation, 2024). Favorable state credits and abatements for distribution centers—often worth millions over 10–20 years—can materially lower operating costs. Higher local sales taxes and strict store-permit rules can slow DIY parts demand and delay openings. O’Reilly, with ≈6,500 stores (2025), optimizes footprint and state pricing accordingly.
Fleet electrification policies
Public-sector mandates like California’s Advanced Clean Fleets (adopted 2023) and the EU ban on new ICE cars from 2035 shift parts-mix demand away from oil-dependent components toward EV-specific items; EVs need fewer brake/oil parts but more thermal-management, high-voltage connectors and specialty tools. Policy pace drives regional adoption curves, so OReilly can prioritize assortments where mandates and fleet conversions are fastest.
- Mandates: CA ACF 2023, EU ICE sales ban 2035
- Parts shift: fewer oil/brake SKUs, more thermal/EV-tool SKUs
- Strategy: assort where mandates concentrate
Labor and immigration policy
O'Reilly's store and distribution roles rely on stable labor; the company posted $16.17 billion in FY2024 revenue and ~88,000 employees, so tighter immigration or labor rules that lift wages can increase turnover and operating costs. Under constraints, expanded training pipelines and retention programs are essential. Policy clarity enables multi-year staffing plans.
- Labor reliance: ~88,000 employees (2024)
- Revenue: $16.17B FY2024
- Risks: higher wages, turnover costs
- Mitigants: training, retention, policy clarity
Tariffs, infrastructure spending and rising VMT reshape auto-parts supply economics
OReilly is exposed to tariffs (US-China up to 25%) and trade shifts that raise input costs and spur supplier diversification. Federal infrastructure (Bipartisan Infrastructure Law ~1.2T; ~110B roads) and ~3.26T VMT (2023) support parts demand. State tax/permit variation affects store economics; OReilly ~6,500 stores (2025), $16.17B revenue, ~88,000 employees (FY2024).
| Factor | Key metric |
|---|---|
| Tariffs | Up to 25% |
| Infrastructure | $1.2T total; $110B roads |
| VMT | 3.26T (2023) |
| Company scale | 6,500 stores; $16.17B; 88,000 emp |
What is included in the product
Detailed Word Document
Explores how external macro-environmental factors uniquely affect O'Reilly Automotive across Political, Economic, Social, Technological, Environmental and Legal dimensions, with data-backed trends and forward-looking insights to inform strategy, risk management and investor communications. Designed for executives, consultants and investors, the analysis translates market and regulatory dynamics into actionable opportunities and threats.
Customizable Excel Spreadsheet
A clean, summarized O'Reilly Automotive PESTLE that’s visually segmented by category for quick interpretation and ready-to-drop into PowerPoints or planning sessions, helping teams align fast on external risks and market positioning.
Economic factors
Miles driven and vehicle parc age
Higher miles driven—about 13,700 miles per year per driver—raise parts wear and demand, while the U.S. light-vehicle parc, roughly 284 million vehicles with an average age near 12.5 years (2024), sustains replacement cycles for brakes, batteries and alternators; OReilly’s core categories benefit as older vehicles remain in service. Economic slowdowns may trim discretionary DIY sales but routine maintenance stays resilient.
Consumer discretionary pressure
Rising inflation (~3.4% in 2024) and elevated Fed policy rates (~5.25% in 2024–25) shift consumers toward DIY to avoid higher DIFM labor costs, supporting aftermarket demand as average U.S. vehicle age reached ~12.6 years in 2024. Budget pressure can still push shoppers to value brands, but OReilly’s tiered assortments and FY2024 sales of about $15.2B let it capture both value and premium segments.
Professional shop throughput
Service bay utilization drives DIFM orders and delivery frequency, with busy shops increasing parts turnover and O'Reilly supporting that demand through its national logistics network; O'Reilly reported net sales of about 15.6 billion dollars in fiscal 2024. Tight labor at garages can cap throughput even when demand is healthy, limiting how often parts are ordered and installed. O'Reilly’s rapid delivery and broad inventory reduce bay downtime, and counter-cyclical maintenance helps smooth revenue versus OEM sales swings.
Supply chain costs and freight
Ocean rates, fuel and domestic trucking costs directly pressure OReillys gross margin; in fiscal 2024 OReilly reported about $14.0 billion in net sales with a gross margin near 51.8%, making freight a material cost lever.
Strategic inventory positioning and regional distribution centers shorten freight miles and lower transport spend while preserving fill rates across the store base.
Vendor negotiations and expanded private-label sourcing reduce input inflation exposure; OReilly balances service levels with working-capital discipline to maintain inventory turns and cash conversion efficiency.
- FY2024 net sales: ~14.0 billion; gross margin: ~51.8%
- Regional DCs reduce long-haul freight and transit times
- Private-label and vendor terms mitigate supplier cost pass-through
- Focus on service vs working capital preserves in-stock rates and turnover
Used car market dynamics
Elevated used-car prices and a record average vehicle age near 12.8 years (IHS Markit, 2024) keep older cars on road longer, sustaining wear-part demand for O'Reilly; dealer and independent reconditioning boosts DIFM volumes, while a gradual price normalization could shift retail vs DIFM mix but preserve baseline maintenance needs.
- Avg vehicle age ~12.8 yrs (IHS Markit 2024)
- Used values ~+20% vs 2019 (NADA/Cox 2024)
- Reconditioning ↑ DIFM volumes
- Normalization may shift mix, not baseline demand
Tariffs, infrastructure spending and rising VMT reshape auto-parts supply economics
Stronger miles driven and a 12.8-year avg vehicle age (IHS Markit 2024) sustain replacement part demand; FY2024 net sales ~$15.6B with gross margin ~51.8% keep scale advantages. Elevated 2024 inflation ~3.4% and Fed rate ~5.25% push DIY demand, while freight and labor costs pressure margins.
| Metric | 2024 |
|---|---|
| Net sales | $15.6B |
| Gross margin | 51.8% |
| Avg vehicle age | 12.8 yrs |
| Inflation | 3.4% |
| Fed rate | ~5.25% |
Full Version Awaits
O'Reilly Automotive PESTLE Analysis
This O'Reilly Automotive PESTLE analysis provides a concise evaluation of political, economic, social, technological, legal, and environmental factors affecting the company. The preview shown here is the exact document you’ll receive after purchase—fully formatted and ready to use. No placeholders or teasers; the layout, content, and structure visible are exactly what you'll download upon payment.











