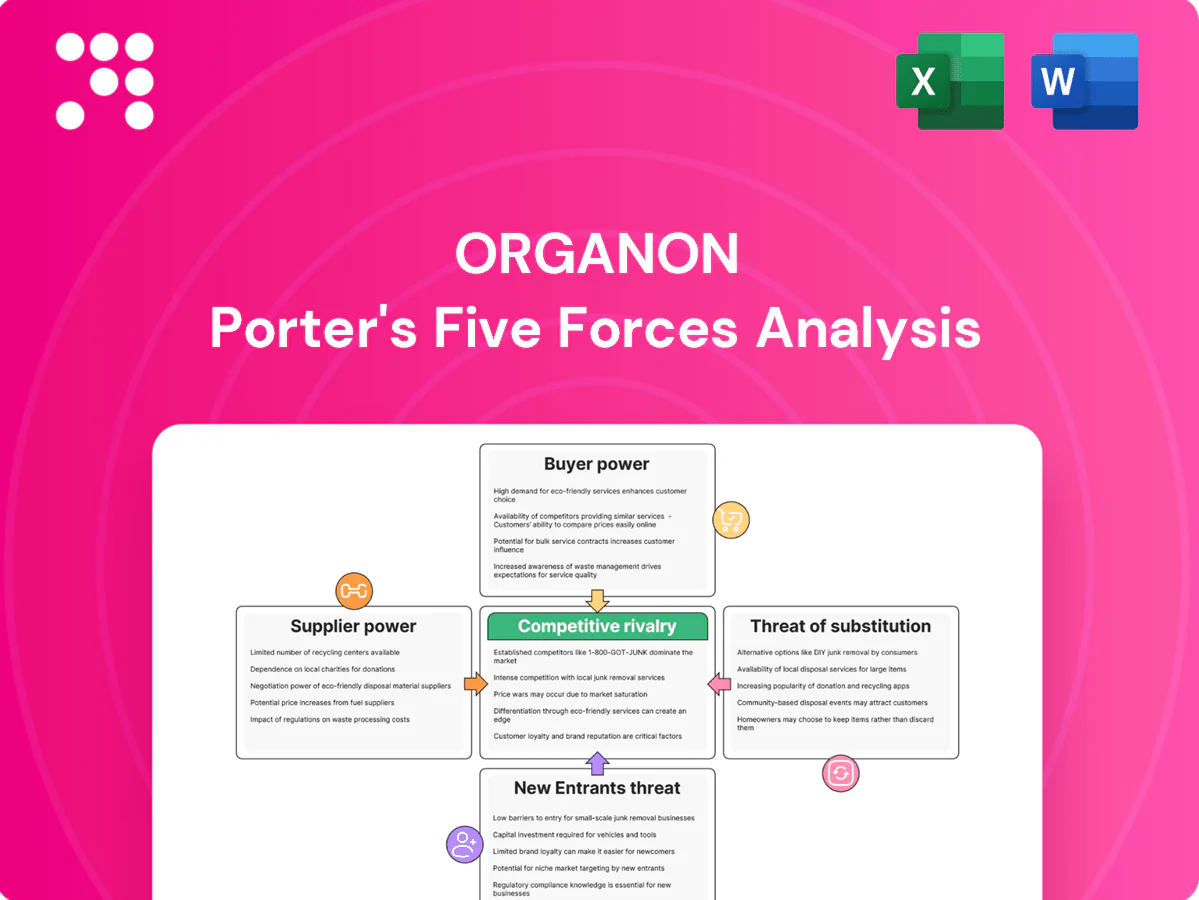
Organon Porter's Five Forces Analysis

From Overview to Strategy Blueprint
Organon's competitive landscape reflects moderate supplier leverage, disciplined buyer negotiation, looming substitute threats in niche therapeutic areas, steady rivalry among mid-size pharma, and selective barriers to new entrants driven by regulatory and R&D costs. These forces shape pricing, pipeline focus, and M&A strategy. Unlock the full Porter's Five Forces Analysis to explore Organon’s competitive dynamics, market pressures, and strategic advantages in detail.
Suppliers Bargaining Power

Concentrated API and biologics inputs
Organon depends on specialized hormone APIs, biologic cell lines and device components from a small pool of qualified vendors, heightening supplier leverage. China and India account for roughly 60–80% of global generic API production, concentrating risk. Regulatory comparability and validation cycles often span 12–24 months, limiting dual-sourcing. Any supplier disruption or quality deviation can quickly raise costs and halt sterile injectable or biologic supply.
High quality and regulatory switching costs
Switching qualified suppliers often requires 6–12 months of audits, process validation and regulatory filings, with direct costs commonly in the tens to low hundreds of thousands of dollars per supplier, raising time and expense barriers.
For biosimilars, even minor process changes can trigger comparability studies and additional filings, extending timelines and costs materially.
These frictions lock in supplier relationships and boost supplier leverage; Organon uses long-term contracts and quality partnerships to mitigate but cannot fully eliminate the switching friction.

Capacity constraints in biologics manufacturing
Global single-use bioreactor and fill-finish slots tightened in 2024, giving CDMOs and equipment vendors outsized negotiating leverage; industry reports cite lead times of 18–36 months for capacity expansion. Priority access commonly requires premiums or multi-year commitments (often 3–7 years), and this squeeze can erode margins materially during fast-scaling biosimilar launches.

Specialized device and packaging ecosystems
Organon’s women’s‑health portfolio relies on device‑enabled delivery and specialized packaging (eg implants, IUD components), where few suppliers meet stringent biocompatibility and GMP standards, creating supplier leverage; Organon reported approximately $4.1 billion in 2024 revenue, increasing exposure to vendor concentration risk. Tooling and design IP often tie Organon to specific vendors, and supplier design input can further entrench dependence.
- Few qualified suppliers — higher bargaining power
- Tooling/IP lock‑in — switching costs
- Supplier design input — deeper entrenchment
Counterweights: scale, planning, and partnerships
Organon leverages global volume forecasts and multi-year supply agreements to extract better pricing and capacity commitments, and in 2024 these contracts underpinned procurement stability as demand normalized post-pandemic. Strategic alliances with biosimilar developers and CDMOs share technical risk and strengthen negotiating leverage. Safety stocks and regional supplier diversification buffer disruptions, but scarce technical APIs and biologics capacity keep supplier power materially relevant.
- Multi-year contracts: improved terms, lower price volatility
- Alliances: risk sharing with CDMOs/biosimilar partners
- Inventories/diversification: regional buffers vs shocks
- Constraint: technical scarcity limits full counterbalance
60–80% supplier concentration and 18–36m CDMO lead times raise risk for $4.1B drugmaker
Organon faces high supplier power from concentrated API/biologics sources (60–80% in China/India) and limited CDMO capacity (18–36 month lead times), raising switching costs (6–12 months, $10k–$300k) and contract premiums (3–7 year commitments). 2024 revenue $4.1B increases exposure despite multi-year contracts, alliances and safety stocks that partially mitigate risk.
| Metric | 2024 |
|---|---|
| Revenue | $4.1B |
| API concentration | 60–80% |
| CDMO lead time | 18–36m |
What is included in the product
 Detailed Word Document
Porter’s Five Forces analysis tailored for Organon—identifies competitive drivers, supplier and buyer influence, threats from substitutes and new entrants, and strategic levers to protect margin; delivered in fully editable Word format for use in investor materials, business plans, and strategy decks.

 Customizable Excel Spreadsheet
Organon's Porter's Five Forces one-sheet distills competitive pressures into a single, actionable view so leaders can quickly spot threats and opportunities; update inputs to model regulation, new entrants or product shifts without hassle. Clean layout and export-ready charts save time for decks, decisions and cross-team alignment.
Customers Bargaining Power

Dominant payers and tender systems
National health systems, PBMs and hospital tender processes consolidate buying power and force down prices: the three largest US PBMs account for roughly 75% of prescription coverage (2024), while EU hospital tenders determine the majority of in‑hospital biologic and contraceptive contracts, and losing a tender can halve volumes within months, compressing margins for Organon.
Price sensitivity in established brands
Off-patent Organon brands face strong price elasticity as generic alternatives set clear reference points; generics account for ~90% of U.S. prescriptions but ~22% of spend (2023–24). Formularies and PBMs (top three control ~80% of scripts) push step-edits and favor lowest net cost, driving widespread discounts, rebates and clawbacks often exceeding 30% for branded drugs. Organon must trade off list versus net price to preserve formulary placement and volume.

Biosimilar adoption protocols
Payer policies on interchangeability and switching drive biosimilar uptake; markets with automatic substitution see price discounts of 20–40% and stronger buyer leverage, while restrictive markets leave HCP discretion dominant. Organon’s evidence packages and real‑world data (post‑launch outcomes, cost‑effectiveness analyses) can shift payer rules and increase uptake.

Patient and physician preferences
In women’s health, adherence, side-effect profiles and mode-of-delivery strongly drive patient and physician choice; WHO estimates medication adherence for chronic conditions averages about 50%, making tolerability and convenience critical.
Strong brand trust and clinician counseling can shift decisions away from price, while AMA data (2023) show 93% of physicians report prior authorization creates barriers and payers use tiering to gate access.
Education and patient-support programs have improved adherence in trials by roughly 10–15%, blunting buyer power at the clinic level.
- Adherence: WHO ~50%
- Physician burden: AMA 2023 — 93% report prior auth issues
- Support impact: adherence +10–15%
- Key levers: tolerability, delivery mode, counseling
Emerging markets procurement dynamics
Large public tenders in emerging markets prioritize lowest cost and supply reliability, increasing customer bargaining power. Currency volatility and reference pricing schemes compress prices and add payment risk. Multi-year framework agreements (commonly 2–3 years) stabilize volumes but push margins into single-digit levels. Local registration, on-the-ground supply and pharmacovigilance systems are mandatory to compete.
- Lowest cost focus
- Supply reliability required
- Frameworks 2–3 years, margins often single-digit
- FX/reference pricing pressure
- Local presence + PV compliance mandatory
PBM power, generics scale, biosimilars cut 20-40% drug prices
Concentrated payers (US top-3 PBMs ~75% script coverage, 2024) and EU tenders compress prices; generics = ~90% prescriptions but ~22% spend (2023–24). Biosimilar substitution cuts prices 20–40%; prior auth burdens 93% physicians (AMA 2023); support programs raise adherence 10–15%.
| Metric | Value | Impact |
|---|---|---|
| Top-3 PBMs | ~75% | High buyer leverage |
| Generics | ~90% Rx / ~22% spend | Price pressure |
Preview Before You Purchase
Organon Porter's Five Forces Analysis
This preview shows the Organon Porter's Five Forces Analysis exactly as delivered after purchase—no placeholders or mockups. The file is fully formatted, comprehensive, and ready for immediate download and use. You're viewing the final document you will receive instantly upon payment.

From Overview to Strategy Blueprint
Organon's competitive landscape reflects moderate supplier leverage, disciplined buyer negotiation, looming substitute threats in niche therapeutic areas, steady rivalry among mid-size pharma, and selective barriers to new entrants driven by regulatory and R&D costs. These forces shape pricing, pipeline focus, and M&A strategy. Unlock the full Porter's Five Forces Analysis to explore Organon’s competitive dynamics, market pressures, and strategic advantages in detail.
Suppliers Bargaining Power
Concentrated API and biologics inputs
Organon depends on specialized hormone APIs, biologic cell lines and device components from a small pool of qualified vendors, heightening supplier leverage. China and India account for roughly 60–80% of global generic API production, concentrating risk. Regulatory comparability and validation cycles often span 12–24 months, limiting dual-sourcing. Any supplier disruption or quality deviation can quickly raise costs and halt sterile injectable or biologic supply.
High quality and regulatory switching costs
Switching qualified suppliers often requires 6–12 months of audits, process validation and regulatory filings, with direct costs commonly in the tens to low hundreds of thousands of dollars per supplier, raising time and expense barriers.
For biosimilars, even minor process changes can trigger comparability studies and additional filings, extending timelines and costs materially.
These frictions lock in supplier relationships and boost supplier leverage; Organon uses long-term contracts and quality partnerships to mitigate but cannot fully eliminate the switching friction.
Capacity constraints in biologics manufacturing
Global single-use bioreactor and fill-finish slots tightened in 2024, giving CDMOs and equipment vendors outsized negotiating leverage; industry reports cite lead times of 18–36 months for capacity expansion. Priority access commonly requires premiums or multi-year commitments (often 3–7 years), and this squeeze can erode margins materially during fast-scaling biosimilar launches.
Specialized device and packaging ecosystems
Organon’s women’s‑health portfolio relies on device‑enabled delivery and specialized packaging (eg implants, IUD components), where few suppliers meet stringent biocompatibility and GMP standards, creating supplier leverage; Organon reported approximately $4.1 billion in 2024 revenue, increasing exposure to vendor concentration risk. Tooling and design IP often tie Organon to specific vendors, and supplier design input can further entrench dependence.
- Few qualified suppliers — higher bargaining power
- Tooling/IP lock‑in — switching costs
- Supplier design input — deeper entrenchment
Counterweights: scale, planning, and partnerships
Organon leverages global volume forecasts and multi-year supply agreements to extract better pricing and capacity commitments, and in 2024 these contracts underpinned procurement stability as demand normalized post-pandemic. Strategic alliances with biosimilar developers and CDMOs share technical risk and strengthen negotiating leverage. Safety stocks and regional supplier diversification buffer disruptions, but scarce technical APIs and biologics capacity keep supplier power materially relevant.
- Multi-year contracts: improved terms, lower price volatility
- Alliances: risk sharing with CDMOs/biosimilar partners
- Inventories/diversification: regional buffers vs shocks
- Constraint: technical scarcity limits full counterbalance
60–80% supplier concentration and 18–36m CDMO lead times raise risk for $4.1B drugmaker
Organon faces high supplier power from concentrated API/biologics sources (60–80% in China/India) and limited CDMO capacity (18–36 month lead times), raising switching costs (6–12 months, $10k–$300k) and contract premiums (3–7 year commitments). 2024 revenue $4.1B increases exposure despite multi-year contracts, alliances and safety stocks that partially mitigate risk.
| Metric | 2024 |
|---|---|
| Revenue | $4.1B |
| API concentration | 60–80% |
| CDMO lead time | 18–36m |
What is included in the product
Detailed Word Document
Porter’s Five Forces analysis tailored for Organon—identifies competitive drivers, supplier and buyer influence, threats from substitutes and new entrants, and strategic levers to protect margin; delivered in fully editable Word format for use in investor materials, business plans, and strategy decks.
Customizable Excel Spreadsheet
Organon's Porter's Five Forces one-sheet distills competitive pressures into a single, actionable view so leaders can quickly spot threats and opportunities; update inputs to model regulation, new entrants or product shifts without hassle. Clean layout and export-ready charts save time for decks, decisions and cross-team alignment.
Customers Bargaining Power
Dominant payers and tender systems
National health systems, PBMs and hospital tender processes consolidate buying power and force down prices: the three largest US PBMs account for roughly 75% of prescription coverage (2024), while EU hospital tenders determine the majority of in‑hospital biologic and contraceptive contracts, and losing a tender can halve volumes within months, compressing margins for Organon.
Price sensitivity in established brands
Off-patent Organon brands face strong price elasticity as generic alternatives set clear reference points; generics account for ~90% of U.S. prescriptions but ~22% of spend (2023–24). Formularies and PBMs (top three control ~80% of scripts) push step-edits and favor lowest net cost, driving widespread discounts, rebates and clawbacks often exceeding 30% for branded drugs. Organon must trade off list versus net price to preserve formulary placement and volume.
Biosimilar adoption protocols
Payer policies on interchangeability and switching drive biosimilar uptake; markets with automatic substitution see price discounts of 20–40% and stronger buyer leverage, while restrictive markets leave HCP discretion dominant. Organon’s evidence packages and real‑world data (post‑launch outcomes, cost‑effectiveness analyses) can shift payer rules and increase uptake.
Patient and physician preferences
In women’s health, adherence, side-effect profiles and mode-of-delivery strongly drive patient and physician choice; WHO estimates medication adherence for chronic conditions averages about 50%, making tolerability and convenience critical.
Strong brand trust and clinician counseling can shift decisions away from price, while AMA data (2023) show 93% of physicians report prior authorization creates barriers and payers use tiering to gate access.
Education and patient-support programs have improved adherence in trials by roughly 10–15%, blunting buyer power at the clinic level.
- Adherence: WHO ~50%
- Physician burden: AMA 2023 — 93% report prior auth issues
- Support impact: adherence +10–15%
- Key levers: tolerability, delivery mode, counseling
Emerging markets procurement dynamics
Large public tenders in emerging markets prioritize lowest cost and supply reliability, increasing customer bargaining power. Currency volatility and reference pricing schemes compress prices and add payment risk. Multi-year framework agreements (commonly 2–3 years) stabilize volumes but push margins into single-digit levels. Local registration, on-the-ground supply and pharmacovigilance systems are mandatory to compete.
- Lowest cost focus
- Supply reliability required
- Frameworks 2–3 years, margins often single-digit
- FX/reference pricing pressure
- Local presence + PV compliance mandatory
PBM power, generics scale, biosimilars cut 20-40% drug prices
Concentrated payers (US top-3 PBMs ~75% script coverage, 2024) and EU tenders compress prices; generics = ~90% prescriptions but ~22% spend (2023–24). Biosimilar substitution cuts prices 20–40%; prior auth burdens 93% physicians (AMA 2023); support programs raise adherence 10–15%.
| Metric | Value | Impact |
|---|---|---|
| Top-3 PBMs | ~75% | High buyer leverage |
| Generics | ~90% Rx / ~22% spend | Price pressure |
Preview Before You Purchase
Organon Porter's Five Forces Analysis
This preview shows the Organon Porter's Five Forces Analysis exactly as delivered after purchase—no placeholders or mockups. The file is fully formatted, comprehensive, and ready for immediate download and use. You're viewing the final document you will receive instantly upon payment.
Original: $10.00
-65%$10.00
$3.50Description
From Overview to Strategy Blueprint
Organon's competitive landscape reflects moderate supplier leverage, disciplined buyer negotiation, looming substitute threats in niche therapeutic areas, steady rivalry among mid-size pharma, and selective barriers to new entrants driven by regulatory and R&D costs. These forces shape pricing, pipeline focus, and M&A strategy. Unlock the full Porter's Five Forces Analysis to explore Organon’s competitive dynamics, market pressures, and strategic advantages in detail.
Suppliers Bargaining Power
Concentrated API and biologics inputs
Organon depends on specialized hormone APIs, biologic cell lines and device components from a small pool of qualified vendors, heightening supplier leverage. China and India account for roughly 60–80% of global generic API production, concentrating risk. Regulatory comparability and validation cycles often span 12–24 months, limiting dual-sourcing. Any supplier disruption or quality deviation can quickly raise costs and halt sterile injectable or biologic supply.
High quality and regulatory switching costs
Switching qualified suppliers often requires 6–12 months of audits, process validation and regulatory filings, with direct costs commonly in the tens to low hundreds of thousands of dollars per supplier, raising time and expense barriers.
For biosimilars, even minor process changes can trigger comparability studies and additional filings, extending timelines and costs materially.
These frictions lock in supplier relationships and boost supplier leverage; Organon uses long-term contracts and quality partnerships to mitigate but cannot fully eliminate the switching friction.
Capacity constraints in biologics manufacturing
Global single-use bioreactor and fill-finish slots tightened in 2024, giving CDMOs and equipment vendors outsized negotiating leverage; industry reports cite lead times of 18–36 months for capacity expansion. Priority access commonly requires premiums or multi-year commitments (often 3–7 years), and this squeeze can erode margins materially during fast-scaling biosimilar launches.
Specialized device and packaging ecosystems
Organon’s women’s‑health portfolio relies on device‑enabled delivery and specialized packaging (eg implants, IUD components), where few suppliers meet stringent biocompatibility and GMP standards, creating supplier leverage; Organon reported approximately $4.1 billion in 2024 revenue, increasing exposure to vendor concentration risk. Tooling and design IP often tie Organon to specific vendors, and supplier design input can further entrench dependence.
- Few qualified suppliers — higher bargaining power
- Tooling/IP lock‑in — switching costs
- Supplier design input — deeper entrenchment
Counterweights: scale, planning, and partnerships
Organon leverages global volume forecasts and multi-year supply agreements to extract better pricing and capacity commitments, and in 2024 these contracts underpinned procurement stability as demand normalized post-pandemic. Strategic alliances with biosimilar developers and CDMOs share technical risk and strengthen negotiating leverage. Safety stocks and regional supplier diversification buffer disruptions, but scarce technical APIs and biologics capacity keep supplier power materially relevant.
- Multi-year contracts: improved terms, lower price volatility
- Alliances: risk sharing with CDMOs/biosimilar partners
- Inventories/diversification: regional buffers vs shocks
- Constraint: technical scarcity limits full counterbalance
60–80% supplier concentration and 18–36m CDMO lead times raise risk for $4.1B drugmaker
Organon faces high supplier power from concentrated API/biologics sources (60–80% in China/India) and limited CDMO capacity (18–36 month lead times), raising switching costs (6–12 months, $10k–$300k) and contract premiums (3–7 year commitments). 2024 revenue $4.1B increases exposure despite multi-year contracts, alliances and safety stocks that partially mitigate risk.
| Metric | 2024 |
|---|---|
| Revenue | $4.1B |
| API concentration | 60–80% |
| CDMO lead time | 18–36m |
What is included in the product
Detailed Word Document
Porter’s Five Forces analysis tailored for Organon—identifies competitive drivers, supplier and buyer influence, threats from substitutes and new entrants, and strategic levers to protect margin; delivered in fully editable Word format for use in investor materials, business plans, and strategy decks.
Customizable Excel Spreadsheet
Organon's Porter's Five Forces one-sheet distills competitive pressures into a single, actionable view so leaders can quickly spot threats and opportunities; update inputs to model regulation, new entrants or product shifts without hassle. Clean layout and export-ready charts save time for decks, decisions and cross-team alignment.
Customers Bargaining Power
Dominant payers and tender systems
National health systems, PBMs and hospital tender processes consolidate buying power and force down prices: the three largest US PBMs account for roughly 75% of prescription coverage (2024), while EU hospital tenders determine the majority of in‑hospital biologic and contraceptive contracts, and losing a tender can halve volumes within months, compressing margins for Organon.
Price sensitivity in established brands
Off-patent Organon brands face strong price elasticity as generic alternatives set clear reference points; generics account for ~90% of U.S. prescriptions but ~22% of spend (2023–24). Formularies and PBMs (top three control ~80% of scripts) push step-edits and favor lowest net cost, driving widespread discounts, rebates and clawbacks often exceeding 30% for branded drugs. Organon must trade off list versus net price to preserve formulary placement and volume.
Biosimilar adoption protocols
Payer policies on interchangeability and switching drive biosimilar uptake; markets with automatic substitution see price discounts of 20–40% and stronger buyer leverage, while restrictive markets leave HCP discretion dominant. Organon’s evidence packages and real‑world data (post‑launch outcomes, cost‑effectiveness analyses) can shift payer rules and increase uptake.
Patient and physician preferences
In women’s health, adherence, side-effect profiles and mode-of-delivery strongly drive patient and physician choice; WHO estimates medication adherence for chronic conditions averages about 50%, making tolerability and convenience critical.
Strong brand trust and clinician counseling can shift decisions away from price, while AMA data (2023) show 93% of physicians report prior authorization creates barriers and payers use tiering to gate access.
Education and patient-support programs have improved adherence in trials by roughly 10–15%, blunting buyer power at the clinic level.
- Adherence: WHO ~50%
- Physician burden: AMA 2023 — 93% report prior auth issues
- Support impact: adherence +10–15%
- Key levers: tolerability, delivery mode, counseling
Emerging markets procurement dynamics
Large public tenders in emerging markets prioritize lowest cost and supply reliability, increasing customer bargaining power. Currency volatility and reference pricing schemes compress prices and add payment risk. Multi-year framework agreements (commonly 2–3 years) stabilize volumes but push margins into single-digit levels. Local registration, on-the-ground supply and pharmacovigilance systems are mandatory to compete.
- Lowest cost focus
- Supply reliability required
- Frameworks 2–3 years, margins often single-digit
- FX/reference pricing pressure
- Local presence + PV compliance mandatory
PBM power, generics scale, biosimilars cut 20-40% drug prices
Concentrated payers (US top-3 PBMs ~75% script coverage, 2024) and EU tenders compress prices; generics = ~90% prescriptions but ~22% spend (2023–24). Biosimilar substitution cuts prices 20–40%; prior auth burdens 93% physicians (AMA 2023); support programs raise adherence 10–15%.
| Metric | Value | Impact |
|---|---|---|
| Top-3 PBMs | ~75% | High buyer leverage |
| Generics | ~90% Rx / ~22% spend | Price pressure |
Preview Before You Purchase
Organon Porter's Five Forces Analysis
This preview shows the Organon Porter's Five Forces Analysis exactly as delivered after purchase—no placeholders or mockups. The file is fully formatted, comprehensive, and ready for immediate download and use. You're viewing the final document you will receive instantly upon payment.











