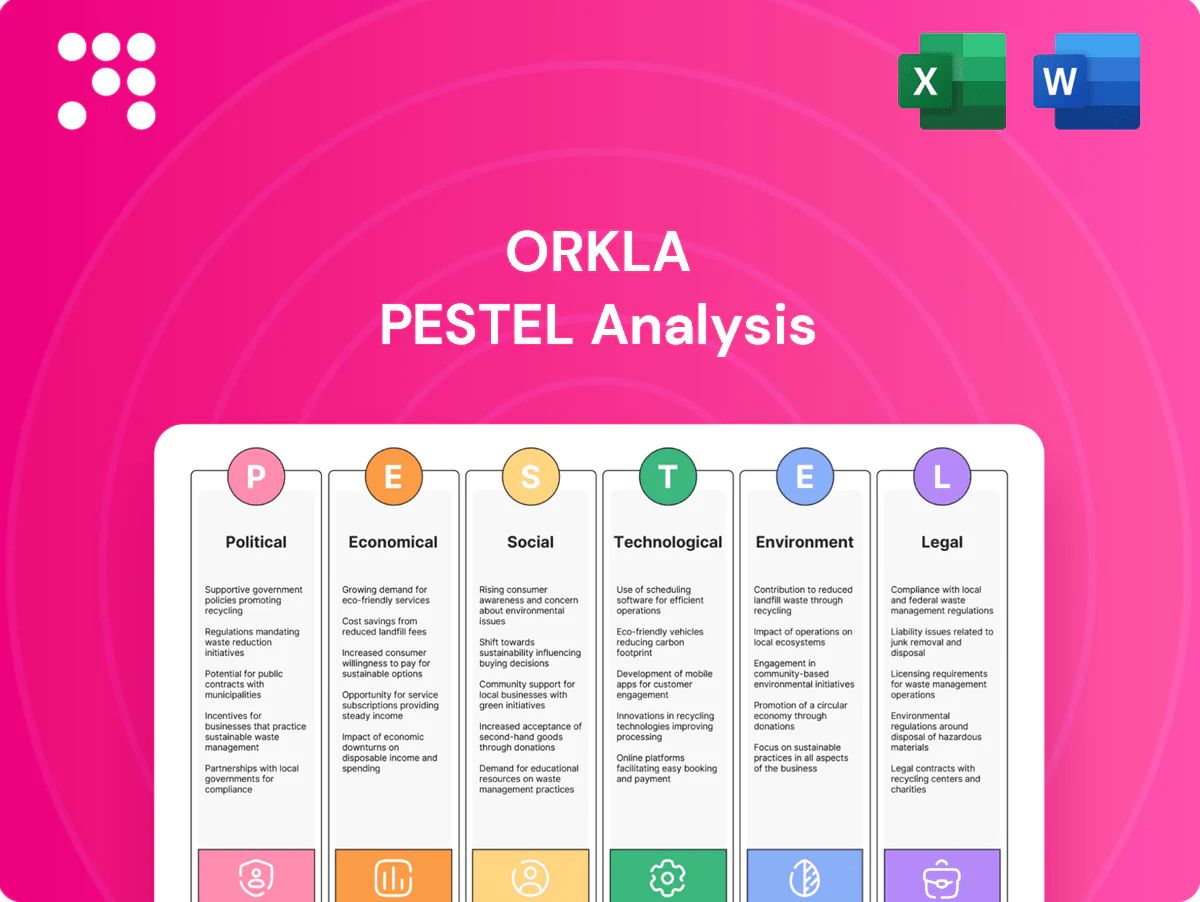
Orkla PESTLE Analysis

Your Shortcut to Market Insight Starts Here
Unlock how political shifts, consumer trends, and sustainability rules are reshaping Orkla’s prospects in our concise PESTLE snapshot. This analysis pinpoints risks and opportunities across markets and supply chains. Ideal for investors and strategists—buy the full PESTLE for detailed, actionable insights you can use today.
Political factors

Nordic-EU policy alignment
Stable Nordic governance and close EU/EEA alignment (single market ~447 million consumers, EEA ~30 states) sets common food, cosmetics and chemical standards, easing cross-border operations while lifting compliance costs by several percentage points. Rapid policy moves on health, sugar and plastics (EU plastics rules 2021–25) can quickly reshape portfolios and packaging; proactive advocacy secures more predictable transition timelines.
Eastern Europe geopolitical risk
Eastern Europe geopolitical risk (13+ EU/UK sanction packages since 2014) drives sanctions, currency volatility—ruble intra-year swings exceeded 30% in 2022–24—and regulatory unpredictability that disrupt sourcing, logistics and demand. Route diversification and increased local footprint reduce exposure. Political risk insurance and dual-sourcing mitigate disruption, while pricing contingencies and 4–8 weeks of inventory buffers help preserve service levels.

India policy dynamics
FSSAI standards, GST and Make-in-India incentives shape food and personal care pricing and compliance—GST slabs for FMCG typically range 5–18% while Make-in-India/PLI incentives across sectors total about Rs 1.97 lakh crore.
Tariff shifts matter: India’s average applied MFN tariff is around 14%, directly raising costs for imported inputs and equipment.
Regulation varies across 28 states and 8 union territories, requiring localized compliance; policy support targeting a rise in manufacturing share to 25% of GDP can improve capacity economics.

Agri and energy subsidies
Subsidies for agriculture, fertilizer and energy materially influence Orkla's input costs; the EU common agricultural policy budget for 2023–27 is about 387 billion EUR, shaping feed and raw-material support levels.
Norway's hydropower supplies roughly 90% of domestic electricity, benefiting renewable-friendly frameworks but remaining exposed to grid bottlenecks and permitting politics; policy withdrawal can whipsaw margins, so hedging and long-term contracts are used to stabilise exposure.
- Subsidy scale: CAP ≈387bn EUR (2023–27)
- Hydropower share: ≈90% Norway generation
- Mitigation: hedging & long-term contracts reduce margin volatility
Public health and nutrition agendas
Nordic/EU single market (≈447M) boosts standards but raises compliance and reformulation costs
Stable Nordic/EU alignment (single market ≈447M) eases cross-border standards but raises compliance costs; rapid rules on plastics, sugar and labeling (>60 SSB tax countries by 2024) force reformulation. Geopolitical risk in E.Europe raises sanctions/currency volatility; India tariffs ≈14% and CAP ≈387bn EUR shift input economics. Norway hydropower ≈90% reduces carbon risk but adds permitting exposure.
| Metric | Value |
|---|---|
| EU market | ≈447M |
| CAP 2023–27 | ≈387bn EUR |
| SSB tax countries | >60 (2024) |
| Norway hydro | ≈90% |
| India MFN tariff | ≈14% |
What is included in the product
 Detailed Word Document
Explores how external macro-environmental factors uniquely affect Orkla across Political, Economic, Social, Technological, Environmental and Legal dimensions, with region- and industry-specific examples.
Each section is data-backed, forward-looking and formatted for executives, consultants and investors to identify threats, opportunities and inform scenario planning.

 Customizable Excel Spreadsheet
A concise, visually segmented PESTLE summary for Orkla that simplifies external risk assessment for meetings or presentations, is easily shared across teams, and can be edited with region- or business-specific notes for rapid alignment.
Economic factors

Consumer spending cycles
Inflation and rates in the Nordics (avg CPI ~3.5% in 2024) and Eastern Europe (avg CPI ~8% in 2024) steer FMCG trading up or down, pushing consumers toward premium or value tiers; private label gained about 1.5 pp market share in many markets as real incomes tightened. India's rising middle class (~350 million in 2025) supports volume growth, while price-pack architecture preserves affordability and margin.
FX and multi-currency exposure
Orkla earns and spends across NOK, SEK, DKK, EUR, PLN, CZK and INR, so FX swings directly shift COGS and reported earnings through both transaction and translation effects. The group relies on natural hedges—matching local revenue with local procurement—and uses derivatives for residual exposure management. Increasing local sourcing in markets like Poland and India reduces both translation volatility and transaction risk.

Commodity and energy inputs
Grains, edible oils, sugar, paper, plastics and chemicals drive Orkla’s COGS volatility as these raw materials dominate input spend across food, home and personal care lines. Energy costs—notably Norway’s power market, where hydropower supplies >90% of generation—shape plant economics and margins. Index-linked supplier contracts and structured SRM programs cushion price shocks, while reformulation and packaging light-weighting reduce exposure to commodity swings.

Channel mix and margins
Channel mix shapes Orkla margins: grocery, pharmacy and out-of-home show different price and promo dynamics—grocery relies on weekly promos, pharmacy on regulated pricing and loyalty, out-of-home on contract margins; e-commerce raises fulfillment and returns costs but increases reach and penetration; discounters continue to exert downward pressure on branded pricing in mature Nordic and Central European markets; revenue growth management and mix optimisation protect contribution margins.
- Grocery: promo-driven margins
- Pharmacy: regulated pricing, stable margins
- Out-of-home: contract-based margins
- E-commerce: higher fulfillment costs, wider reach
- Discounters: pricing pressure
- RGM: defends contribution
Scale and productivity
Orkla leverages consolidation, shared services and automation to lift fixed-cost absorption, while network optimization reduces logistics miles and carbon intensity. Capex discipline focuses investments to secure acceptable IRR across downside demand scenarios, and continuous improvement programs sustain productivity and competitiveness.
- Consolidation: centralized procurement and S&OP
- Shared services: finance, IT, HR efficiencies
- Automation: faster lines, lower unit costs
- Network: fewer transport miles, lower logistics spend
- Capex discipline: IRR-focused investments
- CI: ongoing cost and yield gains
Nordic/EU single market (≈447M) boosts standards but raises compliance and reformulation costs
Inflation varies: Nordics CPI ~3.5% (2024) vs Eastern Europe ~8% (2024), shifting consumers between premium and value tiers. Orkla faces FX across NOK/SEK/DKK/EUR/PLN/CZK/INR; local sourcing and hedges limit translation risk. Key cost drivers: grains, oils, sugar, energy; energy exposure reduced by Norway hydropower share >90%.
| Metric | 2024/25 |
|---|---|
| Nordics CPI | ~3.5% |
| EE CPI | ~8% |
| India middle class | ~350m (2025) |
| Norway hydropower | >90% |
Preview Before You Purchase
Orkla PESTLE Analysis
The preview shown here is the exact Orkla PESTLE Analysis document you’ll receive after purchase—fully formatted and ready to use. The layout, content, and structure visible are identical to the downloadable file. No placeholders or teasers; this is the final, professionally structured report. You’ll be able to download it immediately after payment.

Your Shortcut to Market Insight Starts Here
Unlock how political shifts, consumer trends, and sustainability rules are reshaping Orkla’s prospects in our concise PESTLE snapshot. This analysis pinpoints risks and opportunities across markets and supply chains. Ideal for investors and strategists—buy the full PESTLE for detailed, actionable insights you can use today.
Political factors
Nordic-EU policy alignment
Stable Nordic governance and close EU/EEA alignment (single market ~447 million consumers, EEA ~30 states) sets common food, cosmetics and chemical standards, easing cross-border operations while lifting compliance costs by several percentage points. Rapid policy moves on health, sugar and plastics (EU plastics rules 2021–25) can quickly reshape portfolios and packaging; proactive advocacy secures more predictable transition timelines.
Eastern Europe geopolitical risk
Eastern Europe geopolitical risk (13+ EU/UK sanction packages since 2014) drives sanctions, currency volatility—ruble intra-year swings exceeded 30% in 2022–24—and regulatory unpredictability that disrupt sourcing, logistics and demand. Route diversification and increased local footprint reduce exposure. Political risk insurance and dual-sourcing mitigate disruption, while pricing contingencies and 4–8 weeks of inventory buffers help preserve service levels.
India policy dynamics
FSSAI standards, GST and Make-in-India incentives shape food and personal care pricing and compliance—GST slabs for FMCG typically range 5–18% while Make-in-India/PLI incentives across sectors total about Rs 1.97 lakh crore.
Tariff shifts matter: India’s average applied MFN tariff is around 14%, directly raising costs for imported inputs and equipment.
Regulation varies across 28 states and 8 union territories, requiring localized compliance; policy support targeting a rise in manufacturing share to 25% of GDP can improve capacity economics.
Agri and energy subsidies
Subsidies for agriculture, fertilizer and energy materially influence Orkla's input costs; the EU common agricultural policy budget for 2023–27 is about 387 billion EUR, shaping feed and raw-material support levels.
Norway's hydropower supplies roughly 90% of domestic electricity, benefiting renewable-friendly frameworks but remaining exposed to grid bottlenecks and permitting politics; policy withdrawal can whipsaw margins, so hedging and long-term contracts are used to stabilise exposure.
- Subsidy scale: CAP ≈387bn EUR (2023–27)
- Hydropower share: ≈90% Norway generation
- Mitigation: hedging & long-term contracts reduce margin volatility
Public health and nutrition agendas
Nordic/EU single market (≈447M) boosts standards but raises compliance and reformulation costs
Stable Nordic/EU alignment (single market ≈447M) eases cross-border standards but raises compliance costs; rapid rules on plastics, sugar and labeling (>60 SSB tax countries by 2024) force reformulation. Geopolitical risk in E.Europe raises sanctions/currency volatility; India tariffs ≈14% and CAP ≈387bn EUR shift input economics. Norway hydropower ≈90% reduces carbon risk but adds permitting exposure.
| Metric | Value |
|---|---|
| EU market | ≈447M |
| CAP 2023–27 | ≈387bn EUR |
| SSB tax countries | >60 (2024) |
| Norway hydro | ≈90% |
| India MFN tariff | ≈14% |
What is included in the product
Detailed Word Document
Explores how external macro-environmental factors uniquely affect Orkla across Political, Economic, Social, Technological, Environmental and Legal dimensions, with region- and industry-specific examples.
Each section is data-backed, forward-looking and formatted for executives, consultants and investors to identify threats, opportunities and inform scenario planning.
Customizable Excel Spreadsheet
A concise, visually segmented PESTLE summary for Orkla that simplifies external risk assessment for meetings or presentations, is easily shared across teams, and can be edited with region- or business-specific notes for rapid alignment.
Economic factors
Consumer spending cycles
Inflation and rates in the Nordics (avg CPI ~3.5% in 2024) and Eastern Europe (avg CPI ~8% in 2024) steer FMCG trading up or down, pushing consumers toward premium or value tiers; private label gained about 1.5 pp market share in many markets as real incomes tightened. India's rising middle class (~350 million in 2025) supports volume growth, while price-pack architecture preserves affordability and margin.
FX and multi-currency exposure
Orkla earns and spends across NOK, SEK, DKK, EUR, PLN, CZK and INR, so FX swings directly shift COGS and reported earnings through both transaction and translation effects. The group relies on natural hedges—matching local revenue with local procurement—and uses derivatives for residual exposure management. Increasing local sourcing in markets like Poland and India reduces both translation volatility and transaction risk.
Commodity and energy inputs
Grains, edible oils, sugar, paper, plastics and chemicals drive Orkla’s COGS volatility as these raw materials dominate input spend across food, home and personal care lines. Energy costs—notably Norway’s power market, where hydropower supplies >90% of generation—shape plant economics and margins. Index-linked supplier contracts and structured SRM programs cushion price shocks, while reformulation and packaging light-weighting reduce exposure to commodity swings.
Channel mix and margins
Channel mix shapes Orkla margins: grocery, pharmacy and out-of-home show different price and promo dynamics—grocery relies on weekly promos, pharmacy on regulated pricing and loyalty, out-of-home on contract margins; e-commerce raises fulfillment and returns costs but increases reach and penetration; discounters continue to exert downward pressure on branded pricing in mature Nordic and Central European markets; revenue growth management and mix optimisation protect contribution margins.
- Grocery: promo-driven margins
- Pharmacy: regulated pricing, stable margins
- Out-of-home: contract-based margins
- E-commerce: higher fulfillment costs, wider reach
- Discounters: pricing pressure
- RGM: defends contribution
Scale and productivity
Orkla leverages consolidation, shared services and automation to lift fixed-cost absorption, while network optimization reduces logistics miles and carbon intensity. Capex discipline focuses investments to secure acceptable IRR across downside demand scenarios, and continuous improvement programs sustain productivity and competitiveness.
- Consolidation: centralized procurement and S&OP
- Shared services: finance, IT, HR efficiencies
- Automation: faster lines, lower unit costs
- Network: fewer transport miles, lower logistics spend
- Capex discipline: IRR-focused investments
- CI: ongoing cost and yield gains
Nordic/EU single market (≈447M) boosts standards but raises compliance and reformulation costs
Inflation varies: Nordics CPI ~3.5% (2024) vs Eastern Europe ~8% (2024), shifting consumers between premium and value tiers. Orkla faces FX across NOK/SEK/DKK/EUR/PLN/CZK/INR; local sourcing and hedges limit translation risk. Key cost drivers: grains, oils, sugar, energy; energy exposure reduced by Norway hydropower share >90%.
| Metric | 2024/25 |
|---|---|
| Nordics CPI | ~3.5% |
| EE CPI | ~8% |
| India middle class | ~350m (2025) |
| Norway hydropower | >90% |
Preview Before You Purchase
Orkla PESTLE Analysis
The preview shown here is the exact Orkla PESTLE Analysis document you’ll receive after purchase—fully formatted and ready to use. The layout, content, and structure visible are identical to the downloadable file. No placeholders or teasers; this is the final, professionally structured report. You’ll be able to download it immediately after payment.
Original: $10.00
-65%$10.00
$3.50Description
Your Shortcut to Market Insight Starts Here
Unlock how political shifts, consumer trends, and sustainability rules are reshaping Orkla’s prospects in our concise PESTLE snapshot. This analysis pinpoints risks and opportunities across markets and supply chains. Ideal for investors and strategists—buy the full PESTLE for detailed, actionable insights you can use today.
Political factors
Nordic-EU policy alignment
Stable Nordic governance and close EU/EEA alignment (single market ~447 million consumers, EEA ~30 states) sets common food, cosmetics and chemical standards, easing cross-border operations while lifting compliance costs by several percentage points. Rapid policy moves on health, sugar and plastics (EU plastics rules 2021–25) can quickly reshape portfolios and packaging; proactive advocacy secures more predictable transition timelines.
Eastern Europe geopolitical risk
Eastern Europe geopolitical risk (13+ EU/UK sanction packages since 2014) drives sanctions, currency volatility—ruble intra-year swings exceeded 30% in 2022–24—and regulatory unpredictability that disrupt sourcing, logistics and demand. Route diversification and increased local footprint reduce exposure. Political risk insurance and dual-sourcing mitigate disruption, while pricing contingencies and 4–8 weeks of inventory buffers help preserve service levels.
India policy dynamics
FSSAI standards, GST and Make-in-India incentives shape food and personal care pricing and compliance—GST slabs for FMCG typically range 5–18% while Make-in-India/PLI incentives across sectors total about Rs 1.97 lakh crore.
Tariff shifts matter: India’s average applied MFN tariff is around 14%, directly raising costs for imported inputs and equipment.
Regulation varies across 28 states and 8 union territories, requiring localized compliance; policy support targeting a rise in manufacturing share to 25% of GDP can improve capacity economics.
Agri and energy subsidies
Subsidies for agriculture, fertilizer and energy materially influence Orkla's input costs; the EU common agricultural policy budget for 2023–27 is about 387 billion EUR, shaping feed and raw-material support levels.
Norway's hydropower supplies roughly 90% of domestic electricity, benefiting renewable-friendly frameworks but remaining exposed to grid bottlenecks and permitting politics; policy withdrawal can whipsaw margins, so hedging and long-term contracts are used to stabilise exposure.
- Subsidy scale: CAP ≈387bn EUR (2023–27)
- Hydropower share: ≈90% Norway generation
- Mitigation: hedging & long-term contracts reduce margin volatility
Public health and nutrition agendas
Nordic/EU single market (≈447M) boosts standards but raises compliance and reformulation costs
Stable Nordic/EU alignment (single market ≈447M) eases cross-border standards but raises compliance costs; rapid rules on plastics, sugar and labeling (>60 SSB tax countries by 2024) force reformulation. Geopolitical risk in E.Europe raises sanctions/currency volatility; India tariffs ≈14% and CAP ≈387bn EUR shift input economics. Norway hydropower ≈90% reduces carbon risk but adds permitting exposure.
| Metric | Value |
|---|---|
| EU market | ≈447M |
| CAP 2023–27 | ≈387bn EUR |
| SSB tax countries | >60 (2024) |
| Norway hydro | ≈90% |
| India MFN tariff | ≈14% |
What is included in the product
Detailed Word Document
Explores how external macro-environmental factors uniquely affect Orkla across Political, Economic, Social, Technological, Environmental and Legal dimensions, with region- and industry-specific examples.
Each section is data-backed, forward-looking and formatted for executives, consultants and investors to identify threats, opportunities and inform scenario planning.
Customizable Excel Spreadsheet
A concise, visually segmented PESTLE summary for Orkla that simplifies external risk assessment for meetings or presentations, is easily shared across teams, and can be edited with region- or business-specific notes for rapid alignment.
Economic factors
Consumer spending cycles
Inflation and rates in the Nordics (avg CPI ~3.5% in 2024) and Eastern Europe (avg CPI ~8% in 2024) steer FMCG trading up or down, pushing consumers toward premium or value tiers; private label gained about 1.5 pp market share in many markets as real incomes tightened. India's rising middle class (~350 million in 2025) supports volume growth, while price-pack architecture preserves affordability and margin.
FX and multi-currency exposure
Orkla earns and spends across NOK, SEK, DKK, EUR, PLN, CZK and INR, so FX swings directly shift COGS and reported earnings through both transaction and translation effects. The group relies on natural hedges—matching local revenue with local procurement—and uses derivatives for residual exposure management. Increasing local sourcing in markets like Poland and India reduces both translation volatility and transaction risk.
Commodity and energy inputs
Grains, edible oils, sugar, paper, plastics and chemicals drive Orkla’s COGS volatility as these raw materials dominate input spend across food, home and personal care lines. Energy costs—notably Norway’s power market, where hydropower supplies >90% of generation—shape plant economics and margins. Index-linked supplier contracts and structured SRM programs cushion price shocks, while reformulation and packaging light-weighting reduce exposure to commodity swings.
Channel mix and margins
Channel mix shapes Orkla margins: grocery, pharmacy and out-of-home show different price and promo dynamics—grocery relies on weekly promos, pharmacy on regulated pricing and loyalty, out-of-home on contract margins; e-commerce raises fulfillment and returns costs but increases reach and penetration; discounters continue to exert downward pressure on branded pricing in mature Nordic and Central European markets; revenue growth management and mix optimisation protect contribution margins.
- Grocery: promo-driven margins
- Pharmacy: regulated pricing, stable margins
- Out-of-home: contract-based margins
- E-commerce: higher fulfillment costs, wider reach
- Discounters: pricing pressure
- RGM: defends contribution
Scale and productivity
Orkla leverages consolidation, shared services and automation to lift fixed-cost absorption, while network optimization reduces logistics miles and carbon intensity. Capex discipline focuses investments to secure acceptable IRR across downside demand scenarios, and continuous improvement programs sustain productivity and competitiveness.
- Consolidation: centralized procurement and S&OP
- Shared services: finance, IT, HR efficiencies
- Automation: faster lines, lower unit costs
- Network: fewer transport miles, lower logistics spend
- Capex discipline: IRR-focused investments
- CI: ongoing cost and yield gains
Nordic/EU single market (≈447M) boosts standards but raises compliance and reformulation costs
Inflation varies: Nordics CPI ~3.5% (2024) vs Eastern Europe ~8% (2024), shifting consumers between premium and value tiers. Orkla faces FX across NOK/SEK/DKK/EUR/PLN/CZK/INR; local sourcing and hedges limit translation risk. Key cost drivers: grains, oils, sugar, energy; energy exposure reduced by Norway hydropower share >90%.
| Metric | 2024/25 |
|---|---|
| Nordics CPI | ~3.5% |
| EE CPI | ~8% |
| India middle class | ~350m (2025) |
| Norway hydropower | >90% |
Preview Before You Purchase
Orkla PESTLE Analysis
The preview shown here is the exact Orkla PESTLE Analysis document you’ll receive after purchase—fully formatted and ready to use. The layout, content, and structure visible are identical to the downloadable file. No placeholders or teasers; this is the final, professionally structured report. You’ll be able to download it immediately after payment.











