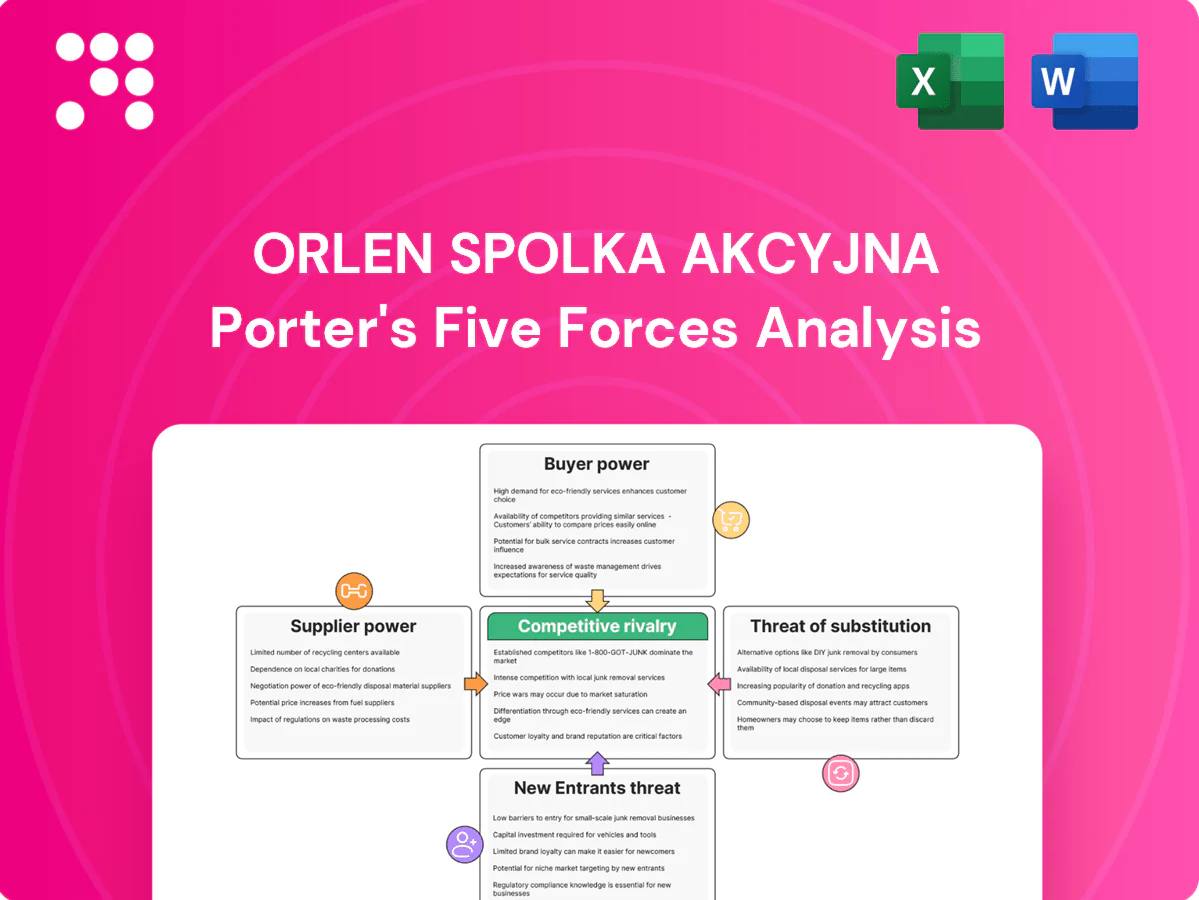
ORLEN Spolka Akcyjna Porter's Five Forces Analysis

Go Beyond the Preview—Access the Full Strategic Report
ORLEN S.A. faces intense industry rivalry, moderate supplier power, evolving buyer preferences, measurable threat from substitutes (renewables) and regulatory-driven barriers to entry; these forces shape margins and strategic choices. This brief preview hints at vulnerabilities and advantages—unlock the full Porter's Five Forces Analysis for force-by-force ratings, visuals, and actionable strategy to inform investment or corporate decisions.
Suppliers Bargaining Power

Concentrated crude sources
Global crude is concentrated: OPEC+ supplied roughly 45% of oil in 2024 and national oil companies control about 80% of proved reserves, limiting ORLEN’s bargaining leverage. Sanctions and geopolitics have cut Russian crude flows to the EU to around 8% in 2024, narrowing Central European sourcing. Concentration drives price premia and tighter contract terms for reliability. ORLEN’s mix of seaborne, pipeline and regional buys partially mitigates supplier power.
Gas and power feedstock
Natural gas suppliers and power generators drive margins in ORLENs refining, petrochemical and CHP operations by setting feedstock costs and availability. Volatile hub prices and occasional capacity constraints force flexible operating schedules and compress margins during spikes. Long-term contracts and storage mitigate but do not remove exposure to spot swings. Upstream integration and active trading partially offset supplier power by securing supply and capturing margin.

Technology and catalyst licensors
Refining and petrochemical units at ORLEN depend on specialized licensors, catalysts and OEMs with few viable substitutes, giving suppliers notable leverage; catalyst qualification cycles typically run 6–18 months and switching can incur multimillion‑zloty costs. Performance guarantees and tight maintenance windows amplify dependence, as unplanned downtime can cost operators millions per day. ORLEN’s multi‑sourcing and in‑house optimization lower but do not eliminate this supplier power.

Transport and logistics nodes
Pipelines, terminals and railcar fleets act as chokepoints that give infrastructure operators leverage over ORLEN, especially where alternatives are limited; in 2024 ORLEN operated about 2,900 service stations, underscoring dependence on steady feedstock flows. Landlocked or chokepoint regions raise transport costs and reduce operational flexibility. Congestion or tariff hikes can compress refinery netbacks. Vertical integration into logistics has been used to mitigate exposure where feasible.
- Pipelines/terminals: bottleneck pricing risk
- Landlocked/chokepoints: higher costs, less flexibility
- Congestion/tariffs: compress netbacks
- Mitigation: vertical logistics integration
Renewables equipment and EPC
Renewables equipment and EPC for ORLEN face cyclical shortages with wind turbine lead times of 12–24 months and PV module backlogs of 6–12 months in 2024; policy-driven demand in Poland and EU has tightened supply, lifting equipment prices and warranty demands. Grid connection queues act as de facto supplier constraints, while strategic partnerships and framework agreements can mitigate exposure.
- turbines: 12–24m (2024)
- pv modules: 6–12m (2024)
- mitigation: framework agreements, strategic partnerships
OPEC+ 45%; NOCs 80% - feedstock, power volatility cut margins
Suppliers concentrated: OPEC+ ~45% supply (2024) and NOCs hold ~80% reserves, limiting ORLEN’s price leverage.
Feedstock and power volatility (hub spikes) compress margins despite long‑term contracts, storage and trading offsets.
Specialized catalysts, licensors and transport chokepoints (ORLEN ~2,900 stations) create switching costs; vertical logistics partially mitigates.
| Metric | 2024 |
|---|---|
| OPEC+ share | 45% |
| Russian crude to EU | 8% |
| ORLEN stations | 2,900 |
What is included in the product
 Detailed Word Document
Tailored Porter's Five Forces analysis for ORLEN Spolka Akcyjna, uncovering competitive rivalry, supplier and buyer power, threat of new entrants and substitutes, and highlighting disruptive forces and market entry barriers that shape its pricing, profitability and strategic positioning.

 Customizable Excel Spreadsheet
One-sheet Porter’s Five Forces for ORLEN S.A.—quickly visualize supplier, buyer, entrant, substitute and rivalry pressures with customizable scores and radar chart for scenario planning; clean, deck-ready layout with no complex setup so you can swap data to reflect regulatory or energy-market shifts.
Customers Bargaining Power

Price-sensitive retail motorists
Price-sensitive retail motorists switch easily among fuel stations due to high price transparency and a dense network; ORLEN operated c. 3,000 service stations across CEE in 2024, reinforcing easy substitution. Loyalty program Vitay (over 9 million members by 2023) and convenience retail reduce churn but do not eliminate price-driven switching. High fuel price volatility increases basket elasticity, while prime locations and ORLEN brand trust partially preserve margins.
Large B2B and wholesale
Large B2B and wholesale buyers—industrial clients, airlines and distributors—purchase in bulk and push aggressive terms; contracted volumes and tender-based procurement in 2024 shifted bargaining leverage toward buyers. Quality specifications and security-of-supply for aviation and industrial fuels allow ORLEN to command premiums. A diversified customer base and value-added services across ~2,900 service points in 2024 improve retention.

Petrochemical converters
European petrochemical converters face high supplier mobility across the EU, given a regional polymers demand of about 46.7 million tonnes (PlasticsEurope 2023), weakening ORLEN’s pricing leverage. Benchmark-linked contracts tied to naphtha/ethylene indices limit ORLEN’s ability to differentiate on price. Strong technical service, product specs and on-time supply can lock in volumes. ORLEN’s Central European proximity and logistics lower lead times versus seaborne suppliers.

Power and heat customers
Power and heat customers increasingly demand green attributes and fixed-price certainty, with European corporate PPA volumes surpassing 10 GW cumulatively by 2024, boosting buyer leverage in negotiations. Competitive auctions and PPAs force ORLEN to match price and contractual flexibility, while certification and guarantees of origin drive procurement decisions. ORLEN’s integrated generation and trading allow tailored bundled offers that blunt customer bargaining power.
- Green demand: buyers insist on guarantees of origin
- Price certainty: fixed-price PPAs and auctions increase leverage
- Market scale: >10 GW corporate PPA market (Europe, 2024)
- ORLEN strength: integrated generation + trading enables bespoke deals
Regulators as meta-buyers
Regulators act as meta-buyers for ORLEN, using excise taxes, price caps and strategic stock rules (EU 90-day oil stock mandate) to shape retail prices and margins; policy moves in 2022–24 showed how interventions can amplify buyer power in crises. Compliance costs and limits on pass-through compress profitability, forcing ORLEN to absorb higher input costs or reduce margins. Constructive engagement and transparent forecasting reduce the risk of abrupt regulatory shocks.
- Excise taxes reduce margin flexibility
- EU 90-day stock rule increases working capital
- Price caps amplify buyer leverage in crises
- Engagement and transparency mitigate sudden impacts
Retail price pressure: motorists switch across ~3,000 stations despite >9m loyalty
Customers exert strong price pressure: retail motorists switch easily across c.3,000 ORLEN stations (2024) despite Vitay loyalty >9m (2023); large B2B buyers push tender terms but aviation/industrial needs secure premiums; petrochemical converters face regional polymers demand ~46.7Mt (2023) reducing price power; power buyers drive green/fixed-price PPA demand >10GW (2024), and regulators (EU 90-day stock) constrain margins.
| Metric | Value |
|---|---|
| ORLEN service stations (2024) | ~3,000 |
| Vitay members (2023) | >9,000,000 |
| EU polymers demand (2023) | 46.7 Mt |
| Corporate PPA market (2024) | >10 GW |
| EU oil stock rule | 90 days |
Preview the Actual Deliverable
ORLEN Spolka Akcyjna Porter's Five Forces Analysis
This preview shows the exact ORLEN Spolka Akcyjna Porter’s Five Forces analysis you’ll receive upon purchase. It is the full, professionally formatted document—no placeholders or mockups—ready for immediate download and use. The content covers competitive rivalry, supplier and buyer power, threat of substitutes, and barriers to entry with actionable insights and supporting data.

Go Beyond the Preview—Access the Full Strategic Report
ORLEN S.A. faces intense industry rivalry, moderate supplier power, evolving buyer preferences, measurable threat from substitutes (renewables) and regulatory-driven barriers to entry; these forces shape margins and strategic choices. This brief preview hints at vulnerabilities and advantages—unlock the full Porter's Five Forces Analysis for force-by-force ratings, visuals, and actionable strategy to inform investment or corporate decisions.
Suppliers Bargaining Power
Concentrated crude sources
Global crude is concentrated: OPEC+ supplied roughly 45% of oil in 2024 and national oil companies control about 80% of proved reserves, limiting ORLEN’s bargaining leverage. Sanctions and geopolitics have cut Russian crude flows to the EU to around 8% in 2024, narrowing Central European sourcing. Concentration drives price premia and tighter contract terms for reliability. ORLEN’s mix of seaborne, pipeline and regional buys partially mitigates supplier power.
Gas and power feedstock
Natural gas suppliers and power generators drive margins in ORLENs refining, petrochemical and CHP operations by setting feedstock costs and availability. Volatile hub prices and occasional capacity constraints force flexible operating schedules and compress margins during spikes. Long-term contracts and storage mitigate but do not remove exposure to spot swings. Upstream integration and active trading partially offset supplier power by securing supply and capturing margin.
Technology and catalyst licensors
Refining and petrochemical units at ORLEN depend on specialized licensors, catalysts and OEMs with few viable substitutes, giving suppliers notable leverage; catalyst qualification cycles typically run 6–18 months and switching can incur multimillion‑zloty costs. Performance guarantees and tight maintenance windows amplify dependence, as unplanned downtime can cost operators millions per day. ORLEN’s multi‑sourcing and in‑house optimization lower but do not eliminate this supplier power.
Transport and logistics nodes
Pipelines, terminals and railcar fleets act as chokepoints that give infrastructure operators leverage over ORLEN, especially where alternatives are limited; in 2024 ORLEN operated about 2,900 service stations, underscoring dependence on steady feedstock flows. Landlocked or chokepoint regions raise transport costs and reduce operational flexibility. Congestion or tariff hikes can compress refinery netbacks. Vertical integration into logistics has been used to mitigate exposure where feasible.
- Pipelines/terminals: bottleneck pricing risk
- Landlocked/chokepoints: higher costs, less flexibility
- Congestion/tariffs: compress netbacks
- Mitigation: vertical logistics integration
Renewables equipment and EPC
Renewables equipment and EPC for ORLEN face cyclical shortages with wind turbine lead times of 12–24 months and PV module backlogs of 6–12 months in 2024; policy-driven demand in Poland and EU has tightened supply, lifting equipment prices and warranty demands. Grid connection queues act as de facto supplier constraints, while strategic partnerships and framework agreements can mitigate exposure.
- turbines: 12–24m (2024)
- pv modules: 6–12m (2024)
- mitigation: framework agreements, strategic partnerships
OPEC+ 45%; NOCs 80% - feedstock, power volatility cut margins
Suppliers concentrated: OPEC+ ~45% supply (2024) and NOCs hold ~80% reserves, limiting ORLEN’s price leverage.
Feedstock and power volatility (hub spikes) compress margins despite long‑term contracts, storage and trading offsets.
Specialized catalysts, licensors and transport chokepoints (ORLEN ~2,900 stations) create switching costs; vertical logistics partially mitigates.
| Metric | 2024 |
|---|---|
| OPEC+ share | 45% |
| Russian crude to EU | 8% |
| ORLEN stations | 2,900 |
What is included in the product
Detailed Word Document
Tailored Porter's Five Forces analysis for ORLEN Spolka Akcyjna, uncovering competitive rivalry, supplier and buyer power, threat of new entrants and substitutes, and highlighting disruptive forces and market entry barriers that shape its pricing, profitability and strategic positioning.
Customizable Excel Spreadsheet
One-sheet Porter’s Five Forces for ORLEN S.A.—quickly visualize supplier, buyer, entrant, substitute and rivalry pressures with customizable scores and radar chart for scenario planning; clean, deck-ready layout with no complex setup so you can swap data to reflect regulatory or energy-market shifts.
Customers Bargaining Power
Price-sensitive retail motorists
Price-sensitive retail motorists switch easily among fuel stations due to high price transparency and a dense network; ORLEN operated c. 3,000 service stations across CEE in 2024, reinforcing easy substitution. Loyalty program Vitay (over 9 million members by 2023) and convenience retail reduce churn but do not eliminate price-driven switching. High fuel price volatility increases basket elasticity, while prime locations and ORLEN brand trust partially preserve margins.
Large B2B and wholesale
Large B2B and wholesale buyers—industrial clients, airlines and distributors—purchase in bulk and push aggressive terms; contracted volumes and tender-based procurement in 2024 shifted bargaining leverage toward buyers. Quality specifications and security-of-supply for aviation and industrial fuels allow ORLEN to command premiums. A diversified customer base and value-added services across ~2,900 service points in 2024 improve retention.
Petrochemical converters
European petrochemical converters face high supplier mobility across the EU, given a regional polymers demand of about 46.7 million tonnes (PlasticsEurope 2023), weakening ORLEN’s pricing leverage. Benchmark-linked contracts tied to naphtha/ethylene indices limit ORLEN’s ability to differentiate on price. Strong technical service, product specs and on-time supply can lock in volumes. ORLEN’s Central European proximity and logistics lower lead times versus seaborne suppliers.
Power and heat customers
Power and heat customers increasingly demand green attributes and fixed-price certainty, with European corporate PPA volumes surpassing 10 GW cumulatively by 2024, boosting buyer leverage in negotiations. Competitive auctions and PPAs force ORLEN to match price and contractual flexibility, while certification and guarantees of origin drive procurement decisions. ORLEN’s integrated generation and trading allow tailored bundled offers that blunt customer bargaining power.
- Green demand: buyers insist on guarantees of origin
- Price certainty: fixed-price PPAs and auctions increase leverage
- Market scale: >10 GW corporate PPA market (Europe, 2024)
- ORLEN strength: integrated generation + trading enables bespoke deals
Regulators as meta-buyers
Regulators act as meta-buyers for ORLEN, using excise taxes, price caps and strategic stock rules (EU 90-day oil stock mandate) to shape retail prices and margins; policy moves in 2022–24 showed how interventions can amplify buyer power in crises. Compliance costs and limits on pass-through compress profitability, forcing ORLEN to absorb higher input costs or reduce margins. Constructive engagement and transparent forecasting reduce the risk of abrupt regulatory shocks.
- Excise taxes reduce margin flexibility
- EU 90-day stock rule increases working capital
- Price caps amplify buyer leverage in crises
- Engagement and transparency mitigate sudden impacts
Retail price pressure: motorists switch across ~3,000 stations despite >9m loyalty
Customers exert strong price pressure: retail motorists switch easily across c.3,000 ORLEN stations (2024) despite Vitay loyalty >9m (2023); large B2B buyers push tender terms but aviation/industrial needs secure premiums; petrochemical converters face regional polymers demand ~46.7Mt (2023) reducing price power; power buyers drive green/fixed-price PPA demand >10GW (2024), and regulators (EU 90-day stock) constrain margins.
| Metric | Value |
|---|---|
| ORLEN service stations (2024) | ~3,000 |
| Vitay members (2023) | >9,000,000 |
| EU polymers demand (2023) | 46.7 Mt |
| Corporate PPA market (2024) | >10 GW |
| EU oil stock rule | 90 days |
Preview the Actual Deliverable
ORLEN Spolka Akcyjna Porter's Five Forces Analysis
This preview shows the exact ORLEN Spolka Akcyjna Porter’s Five Forces analysis you’ll receive upon purchase. It is the full, professionally formatted document—no placeholders or mockups—ready for immediate download and use. The content covers competitive rivalry, supplier and buyer power, threat of substitutes, and barriers to entry with actionable insights and supporting data.
Description
Go Beyond the Preview—Access the Full Strategic Report
ORLEN S.A. faces intense industry rivalry, moderate supplier power, evolving buyer preferences, measurable threat from substitutes (renewables) and regulatory-driven barriers to entry; these forces shape margins and strategic choices. This brief preview hints at vulnerabilities and advantages—unlock the full Porter's Five Forces Analysis for force-by-force ratings, visuals, and actionable strategy to inform investment or corporate decisions.
Suppliers Bargaining Power
Concentrated crude sources
Global crude is concentrated: OPEC+ supplied roughly 45% of oil in 2024 and national oil companies control about 80% of proved reserves, limiting ORLEN’s bargaining leverage. Sanctions and geopolitics have cut Russian crude flows to the EU to around 8% in 2024, narrowing Central European sourcing. Concentration drives price premia and tighter contract terms for reliability. ORLEN’s mix of seaborne, pipeline and regional buys partially mitigates supplier power.
Gas and power feedstock
Natural gas suppliers and power generators drive margins in ORLENs refining, petrochemical and CHP operations by setting feedstock costs and availability. Volatile hub prices and occasional capacity constraints force flexible operating schedules and compress margins during spikes. Long-term contracts and storage mitigate but do not remove exposure to spot swings. Upstream integration and active trading partially offset supplier power by securing supply and capturing margin.
Technology and catalyst licensors
Refining and petrochemical units at ORLEN depend on specialized licensors, catalysts and OEMs with few viable substitutes, giving suppliers notable leverage; catalyst qualification cycles typically run 6–18 months and switching can incur multimillion‑zloty costs. Performance guarantees and tight maintenance windows amplify dependence, as unplanned downtime can cost operators millions per day. ORLEN’s multi‑sourcing and in‑house optimization lower but do not eliminate this supplier power.
Transport and logistics nodes
Pipelines, terminals and railcar fleets act as chokepoints that give infrastructure operators leverage over ORLEN, especially where alternatives are limited; in 2024 ORLEN operated about 2,900 service stations, underscoring dependence on steady feedstock flows. Landlocked or chokepoint regions raise transport costs and reduce operational flexibility. Congestion or tariff hikes can compress refinery netbacks. Vertical integration into logistics has been used to mitigate exposure where feasible.
- Pipelines/terminals: bottleneck pricing risk
- Landlocked/chokepoints: higher costs, less flexibility
- Congestion/tariffs: compress netbacks
- Mitigation: vertical logistics integration
Renewables equipment and EPC
Renewables equipment and EPC for ORLEN face cyclical shortages with wind turbine lead times of 12–24 months and PV module backlogs of 6–12 months in 2024; policy-driven demand in Poland and EU has tightened supply, lifting equipment prices and warranty demands. Grid connection queues act as de facto supplier constraints, while strategic partnerships and framework agreements can mitigate exposure.
- turbines: 12–24m (2024)
- pv modules: 6–12m (2024)
- mitigation: framework agreements, strategic partnerships
OPEC+ 45%; NOCs 80% - feedstock, power volatility cut margins
Suppliers concentrated: OPEC+ ~45% supply (2024) and NOCs hold ~80% reserves, limiting ORLEN’s price leverage.
Feedstock and power volatility (hub spikes) compress margins despite long‑term contracts, storage and trading offsets.
Specialized catalysts, licensors and transport chokepoints (ORLEN ~2,900 stations) create switching costs; vertical logistics partially mitigates.
| Metric | 2024 |
|---|---|
| OPEC+ share | 45% |
| Russian crude to EU | 8% |
| ORLEN stations | 2,900 |
What is included in the product
Detailed Word Document
Tailored Porter's Five Forces analysis for ORLEN Spolka Akcyjna, uncovering competitive rivalry, supplier and buyer power, threat of new entrants and substitutes, and highlighting disruptive forces and market entry barriers that shape its pricing, profitability and strategic positioning.
Customizable Excel Spreadsheet
One-sheet Porter’s Five Forces for ORLEN S.A.—quickly visualize supplier, buyer, entrant, substitute and rivalry pressures with customizable scores and radar chart for scenario planning; clean, deck-ready layout with no complex setup so you can swap data to reflect regulatory or energy-market shifts.
Customers Bargaining Power
Price-sensitive retail motorists
Price-sensitive retail motorists switch easily among fuel stations due to high price transparency and a dense network; ORLEN operated c. 3,000 service stations across CEE in 2024, reinforcing easy substitution. Loyalty program Vitay (over 9 million members by 2023) and convenience retail reduce churn but do not eliminate price-driven switching. High fuel price volatility increases basket elasticity, while prime locations and ORLEN brand trust partially preserve margins.
Large B2B and wholesale
Large B2B and wholesale buyers—industrial clients, airlines and distributors—purchase in bulk and push aggressive terms; contracted volumes and tender-based procurement in 2024 shifted bargaining leverage toward buyers. Quality specifications and security-of-supply for aviation and industrial fuels allow ORLEN to command premiums. A diversified customer base and value-added services across ~2,900 service points in 2024 improve retention.
Petrochemical converters
European petrochemical converters face high supplier mobility across the EU, given a regional polymers demand of about 46.7 million tonnes (PlasticsEurope 2023), weakening ORLEN’s pricing leverage. Benchmark-linked contracts tied to naphtha/ethylene indices limit ORLEN’s ability to differentiate on price. Strong technical service, product specs and on-time supply can lock in volumes. ORLEN’s Central European proximity and logistics lower lead times versus seaborne suppliers.
Power and heat customers
Power and heat customers increasingly demand green attributes and fixed-price certainty, with European corporate PPA volumes surpassing 10 GW cumulatively by 2024, boosting buyer leverage in negotiations. Competitive auctions and PPAs force ORLEN to match price and contractual flexibility, while certification and guarantees of origin drive procurement decisions. ORLEN’s integrated generation and trading allow tailored bundled offers that blunt customer bargaining power.
- Green demand: buyers insist on guarantees of origin
- Price certainty: fixed-price PPAs and auctions increase leverage
- Market scale: >10 GW corporate PPA market (Europe, 2024)
- ORLEN strength: integrated generation + trading enables bespoke deals
Regulators as meta-buyers
Regulators act as meta-buyers for ORLEN, using excise taxes, price caps and strategic stock rules (EU 90-day oil stock mandate) to shape retail prices and margins; policy moves in 2022–24 showed how interventions can amplify buyer power in crises. Compliance costs and limits on pass-through compress profitability, forcing ORLEN to absorb higher input costs or reduce margins. Constructive engagement and transparent forecasting reduce the risk of abrupt regulatory shocks.
- Excise taxes reduce margin flexibility
- EU 90-day stock rule increases working capital
- Price caps amplify buyer leverage in crises
- Engagement and transparency mitigate sudden impacts
Retail price pressure: motorists switch across ~3,000 stations despite >9m loyalty
Customers exert strong price pressure: retail motorists switch easily across c.3,000 ORLEN stations (2024) despite Vitay loyalty >9m (2023); large B2B buyers push tender terms but aviation/industrial needs secure premiums; petrochemical converters face regional polymers demand ~46.7Mt (2023) reducing price power; power buyers drive green/fixed-price PPA demand >10GW (2024), and regulators (EU 90-day stock) constrain margins.
| Metric | Value |
|---|---|
| ORLEN service stations (2024) | ~3,000 |
| Vitay members (2023) | >9,000,000 |
| EU polymers demand (2023) | 46.7 Mt |
| Corporate PPA market (2024) | >10 GW |
| EU oil stock rule | 90 days |
Preview the Actual Deliverable
ORLEN Spolka Akcyjna Porter's Five Forces Analysis
This preview shows the exact ORLEN Spolka Akcyjna Porter’s Five Forces analysis you’ll receive upon purchase. It is the full, professionally formatted document—no placeholders or mockups—ready for immediate download and use. The content covers competitive rivalry, supplier and buyer power, threat of substitutes, and barriers to entry with actionable insights and supporting data.











