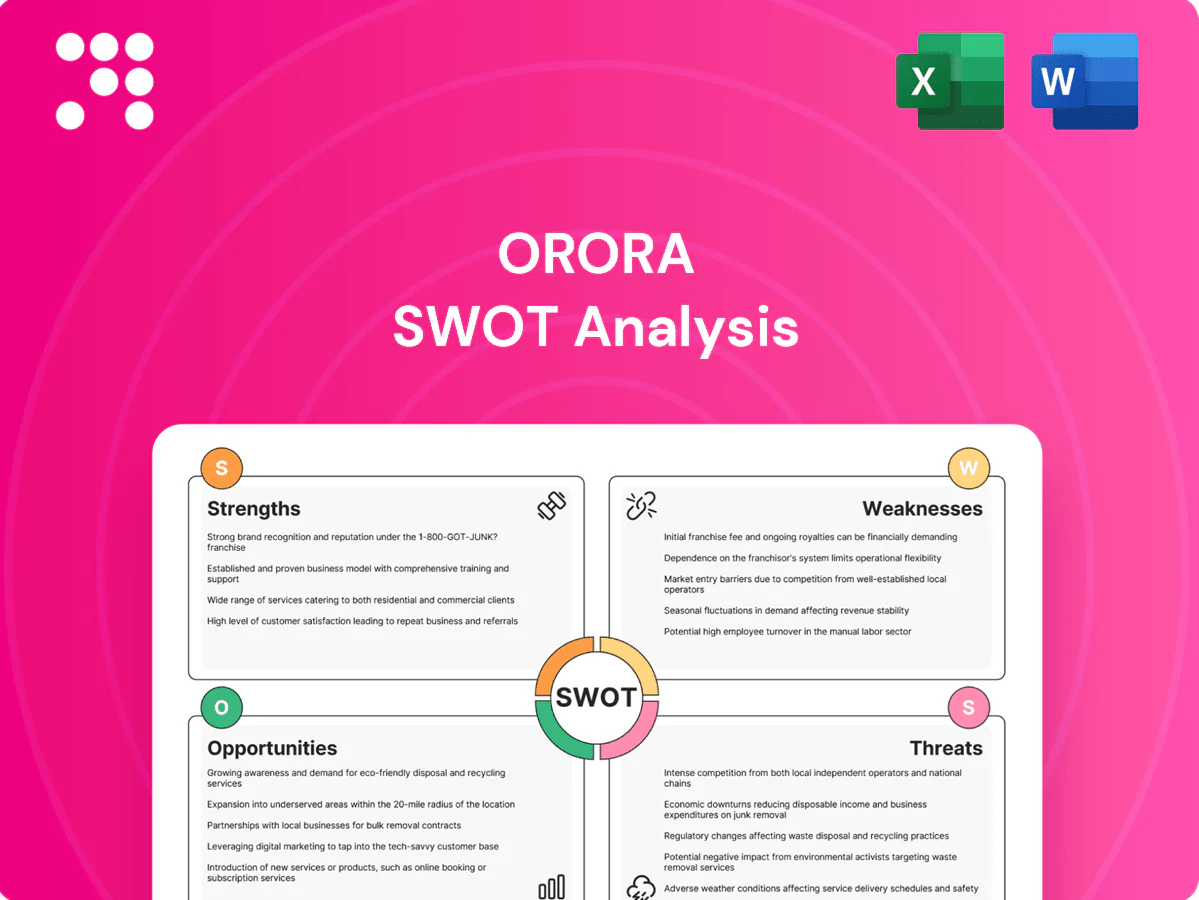
Orora SWOT Analysis

Dive Deeper Into the Company’s Strategic Blueprint
Orora's SWOT analysis highlights its strong packaging footprint, diversified customer base, and operational efficiencies, alongside exposure to commodity cycles and competitive pressures. Strategic opportunities in sustainable packaging and automation can drive growth. Want the full story? Purchase the complete SWOT for a research-backed, editable report and Excel matrix to plan and pitch with confidence.
Strengths

Diversified packaging portfolio
Orora spans paper, fibre, metal and glass, reducing dependence on any single substrate and supporting operations across multiple end-markets; in FY2024 revenue was about AUD 3.2 billion, reflecting broad-based demand. This diversification enables tailored solutions for food, beverage and industrial uses and creates cross-selling into multi-material programs. The mixed portfolio cushions demand swings in specific categories, smoothing cash flow and utilization.
Broad end-market exposure
Serving beverage, food, industrial and healthcare spreads revenue risk and supported Orora’s FY2024 revenue of AUD 3.3 billion, reducing reliance on any single category. Different cycles across these sectors help stabilize volumes and margins, smoothing quarterly variability. Portfolio breadth lets Orora pivot commercial focus as categories expand or slow, enhancing resilience in downturns.

Integrated displays & services
Point-of-purchase displays and print management extend Orora’s core packaging, capturing in-store influence where roughly 70% of purchase decisions occur. This one-stop offering deepens customer relationships and raises wallet share through bundled solutions. Service layers differentiate beyond price by adding design, logistics and rollout expertise. They also create recurring, project-based revenue and stronger customer stickiness.

Scale and entrenched relationships
Orora’s established footprint and long-term supply contracts (FY24 revenue ~A$2.9bn) give strong volume visibility, while scale drives procurement leverage and higher asset utilization across its network. Trusted relationships with major beverage and consumer brands underpin retention and upsell, and integration of packaging into customer operations increases switching costs.
- Long-term contracts
- Procurement leverage
- Efficient assets
- High switching costs
Sustainability and innovation focus
Orora's recyclable, lightweight formats align with Australia's 2025 National Packaging Targets and broader ESG mandates, easing customer compliance. Innovation in materials and design meets tightening regulations and brand sustainability goals, strengthening bids to blue-chip clients such as Coca-Cola Amatil. Continuous R&D underpins a premium product mix and margin protection.
- Recyclable alignment: 2025 National Packaging Targets
- Blue-chip traction: Coca-Cola Amatil
- R&D-led premium mix
Multi-material portfolio lifts revenue to A$3.2–3.3bn, raising resilience
Orora’s multi-material portfolio and services (paper, fibre, metal, glass, displays) drove FY2024 revenue ~A$3.2–3.3bn, diversifying end-markets and smoothing cash flow. Long-term contracts and scale deliver procurement leverage, high asset utilization and elevated switching costs with blue-chip clients. ESG-aligned recyclable formats meet Australia’s 2025 National Packaging Targets and support premium pricing and retention.
| Metric | Value |
|---|---|
| FY2024 revenue | A$3.2–3.3bn |
| In-store purchase influence | ~70% |
| Regulatory alignment | 2025 National Packaging Targets |
What is included in the product
 Detailed Word Document
Provides a strategic overview of Orora’s internal strengths and weaknesses while mapping external opportunities and threats shaping its packaging and manufacturing business; highlights competitive position, growth drivers, operational risks, and market challenges to inform strategic decision-making.

 Customizable Excel Spreadsheet
Delivers a clear SWOT matrix for Orora to quickly identify strengths, weaknesses, opportunities and threats, enabling faster strategic decisions and streamlined stakeholder communication.
Weaknesses

Commodity cost exposure
Orora faces pronounced commodity cost exposure as paper, glass, metals and resins exhibit significant price volatility that can compress margins when customer pass-through lags; the company uses hedging programs which mitigate but do not eliminate timing gaps. Energy-intensive manufacturing amplifies cost shocks and can exacerbate margin swings during commodity or fuel price spikes. Operational flexibility and pricing cadence are therefore critical to protect profitability.
Capital- and energy-intensive assets
Glass furnaces and converting lines require heavy capex—new furnace projects typically cost US$200–400m—pressuring Orora, which reported ~A$3.0bn revenue in FY24. Long maintenance cycles and downtime risk utilization drag, with major shutdowns cutting throughput for weeks. High fixed costs squeeze margins at lower volumes; energy price swings (energy can be ~20% of glass plant operating costs) add earnings variability.

Operational complexity
Managing multi-material plants, diverse SKUs and services elevates execution risk for Orora, which operates across Australia, New Zealand and North America. Complexity inflates overheads and slows decision-making, particularly when coordinating displays, print and packaging operations. As scale grows, the probability of quality lapses and late deliveries increases, raising operational and customer-retention risks.

Geographic concentration
Cyclical end-market dependence
Cyclical end-market dependence leaves Orora exposed when beverage and other discretionary categories soften in downturns, reducing demand for cans, displays and print. Shifts in promotional activity directly lower display and print volumes, while brand-led inventory destocking can cause abrupt short-term order declines. High fixed costs make volume sensitivity translate into margin pressure.
- beverage and discretionary exposure
- promo shifts cut display/print
- brand destocking risks
- fixed-cost leverage vulnerability
Commodity, energy and capex exposure trim margins; ANZ/NA focus raises FX-linked EPS volatility
Orora faces high commodity and energy exposure that can compress margins; FY24 revenue ~A$3.0bn and glass plant energy can be ~20% of operating costs. Heavy capex requirements (new glass furnaces US$200–400m) and long maintenance cycles raise utilization and fixed‑cost risk. Geographic concentration in ANZ and North America limits EM upside and drives FX‑linked EPS volatility.
| Metric | Value |
|---|---|
| FY24 revenue | A$3.0bn |
| Glass furnace capex | US$200–400m |
| Energy share (glass plants) | ~20% |
| Geographic focus | ANZ + North America |
Preview Before You Purchase
Orora SWOT Analysis
This is the actual Orora SWOT analysis document you’ll receive upon purchase—no surprises, just professional quality. The preview below is taken directly from the full report; purchasing unlocks the complete, editable version with in-depth strengths, weaknesses, opportunities and threats. You’re viewing the live file; the entire document is available immediately after checkout.

Dive Deeper Into the Company’s Strategic Blueprint
Orora's SWOT analysis highlights its strong packaging footprint, diversified customer base, and operational efficiencies, alongside exposure to commodity cycles and competitive pressures. Strategic opportunities in sustainable packaging and automation can drive growth. Want the full story? Purchase the complete SWOT for a research-backed, editable report and Excel matrix to plan and pitch with confidence.
Strengths
Diversified packaging portfolio
Orora spans paper, fibre, metal and glass, reducing dependence on any single substrate and supporting operations across multiple end-markets; in FY2024 revenue was about AUD 3.2 billion, reflecting broad-based demand. This diversification enables tailored solutions for food, beverage and industrial uses and creates cross-selling into multi-material programs. The mixed portfolio cushions demand swings in specific categories, smoothing cash flow and utilization.
Broad end-market exposure
Serving beverage, food, industrial and healthcare spreads revenue risk and supported Orora’s FY2024 revenue of AUD 3.3 billion, reducing reliance on any single category. Different cycles across these sectors help stabilize volumes and margins, smoothing quarterly variability. Portfolio breadth lets Orora pivot commercial focus as categories expand or slow, enhancing resilience in downturns.
Integrated displays & services
Point-of-purchase displays and print management extend Orora’s core packaging, capturing in-store influence where roughly 70% of purchase decisions occur. This one-stop offering deepens customer relationships and raises wallet share through bundled solutions. Service layers differentiate beyond price by adding design, logistics and rollout expertise. They also create recurring, project-based revenue and stronger customer stickiness.
Scale and entrenched relationships
Orora’s established footprint and long-term supply contracts (FY24 revenue ~A$2.9bn) give strong volume visibility, while scale drives procurement leverage and higher asset utilization across its network. Trusted relationships with major beverage and consumer brands underpin retention and upsell, and integration of packaging into customer operations increases switching costs.
- Long-term contracts
- Procurement leverage
- Efficient assets
- High switching costs
Sustainability and innovation focus
Orora's recyclable, lightweight formats align with Australia's 2025 National Packaging Targets and broader ESG mandates, easing customer compliance. Innovation in materials and design meets tightening regulations and brand sustainability goals, strengthening bids to blue-chip clients such as Coca-Cola Amatil. Continuous R&D underpins a premium product mix and margin protection.
- Recyclable alignment: 2025 National Packaging Targets
- Blue-chip traction: Coca-Cola Amatil
- R&D-led premium mix
Multi-material portfolio lifts revenue to A$3.2–3.3bn, raising resilience
Orora’s multi-material portfolio and services (paper, fibre, metal, glass, displays) drove FY2024 revenue ~A$3.2–3.3bn, diversifying end-markets and smoothing cash flow. Long-term contracts and scale deliver procurement leverage, high asset utilization and elevated switching costs with blue-chip clients. ESG-aligned recyclable formats meet Australia’s 2025 National Packaging Targets and support premium pricing and retention.
| Metric | Value |
|---|---|
| FY2024 revenue | A$3.2–3.3bn |
| In-store purchase influence | ~70% |
| Regulatory alignment | 2025 National Packaging Targets |
What is included in the product
Detailed Word Document
Provides a strategic overview of Orora’s internal strengths and weaknesses while mapping external opportunities and threats shaping its packaging and manufacturing business; highlights competitive position, growth drivers, operational risks, and market challenges to inform strategic decision-making.
Customizable Excel Spreadsheet
Delivers a clear SWOT matrix for Orora to quickly identify strengths, weaknesses, opportunities and threats, enabling faster strategic decisions and streamlined stakeholder communication.
Weaknesses
Commodity cost exposure
Orora faces pronounced commodity cost exposure as paper, glass, metals and resins exhibit significant price volatility that can compress margins when customer pass-through lags; the company uses hedging programs which mitigate but do not eliminate timing gaps. Energy-intensive manufacturing amplifies cost shocks and can exacerbate margin swings during commodity or fuel price spikes. Operational flexibility and pricing cadence are therefore critical to protect profitability.
Capital- and energy-intensive assets
Glass furnaces and converting lines require heavy capex—new furnace projects typically cost US$200–400m—pressuring Orora, which reported ~A$3.0bn revenue in FY24. Long maintenance cycles and downtime risk utilization drag, with major shutdowns cutting throughput for weeks. High fixed costs squeeze margins at lower volumes; energy price swings (energy can be ~20% of glass plant operating costs) add earnings variability.
Operational complexity
Managing multi-material plants, diverse SKUs and services elevates execution risk for Orora, which operates across Australia, New Zealand and North America. Complexity inflates overheads and slows decision-making, particularly when coordinating displays, print and packaging operations. As scale grows, the probability of quality lapses and late deliveries increases, raising operational and customer-retention risks.
Geographic concentration
Cyclical end-market dependence
Cyclical end-market dependence leaves Orora exposed when beverage and other discretionary categories soften in downturns, reducing demand for cans, displays and print. Shifts in promotional activity directly lower display and print volumes, while brand-led inventory destocking can cause abrupt short-term order declines. High fixed costs make volume sensitivity translate into margin pressure.
- beverage and discretionary exposure
- promo shifts cut display/print
- brand destocking risks
- fixed-cost leverage vulnerability
Commodity, energy and capex exposure trim margins; ANZ/NA focus raises FX-linked EPS volatility
Orora faces high commodity and energy exposure that can compress margins; FY24 revenue ~A$3.0bn and glass plant energy can be ~20% of operating costs. Heavy capex requirements (new glass furnaces US$200–400m) and long maintenance cycles raise utilization and fixed‑cost risk. Geographic concentration in ANZ and North America limits EM upside and drives FX‑linked EPS volatility.
| Metric | Value |
|---|---|
| FY24 revenue | A$3.0bn |
| Glass furnace capex | US$200–400m |
| Energy share (glass plants) | ~20% |
| Geographic focus | ANZ + North America |
Preview Before You Purchase
Orora SWOT Analysis
This is the actual Orora SWOT analysis document you’ll receive upon purchase—no surprises, just professional quality. The preview below is taken directly from the full report; purchasing unlocks the complete, editable version with in-depth strengths, weaknesses, opportunities and threats. You’re viewing the live file; the entire document is available immediately after checkout.
Original: $10.00
-65%$10.00
$3.50Description
Dive Deeper Into the Company’s Strategic Blueprint
Orora's SWOT analysis highlights its strong packaging footprint, diversified customer base, and operational efficiencies, alongside exposure to commodity cycles and competitive pressures. Strategic opportunities in sustainable packaging and automation can drive growth. Want the full story? Purchase the complete SWOT for a research-backed, editable report and Excel matrix to plan and pitch with confidence.
Strengths
Diversified packaging portfolio
Orora spans paper, fibre, metal and glass, reducing dependence on any single substrate and supporting operations across multiple end-markets; in FY2024 revenue was about AUD 3.2 billion, reflecting broad-based demand. This diversification enables tailored solutions for food, beverage and industrial uses and creates cross-selling into multi-material programs. The mixed portfolio cushions demand swings in specific categories, smoothing cash flow and utilization.
Broad end-market exposure
Serving beverage, food, industrial and healthcare spreads revenue risk and supported Orora’s FY2024 revenue of AUD 3.3 billion, reducing reliance on any single category. Different cycles across these sectors help stabilize volumes and margins, smoothing quarterly variability. Portfolio breadth lets Orora pivot commercial focus as categories expand or slow, enhancing resilience in downturns.
Integrated displays & services
Point-of-purchase displays and print management extend Orora’s core packaging, capturing in-store influence where roughly 70% of purchase decisions occur. This one-stop offering deepens customer relationships and raises wallet share through bundled solutions. Service layers differentiate beyond price by adding design, logistics and rollout expertise. They also create recurring, project-based revenue and stronger customer stickiness.
Scale and entrenched relationships
Orora’s established footprint and long-term supply contracts (FY24 revenue ~A$2.9bn) give strong volume visibility, while scale drives procurement leverage and higher asset utilization across its network. Trusted relationships with major beverage and consumer brands underpin retention and upsell, and integration of packaging into customer operations increases switching costs.
- Long-term contracts
- Procurement leverage
- Efficient assets
- High switching costs
Sustainability and innovation focus
Orora's recyclable, lightweight formats align with Australia's 2025 National Packaging Targets and broader ESG mandates, easing customer compliance. Innovation in materials and design meets tightening regulations and brand sustainability goals, strengthening bids to blue-chip clients such as Coca-Cola Amatil. Continuous R&D underpins a premium product mix and margin protection.
- Recyclable alignment: 2025 National Packaging Targets
- Blue-chip traction: Coca-Cola Amatil
- R&D-led premium mix
Multi-material portfolio lifts revenue to A$3.2–3.3bn, raising resilience
Orora’s multi-material portfolio and services (paper, fibre, metal, glass, displays) drove FY2024 revenue ~A$3.2–3.3bn, diversifying end-markets and smoothing cash flow. Long-term contracts and scale deliver procurement leverage, high asset utilization and elevated switching costs with blue-chip clients. ESG-aligned recyclable formats meet Australia’s 2025 National Packaging Targets and support premium pricing and retention.
| Metric | Value |
|---|---|
| FY2024 revenue | A$3.2–3.3bn |
| In-store purchase influence | ~70% |
| Regulatory alignment | 2025 National Packaging Targets |
What is included in the product
Detailed Word Document
Provides a strategic overview of Orora’s internal strengths and weaknesses while mapping external opportunities and threats shaping its packaging and manufacturing business; highlights competitive position, growth drivers, operational risks, and market challenges to inform strategic decision-making.
Customizable Excel Spreadsheet
Delivers a clear SWOT matrix for Orora to quickly identify strengths, weaknesses, opportunities and threats, enabling faster strategic decisions and streamlined stakeholder communication.
Weaknesses
Commodity cost exposure
Orora faces pronounced commodity cost exposure as paper, glass, metals and resins exhibit significant price volatility that can compress margins when customer pass-through lags; the company uses hedging programs which mitigate but do not eliminate timing gaps. Energy-intensive manufacturing amplifies cost shocks and can exacerbate margin swings during commodity or fuel price spikes. Operational flexibility and pricing cadence are therefore critical to protect profitability.
Capital- and energy-intensive assets
Glass furnaces and converting lines require heavy capex—new furnace projects typically cost US$200–400m—pressuring Orora, which reported ~A$3.0bn revenue in FY24. Long maintenance cycles and downtime risk utilization drag, with major shutdowns cutting throughput for weeks. High fixed costs squeeze margins at lower volumes; energy price swings (energy can be ~20% of glass plant operating costs) add earnings variability.
Operational complexity
Managing multi-material plants, diverse SKUs and services elevates execution risk for Orora, which operates across Australia, New Zealand and North America. Complexity inflates overheads and slows decision-making, particularly when coordinating displays, print and packaging operations. As scale grows, the probability of quality lapses and late deliveries increases, raising operational and customer-retention risks.
Geographic concentration
Cyclical end-market dependence
Cyclical end-market dependence leaves Orora exposed when beverage and other discretionary categories soften in downturns, reducing demand for cans, displays and print. Shifts in promotional activity directly lower display and print volumes, while brand-led inventory destocking can cause abrupt short-term order declines. High fixed costs make volume sensitivity translate into margin pressure.
- beverage and discretionary exposure
- promo shifts cut display/print
- brand destocking risks
- fixed-cost leverage vulnerability
Commodity, energy and capex exposure trim margins; ANZ/NA focus raises FX-linked EPS volatility
Orora faces high commodity and energy exposure that can compress margins; FY24 revenue ~A$3.0bn and glass plant energy can be ~20% of operating costs. Heavy capex requirements (new glass furnaces US$200–400m) and long maintenance cycles raise utilization and fixed‑cost risk. Geographic concentration in ANZ and North America limits EM upside and drives FX‑linked EPS volatility.
| Metric | Value |
|---|---|
| FY24 revenue | A$3.0bn |
| Glass furnace capex | US$200–400m |
| Energy share (glass plants) | ~20% |
| Geographic focus | ANZ + North America |
Preview Before You Purchase
Orora SWOT Analysis
This is the actual Orora SWOT analysis document you’ll receive upon purchase—no surprises, just professional quality. The preview below is taken directly from the full report; purchasing unlocks the complete, editable version with in-depth strengths, weaknesses, opportunities and threats. You’re viewing the live file; the entire document is available immediately after checkout.











