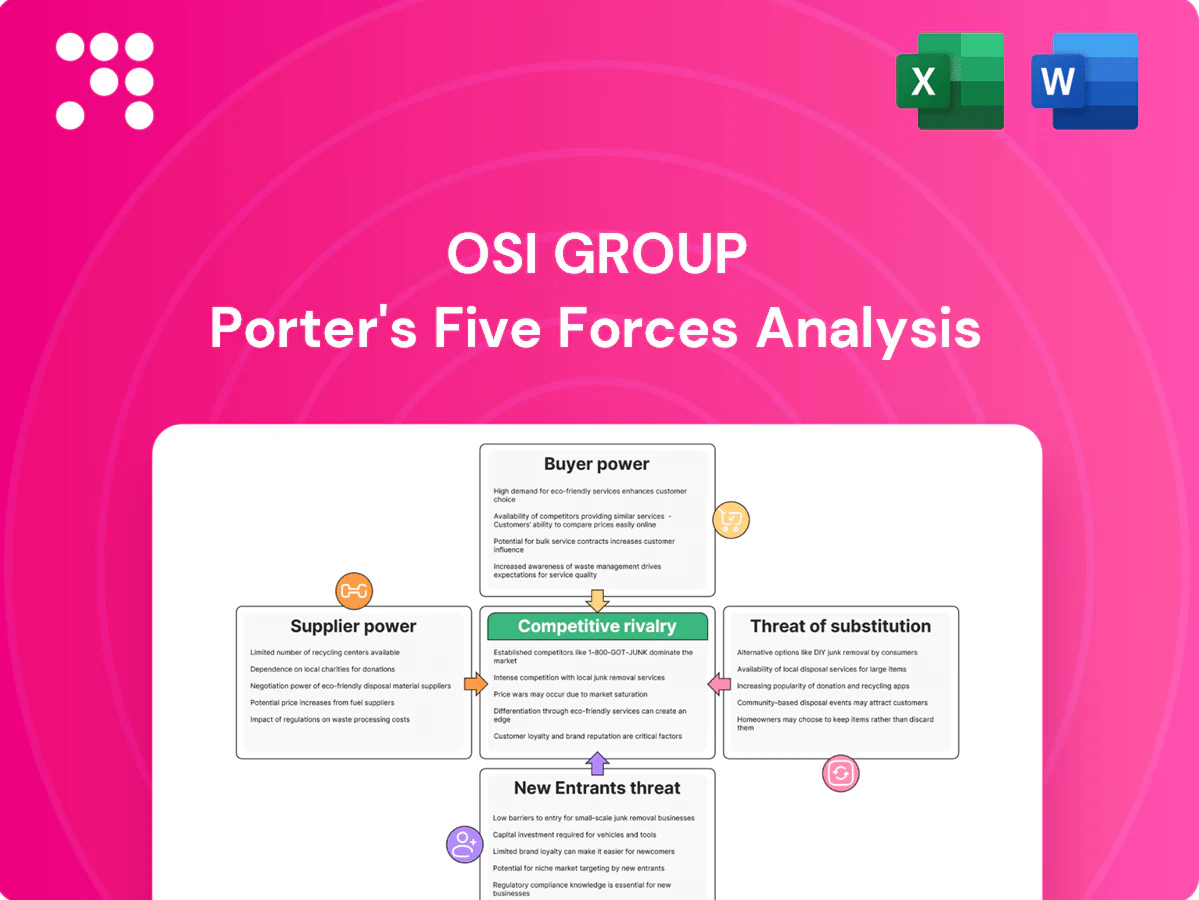
OSI Group Porter's Five Forces Analysis

Elevate Your Analysis with the Complete Porter's Five Forces Analysis
OSI Group's Porter's Five Forces snapshot highlights supplier concentration, buyer bargaining, and competitive rivalry in global food processing, revealing pressures on margins and scale advantages. This brief overview teases strategic risks and opportunities. The full report quantifies each force and maps implications for growth. Unlock the complete analysis for actionable, consultant-grade insights.
Suppliers Bargaining Power

Concentrated livestock sources
Protein inputs such as beef, pork and poultry are regionally concentrated—Brazil and the US together account for roughly 40% of global beef and 35% of poultry exports in 2024—giving large suppliers pricing leverage. Disease shocks like African swine fever, which cut China’s hog herd ~40% in 2019–20, can tighten supply and spike prices. OSI, operating in ~17 countries with 65+ facilities, mitigates risk by multi-sourcing across geographies and species, and long-term contracts soften but do not remove episodic supplier power.
Commodity and feed cost volatility
Input prices for OSI are tied to grain and energy cycles; corn futures averaged about $5.60/bu and Brent crude roughly $86/bbl in 2024, and suppliers typically pass those moves through. Sudden spikes compress processing margins unless contracts include indexed pricing. OSI uses hedging and formula pricing to stabilize costs, but timing mismatches can temporarily shift bargaining power to suppliers.

Quality and safety requirements
Stringent food safety, traceability and animal welfare standards (OSI conducts audits of over 1,000 supplier sites annually) narrow the eligible supplier pool, increasing supplier bargaining power. Fewer compliant suppliers can command better terms, pressuring margins despite OSI’s scale (OSI reported ~22,000 employees and revenue north of $8.5 billion in 2024). Rigorous specs reduce risk but heighten dependency; co-investment in quality programs is used to trade price for reliability.

Switching costs and dual-sourcing
Qualifying new protein suppliers typically requires 3–9 months of audits, trials and customer approvals with estimated upfront costs of $50k–150k per supplier, creating meaningful time and cost friction for OSI. OSI mitigates supplier power by dual-sourcing critical inputs (covering >60% of key SKUs), maintaining approved vendor lists, enforcing contractual service levels and holding 4–6 weeks of buffer inventory. Rapid switches under shocks can still increase procurement costs by 10–30%.
- 3–9 months: typical qualification timeline
- $50k–150k: estimated supplier onboarding cost
- >60%: dual-sourced critical SKU coverage
- 4–6 weeks: buffer inventory held
- 10–30%: cost uplift during rapid switches
ESG and regulatory pressures upstream
- Compliance cost increase: 5–12%
- Premiums for certified supply: 10–25%
- OSI ESG limits alternative sourcing
- Collaboration expands compliant supply long term
Regional supplier leverage vs processor scale: episodic risk from corn and oil
Large regional suppliers (Brazil+US ≈40% beef, ≈35% poultry exports in 2024) and input-price pass-through (corn ~$5.60/bu; Brent ~$86/bbl in 2024) give suppliers episodic leverage; OSI’s scale (revenue >$8.5B; ~22,000 employees) plus multi-sourcing (>60% key SKUs), 4–6 weeks buffer and audits (>1,000 sites) mitigate but don’t eliminate power.
| Metric | Value (2024) |
|---|---|
| Beef+Poultry export share | Brazil+US ≈40% / ≈35% |
| Corn / Brent | $5.60/bu / $86/bbl |
| OSI revenue / employees | >$8.5B / ~22,000 |
| Dual-sourced / buffer | >60% / 4–6 wks |
| Onboard cost / time | $50k–150k / 3–9 months |
| Supplier premiums / compliance | 10–25% / +5–12% |
What is included in the product
 Detailed Word Document
Uncovers key drivers of competition, customer influence, and market entry risks tailored to OSI Group; evaluates supplier and buyer power, substitutes, and rivalry to highlight pricing and profitability pressures. Identifies disruptive threats and barriers protecting incumbency, with strategic commentary for investor, internal, and academic use.

 Customizable Excel Spreadsheet
A clear, one-sheet Porter's Five Forces snapshot for OSI Group—perfect for quick strategic decisions, investor briefings, and prioritizing actions to relieve competitive pressure.
Customers Bargaining Power

Large QSR and retail chains
Large QSR and retail chains buy at scale and negotiate aggressively; McDonald's alone operated about 39,000 restaurants worldwide in 2024, amplifying buyer leverage. Consolidated volumes and multi-year bids, commonly 3–5 years, put downward pressure on pricing and terms. OSI preserves value through product customization, supply reliability and co-innovation. Performance-based contracts link pricing to SLAs, balancing margin with volume security.
Private label price sensitivity
Private label customers prioritize cost leadership with frequent re-tenders, increasing buyer leverage as small product differentiation makes suppliers directly comparable. In Europe private label penetration exceeded 20% in 2024, amplifying price sensitivity. OSI mitigates this through process efficiency and complex specifications that are hard to replicate, and by offering value-added formats that shift buyer focus from unit price to total cost of ownership.

Low switching barriers among processors
Qualified buyers can reallocate volumes to alternative co-packers after short trials, especially for standardized SKUs that heighten substitutability and buyer leverage. OSI raises exit costs via proprietary recipes and integrated logistics and operates around 65 facilities globally (2024), which deepens operational ties. High service levels and tailored logistics reduce incentives to switch for marginal savings.

Customization as soft lock-in
Co-developed products, proprietary formulations and tailored processes bind OSI into customers’ menus and supply chains; changeovers require requalification, marketing relaunches and operational retraining that typically take 3–6 months and disrupt throughput. These frictions reduce buyer leverage even at scale, and joint innovation roadmaps—often tied to 3–5 year supply agreements—deepen supplier stickiness.
- Co-developed IP locks supply
- 3–6 month requalification window
- 3–5 year roadmap/contracts
Rebates, penalties, and SLAs
Buyers impose rebates, on-time fill and quality penalties that shift risk upstream, with industry-standard on-time-fill SLAs often set at 95%+, and buyer deductions commonly running 1–3% of invoice value. Tight SLAs can compress margins by hundreds of basis points during volatility. OSI’s forecasting and operational excellence reduce deductions and enable negotiation of fairer terms. Transparent KPIs support gradual SLA relaxation and cost recovery.
- Rebates/penalties: 1–3% typical
- On-time-fill SLA: 95%+ target
- Margin impact: hundreds of bps in volatility
- OSI levers: forecasting, ops, KPIs
Scale QSR buyers v supplier lock-in: 65 sites, 95%+ SLA
Large QSR/retail buyers (e.g., McDonald's ~39,000 restaurants in 2024) exert strong price leverage via scale and multi-year bids; private label >20% in Europe (2024) raises price sensitivity. OSI offsets pressure through customization, 65 global facilities (2024), co-developed IP and SLAs (on-time-fill 95%+, rebates 1–3%), making switching costly and reducing effective buyer power.
| Metric | 2024 Value |
|---|---|
| McDonald's locations | ~39,000 |
| Private label EU share | >20% |
| OSI facilities | ~65 |
| On-time-fill SLA | 95%+ |
| Typical rebates/penalties | 1–3% |
Preview the Actual Deliverable
OSI Group Porter's Five Forces Analysis
This preview shows the exact Porter’s Five Forces analysis of OSI Group you’ll receive after purchase—fully formatted and professionally written, with no placeholders. It evaluates supplier power, buyer power, competitive rivalry, threat of substitution, and barriers to entry, with actionable insights. Downloadable immediately upon payment; the file you see here is the file you’ll get.

Elevate Your Analysis with the Complete Porter's Five Forces Analysis
OSI Group's Porter's Five Forces snapshot highlights supplier concentration, buyer bargaining, and competitive rivalry in global food processing, revealing pressures on margins and scale advantages. This brief overview teases strategic risks and opportunities. The full report quantifies each force and maps implications for growth. Unlock the complete analysis for actionable, consultant-grade insights.
Suppliers Bargaining Power
Concentrated livestock sources
Protein inputs such as beef, pork and poultry are regionally concentrated—Brazil and the US together account for roughly 40% of global beef and 35% of poultry exports in 2024—giving large suppliers pricing leverage. Disease shocks like African swine fever, which cut China’s hog herd ~40% in 2019–20, can tighten supply and spike prices. OSI, operating in ~17 countries with 65+ facilities, mitigates risk by multi-sourcing across geographies and species, and long-term contracts soften but do not remove episodic supplier power.
Commodity and feed cost volatility
Input prices for OSI are tied to grain and energy cycles; corn futures averaged about $5.60/bu and Brent crude roughly $86/bbl in 2024, and suppliers typically pass those moves through. Sudden spikes compress processing margins unless contracts include indexed pricing. OSI uses hedging and formula pricing to stabilize costs, but timing mismatches can temporarily shift bargaining power to suppliers.
Quality and safety requirements
Stringent food safety, traceability and animal welfare standards (OSI conducts audits of over 1,000 supplier sites annually) narrow the eligible supplier pool, increasing supplier bargaining power. Fewer compliant suppliers can command better terms, pressuring margins despite OSI’s scale (OSI reported ~22,000 employees and revenue north of $8.5 billion in 2024). Rigorous specs reduce risk but heighten dependency; co-investment in quality programs is used to trade price for reliability.
Switching costs and dual-sourcing
Qualifying new protein suppliers typically requires 3–9 months of audits, trials and customer approvals with estimated upfront costs of $50k–150k per supplier, creating meaningful time and cost friction for OSI. OSI mitigates supplier power by dual-sourcing critical inputs (covering >60% of key SKUs), maintaining approved vendor lists, enforcing contractual service levels and holding 4–6 weeks of buffer inventory. Rapid switches under shocks can still increase procurement costs by 10–30%.
- 3–9 months: typical qualification timeline
- $50k–150k: estimated supplier onboarding cost
- >60%: dual-sourced critical SKU coverage
- 4–6 weeks: buffer inventory held
- 10–30%: cost uplift during rapid switches
ESG and regulatory pressures upstream
- Compliance cost increase: 5–12%
- Premiums for certified supply: 10–25%
- OSI ESG limits alternative sourcing
- Collaboration expands compliant supply long term
Regional supplier leverage vs processor scale: episodic risk from corn and oil
Large regional suppliers (Brazil+US ≈40% beef, ≈35% poultry exports in 2024) and input-price pass-through (corn ~$5.60/bu; Brent ~$86/bbl in 2024) give suppliers episodic leverage; OSI’s scale (revenue >$8.5B; ~22,000 employees) plus multi-sourcing (>60% key SKUs), 4–6 weeks buffer and audits (>1,000 sites) mitigate but don’t eliminate power.
| Metric | Value (2024) |
|---|---|
| Beef+Poultry export share | Brazil+US ≈40% / ≈35% |
| Corn / Brent | $5.60/bu / $86/bbl |
| OSI revenue / employees | >$8.5B / ~22,000 |
| Dual-sourced / buffer | >60% / 4–6 wks |
| Onboard cost / time | $50k–150k / 3–9 months |
| Supplier premiums / compliance | 10–25% / +5–12% |
What is included in the product
Detailed Word Document
Uncovers key drivers of competition, customer influence, and market entry risks tailored to OSI Group; evaluates supplier and buyer power, substitutes, and rivalry to highlight pricing and profitability pressures. Identifies disruptive threats and barriers protecting incumbency, with strategic commentary for investor, internal, and academic use.
Customizable Excel Spreadsheet
A clear, one-sheet Porter's Five Forces snapshot for OSI Group—perfect for quick strategic decisions, investor briefings, and prioritizing actions to relieve competitive pressure.
Customers Bargaining Power
Large QSR and retail chains
Large QSR and retail chains buy at scale and negotiate aggressively; McDonald's alone operated about 39,000 restaurants worldwide in 2024, amplifying buyer leverage. Consolidated volumes and multi-year bids, commonly 3–5 years, put downward pressure on pricing and terms. OSI preserves value through product customization, supply reliability and co-innovation. Performance-based contracts link pricing to SLAs, balancing margin with volume security.
Private label price sensitivity
Private label customers prioritize cost leadership with frequent re-tenders, increasing buyer leverage as small product differentiation makes suppliers directly comparable. In Europe private label penetration exceeded 20% in 2024, amplifying price sensitivity. OSI mitigates this through process efficiency and complex specifications that are hard to replicate, and by offering value-added formats that shift buyer focus from unit price to total cost of ownership.
Low switching barriers among processors
Qualified buyers can reallocate volumes to alternative co-packers after short trials, especially for standardized SKUs that heighten substitutability and buyer leverage. OSI raises exit costs via proprietary recipes and integrated logistics and operates around 65 facilities globally (2024), which deepens operational ties. High service levels and tailored logistics reduce incentives to switch for marginal savings.
Customization as soft lock-in
Co-developed products, proprietary formulations and tailored processes bind OSI into customers’ menus and supply chains; changeovers require requalification, marketing relaunches and operational retraining that typically take 3–6 months and disrupt throughput. These frictions reduce buyer leverage even at scale, and joint innovation roadmaps—often tied to 3–5 year supply agreements—deepen supplier stickiness.
- Co-developed IP locks supply
- 3–6 month requalification window
- 3–5 year roadmap/contracts
Rebates, penalties, and SLAs
Buyers impose rebates, on-time fill and quality penalties that shift risk upstream, with industry-standard on-time-fill SLAs often set at 95%+, and buyer deductions commonly running 1–3% of invoice value. Tight SLAs can compress margins by hundreds of basis points during volatility. OSI’s forecasting and operational excellence reduce deductions and enable negotiation of fairer terms. Transparent KPIs support gradual SLA relaxation and cost recovery.
- Rebates/penalties: 1–3% typical
- On-time-fill SLA: 95%+ target
- Margin impact: hundreds of bps in volatility
- OSI levers: forecasting, ops, KPIs
Scale QSR buyers v supplier lock-in: 65 sites, 95%+ SLA
Large QSR/retail buyers (e.g., McDonald's ~39,000 restaurants in 2024) exert strong price leverage via scale and multi-year bids; private label >20% in Europe (2024) raises price sensitivity. OSI offsets pressure through customization, 65 global facilities (2024), co-developed IP and SLAs (on-time-fill 95%+, rebates 1–3%), making switching costly and reducing effective buyer power.
| Metric | 2024 Value |
|---|---|
| McDonald's locations | ~39,000 |
| Private label EU share | >20% |
| OSI facilities | ~65 |
| On-time-fill SLA | 95%+ |
| Typical rebates/penalties | 1–3% |
Preview the Actual Deliverable
OSI Group Porter's Five Forces Analysis
This preview shows the exact Porter’s Five Forces analysis of OSI Group you’ll receive after purchase—fully formatted and professionally written, with no placeholders. It evaluates supplier power, buyer power, competitive rivalry, threat of substitution, and barriers to entry, with actionable insights. Downloadable immediately upon payment; the file you see here is the file you’ll get.
Original: $10.00
-65%$10.00
$3.50Description
Elevate Your Analysis with the Complete Porter's Five Forces Analysis
OSI Group's Porter's Five Forces snapshot highlights supplier concentration, buyer bargaining, and competitive rivalry in global food processing, revealing pressures on margins and scale advantages. This brief overview teases strategic risks and opportunities. The full report quantifies each force and maps implications for growth. Unlock the complete analysis for actionable, consultant-grade insights.
Suppliers Bargaining Power
Concentrated livestock sources
Protein inputs such as beef, pork and poultry are regionally concentrated—Brazil and the US together account for roughly 40% of global beef and 35% of poultry exports in 2024—giving large suppliers pricing leverage. Disease shocks like African swine fever, which cut China’s hog herd ~40% in 2019–20, can tighten supply and spike prices. OSI, operating in ~17 countries with 65+ facilities, mitigates risk by multi-sourcing across geographies and species, and long-term contracts soften but do not remove episodic supplier power.
Commodity and feed cost volatility
Input prices for OSI are tied to grain and energy cycles; corn futures averaged about $5.60/bu and Brent crude roughly $86/bbl in 2024, and suppliers typically pass those moves through. Sudden spikes compress processing margins unless contracts include indexed pricing. OSI uses hedging and formula pricing to stabilize costs, but timing mismatches can temporarily shift bargaining power to suppliers.
Quality and safety requirements
Stringent food safety, traceability and animal welfare standards (OSI conducts audits of over 1,000 supplier sites annually) narrow the eligible supplier pool, increasing supplier bargaining power. Fewer compliant suppliers can command better terms, pressuring margins despite OSI’s scale (OSI reported ~22,000 employees and revenue north of $8.5 billion in 2024). Rigorous specs reduce risk but heighten dependency; co-investment in quality programs is used to trade price for reliability.
Switching costs and dual-sourcing
Qualifying new protein suppliers typically requires 3–9 months of audits, trials and customer approvals with estimated upfront costs of $50k–150k per supplier, creating meaningful time and cost friction for OSI. OSI mitigates supplier power by dual-sourcing critical inputs (covering >60% of key SKUs), maintaining approved vendor lists, enforcing contractual service levels and holding 4–6 weeks of buffer inventory. Rapid switches under shocks can still increase procurement costs by 10–30%.
- 3–9 months: typical qualification timeline
- $50k–150k: estimated supplier onboarding cost
- >60%: dual-sourced critical SKU coverage
- 4–6 weeks: buffer inventory held
- 10–30%: cost uplift during rapid switches
ESG and regulatory pressures upstream
- Compliance cost increase: 5–12%
- Premiums for certified supply: 10–25%
- OSI ESG limits alternative sourcing
- Collaboration expands compliant supply long term
Regional supplier leverage vs processor scale: episodic risk from corn and oil
Large regional suppliers (Brazil+US ≈40% beef, ≈35% poultry exports in 2024) and input-price pass-through (corn ~$5.60/bu; Brent ~$86/bbl in 2024) give suppliers episodic leverage; OSI’s scale (revenue >$8.5B; ~22,000 employees) plus multi-sourcing (>60% key SKUs), 4–6 weeks buffer and audits (>1,000 sites) mitigate but don’t eliminate power.
| Metric | Value (2024) |
|---|---|
| Beef+Poultry export share | Brazil+US ≈40% / ≈35% |
| Corn / Brent | $5.60/bu / $86/bbl |
| OSI revenue / employees | >$8.5B / ~22,000 |
| Dual-sourced / buffer | >60% / 4–6 wks |
| Onboard cost / time | $50k–150k / 3–9 months |
| Supplier premiums / compliance | 10–25% / +5–12% |
What is included in the product
Detailed Word Document
Uncovers key drivers of competition, customer influence, and market entry risks tailored to OSI Group; evaluates supplier and buyer power, substitutes, and rivalry to highlight pricing and profitability pressures. Identifies disruptive threats and barriers protecting incumbency, with strategic commentary for investor, internal, and academic use.
Customizable Excel Spreadsheet
A clear, one-sheet Porter's Five Forces snapshot for OSI Group—perfect for quick strategic decisions, investor briefings, and prioritizing actions to relieve competitive pressure.
Customers Bargaining Power
Large QSR and retail chains
Large QSR and retail chains buy at scale and negotiate aggressively; McDonald's alone operated about 39,000 restaurants worldwide in 2024, amplifying buyer leverage. Consolidated volumes and multi-year bids, commonly 3–5 years, put downward pressure on pricing and terms. OSI preserves value through product customization, supply reliability and co-innovation. Performance-based contracts link pricing to SLAs, balancing margin with volume security.
Private label price sensitivity
Private label customers prioritize cost leadership with frequent re-tenders, increasing buyer leverage as small product differentiation makes suppliers directly comparable. In Europe private label penetration exceeded 20% in 2024, amplifying price sensitivity. OSI mitigates this through process efficiency and complex specifications that are hard to replicate, and by offering value-added formats that shift buyer focus from unit price to total cost of ownership.
Low switching barriers among processors
Qualified buyers can reallocate volumes to alternative co-packers after short trials, especially for standardized SKUs that heighten substitutability and buyer leverage. OSI raises exit costs via proprietary recipes and integrated logistics and operates around 65 facilities globally (2024), which deepens operational ties. High service levels and tailored logistics reduce incentives to switch for marginal savings.
Customization as soft lock-in
Co-developed products, proprietary formulations and tailored processes bind OSI into customers’ menus and supply chains; changeovers require requalification, marketing relaunches and operational retraining that typically take 3–6 months and disrupt throughput. These frictions reduce buyer leverage even at scale, and joint innovation roadmaps—often tied to 3–5 year supply agreements—deepen supplier stickiness.
- Co-developed IP locks supply
- 3–6 month requalification window
- 3–5 year roadmap/contracts
Rebates, penalties, and SLAs
Buyers impose rebates, on-time fill and quality penalties that shift risk upstream, with industry-standard on-time-fill SLAs often set at 95%+, and buyer deductions commonly running 1–3% of invoice value. Tight SLAs can compress margins by hundreds of basis points during volatility. OSI’s forecasting and operational excellence reduce deductions and enable negotiation of fairer terms. Transparent KPIs support gradual SLA relaxation and cost recovery.
- Rebates/penalties: 1–3% typical
- On-time-fill SLA: 95%+ target
- Margin impact: hundreds of bps in volatility
- OSI levers: forecasting, ops, KPIs
Scale QSR buyers v supplier lock-in: 65 sites, 95%+ SLA
Large QSR/retail buyers (e.g., McDonald's ~39,000 restaurants in 2024) exert strong price leverage via scale and multi-year bids; private label >20% in Europe (2024) raises price sensitivity. OSI offsets pressure through customization, 65 global facilities (2024), co-developed IP and SLAs (on-time-fill 95%+, rebates 1–3%), making switching costly and reducing effective buyer power.
| Metric | 2024 Value |
|---|---|
| McDonald's locations | ~39,000 |
| Private label EU share | >20% |
| OSI facilities | ~65 |
| On-time-fill SLA | 95%+ |
| Typical rebates/penalties | 1–3% |
Preview the Actual Deliverable
OSI Group Porter's Five Forces Analysis
This preview shows the exact Porter’s Five Forces analysis of OSI Group you’ll receive after purchase—fully formatted and professionally written, with no placeholders. It evaluates supplier power, buyer power, competitive rivalry, threat of substitution, and barriers to entry, with actionable insights. Downloadable immediately upon payment; the file you see here is the file you’ll get.











