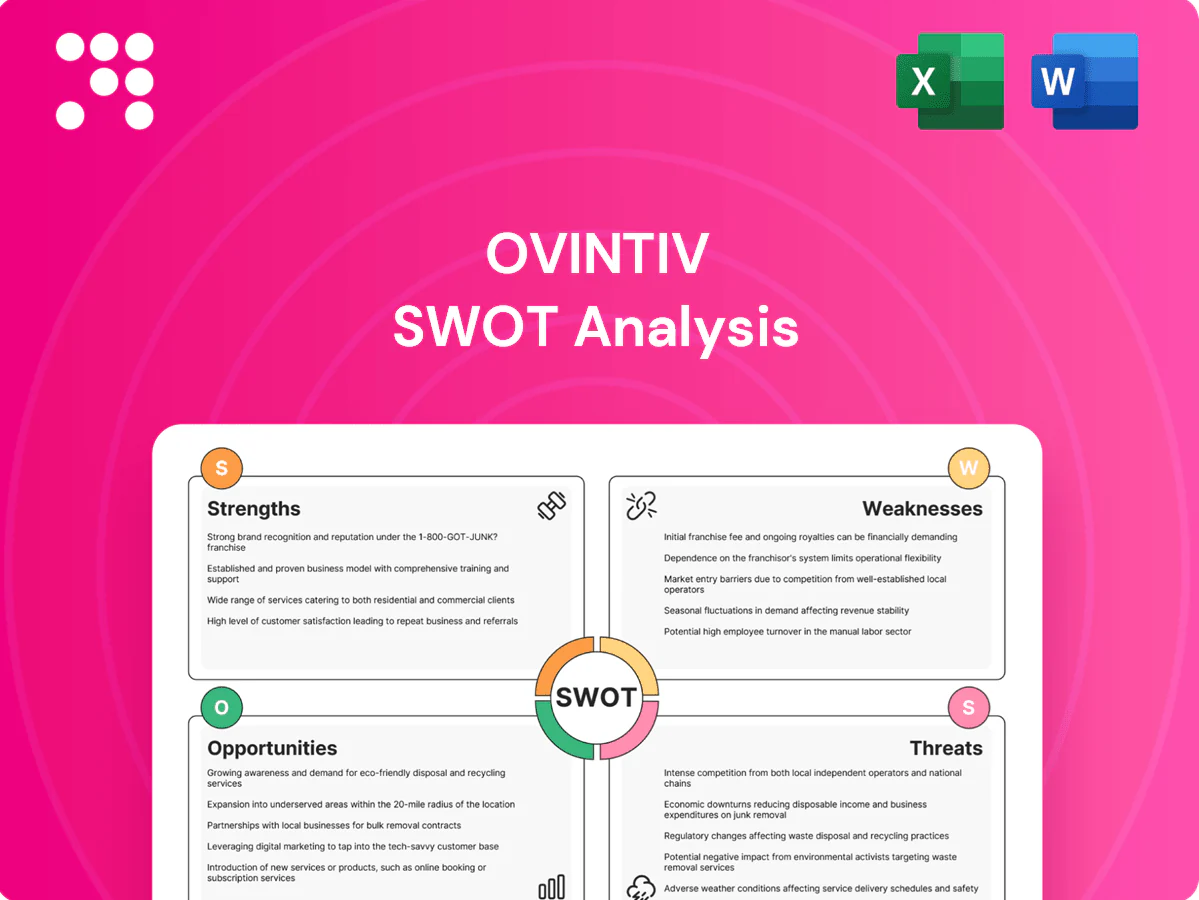
Ovintiv SWOT Analysis

Dive Deeper Into the Company’s Strategic Blueprint
Ovintiv’s SWOT reveals resilient upstream assets, cost discipline, and exposure to commodity cycles—plus regulatory and ESG headwinds that warrant close monitoring. Want the full picture with financial context, strategic recommendations, and scenario-ready insights? Purchase the complete SWOT to get a professionally formatted Word report and editable Excel model for investment, planning, or pitch-ready use.
Strengths

Multi-basin, liquids-rich portfolio
Ovintiv’s exposure to the Permian, Montney and Anadarko balances commodity mix and geology, concentrating activity in top-tier resource plays; the Permian alone produced about 5.7 million b/d of crude in 2023 (EIA). The company’s liquids-rich inventory—higher condensate and NGL content versus dry gas—supports stronger per-unit margins. Geographic diversification reduces risk from localized operational or regulatory disruptions. That multi-basin footprint increases capital-allocation optionality across cycles.
Capital discipline and FCF focus
Management emphasizes returns over growth, generating roughly $1.8B of free cash flow in 2024 and prioritizing shareholder distributions over aggressive capex.
Rig counts and activity are flexed to price signals and service costs, enabling rapid cost-out when WTI falls and higher activity when realizations improve.
Disciplined spending has cut leverage and improved resilience in downcycles, supporting consistent buybacks/dividends through commodity volatility.

Operational efficiency and scale
Lean operations including pad drilling and advanced completions cut per-barrel costs, helping Ovintiv sustain breakevens near $30–35/boe. Supply-chain and logistics optimization shortened cycle times and lifted well productivity (double-digit IP improvements in core basins). Scale across ~1.1 million net acres strengthens bargaining power with service providers and boosts capital productivity.

High-quality inventory depth
Ovintiv’s concentrated acreage in tier-one plays underpins a multi-year drilling runway, with company filings in 2024 highlighting repeatable development across proven benches that reduces geologic risk.
High-quality inventory supports steady returns at mid-cycle prices and provides long-term planning and capital visibility, enabling multi-year cash flow modeling tied to core acreage.
- Concentrated tier-one acreage — company filings 2024
- Repeatable bench development — lowers geologic risk
- Inventory supports mid-cycle returns — enhances capital visibility
ESG and responsible development practices
Ovintiv’s emphasis on emissions reduction, water stewardship and community engagement reinforces its social license to operate. Lower methane intensity and electrification initiatives reduce regulatory risk and operating costs. Stronger ESG metrics broaden investor access, lower cost of capital and help sustain stakeholder trust.
- Emissions reduction
- Water stewardship
- Community engagement
- Lower regulatory risk
- Broader investor access
~1.1M net acres, $1.8B FCF in 2024, breakevens ~$30–35/boe, repeatable development
Ovintiv’s ~1.1M net acres in tier‑one plays and liquids‑rich inventory support breakevens near $30–35/boe and repeatable bench development. Management generated ~$1.8B free cash flow in 2024, funding buybacks/dividends while flexing activity to prices. Operational gains yielded double‑digit IP improvements and shorter cycle times; ESG progress reduced regulatory risk and broadened investor access.
| Metric | Value | Year/Source |
|---|---|---|
| Net acres | ≈1.1M | 2024 filings |
| Free cash flow | $1.8B | 2024 |
| Breakeven | $30–35/boe | Company data |
| Permian crude | 5.7M b/d | EIA 2023 |
What is included in the product
 Detailed Word Document
Provides a concise SWOT analysis of Ovintiv, highlighting its operational strengths, financial and strategic weaknesses, market opportunities in energy transition and commodity cycles, and external threats from regulatory shifts, price volatility, and competition.

 Customizable Excel Spreadsheet
Provides a concise, sector-specific SWOT matrix for Ovintiv to speed strategic alignment and investor reporting; editable format lets teams update risks and opportunities quickly as commodity markets shift.
Weaknesses

Commodity price dependence
Revenue and cash flow remain highly sensitive to oil and gas prices: Ovintiv’s top-line moves largely in step with WTI and Henry Hub swings (WTI averaged about $80/bbl in 2024), creating material quarterly earnings variability.
Hedging programs smooth receipts but do not eliminate volatility; Ovintiv’s marketed price protection covered a portion of 2024 volumes, yet realized prices still deviated from benchmarks.
Prolonged price downturns compress returns and force activity cuts — even with budget flexibility and a lean capex plan, downside macro shocks can materially pressure production, free cash flow and shareholder returns.
North America concentration
Ovintiv's assets are almost exclusively in the U.S. and Canada (operations 100% North America), limiting geographic diversification and tying cashflows to regional cycles. Weather extremes and 2023–2024 Canadian wildfires and U.S. storm-related outages have disrupted operations and logistics. Policy shifts in either jurisdiction—taxes, methane/royalty rules—can materially affect margins. Exposure to basin-specific constraints (takeaway capacity in the Rockies/Montney) persists.

Midstream and takeaway exposure
Pipeline capacity and processing access can bottleneck volumes or widen differentials, with Permian takeaway and Montney egress remaining periodic pain points through 2024–25. Basis volatility of several dollars per MMBtu has eroded realized pricing for producers. Dependence on third-party infrastructure raises counterparty and apportionment risk, constraining marketing optionality and cash flow predictability.

Service cost cyclicality
Inflation in rigs, pressure pumping and tubulars has compressed service margins, while tight labor and equipment markets reduce execution flexibility and keep unit costs elevated; cost deflation historically lags commodity downturns, amplifying cycle impacts, and many multi-year service contracts limit near-term relief for Ovintiv.
- Service inflation pressures
- Tight labor/equipment supply
- Cost deflation lag
- Contract rigidity limits relief
Regulatory and stakeholder scrutiny
Regulatory and stakeholder scrutiny raises costs for Ovintiv as heightened methane standards, limits on produced-water disposal and expanded setback rules increase permitting and operational expenses; US policy aims for roughly 65% methane reduction by 2030, pressuring asset economics. Community opposition commonly delays permits and infrastructure, while carbon pricing and methane fees—now present in 70+ jurisdictions globally—add recurring costs and pull management into compliance work.
- Increased capex and Opex from methane/water rules
- Permit delays from community opposition
- Carbon pricing exposure via 70+ jurisdictions (2024)
- Management distraction from complex compliance
Revenue tied to $80/bbl WTI; North America exposure and ~65% methane cuts raise margin risk
Revenue and cash flow remain highly tied to commodity swings; WTI averaged about $80/bbl in 2024, driving material quarter-to-quarter earnings variability.
Operations are 100% North America, exposing Ovintiv to regional weather, policy shifts and basin takeaway constraints that compressed realized prices in 2023–24.
Service inflation, tight labor/equipment and regulatory costs (US methane ~65% reduction target by 2030) raise Opex and capex, limiting short-term margin relief.
| Metric | 2024 |
|---|---|
| WTI avg | $80/bbl |
| Geography | 100% North America |
| Methane target | ~65% by 2030 |
| Carbon pricing | 70+ jurisdictions |
Full Version Awaits
Ovintiv SWOT Analysis
This is the actual Ovintiv SWOT analysis document you’ll receive upon purchase—no surprises, just professional quality. The preview below is taken directly from the full report you'll get; buy to unlock the complete, editable version. You’re viewing a live preview of the real file, structured and ready for immediate use after checkout.

Dive Deeper Into the Company’s Strategic Blueprint
Ovintiv’s SWOT reveals resilient upstream assets, cost discipline, and exposure to commodity cycles—plus regulatory and ESG headwinds that warrant close monitoring. Want the full picture with financial context, strategic recommendations, and scenario-ready insights? Purchase the complete SWOT to get a professionally formatted Word report and editable Excel model for investment, planning, or pitch-ready use.
Strengths
Multi-basin, liquids-rich portfolio
Ovintiv’s exposure to the Permian, Montney and Anadarko balances commodity mix and geology, concentrating activity in top-tier resource plays; the Permian alone produced about 5.7 million b/d of crude in 2023 (EIA). The company’s liquids-rich inventory—higher condensate and NGL content versus dry gas—supports stronger per-unit margins. Geographic diversification reduces risk from localized operational or regulatory disruptions. That multi-basin footprint increases capital-allocation optionality across cycles.
Capital discipline and FCF focus
Management emphasizes returns over growth, generating roughly $1.8B of free cash flow in 2024 and prioritizing shareholder distributions over aggressive capex.
Rig counts and activity are flexed to price signals and service costs, enabling rapid cost-out when WTI falls and higher activity when realizations improve.
Disciplined spending has cut leverage and improved resilience in downcycles, supporting consistent buybacks/dividends through commodity volatility.
Operational efficiency and scale
Lean operations including pad drilling and advanced completions cut per-barrel costs, helping Ovintiv sustain breakevens near $30–35/boe. Supply-chain and logistics optimization shortened cycle times and lifted well productivity (double-digit IP improvements in core basins). Scale across ~1.1 million net acres strengthens bargaining power with service providers and boosts capital productivity.
High-quality inventory depth
Ovintiv’s concentrated acreage in tier-one plays underpins a multi-year drilling runway, with company filings in 2024 highlighting repeatable development across proven benches that reduces geologic risk.
High-quality inventory supports steady returns at mid-cycle prices and provides long-term planning and capital visibility, enabling multi-year cash flow modeling tied to core acreage.
- Concentrated tier-one acreage — company filings 2024
- Repeatable bench development — lowers geologic risk
- Inventory supports mid-cycle returns — enhances capital visibility
ESG and responsible development practices
Ovintiv’s emphasis on emissions reduction, water stewardship and community engagement reinforces its social license to operate. Lower methane intensity and electrification initiatives reduce regulatory risk and operating costs. Stronger ESG metrics broaden investor access, lower cost of capital and help sustain stakeholder trust.
- Emissions reduction
- Water stewardship
- Community engagement
- Lower regulatory risk
- Broader investor access
~1.1M net acres, $1.8B FCF in 2024, breakevens ~$30–35/boe, repeatable development
Ovintiv’s ~1.1M net acres in tier‑one plays and liquids‑rich inventory support breakevens near $30–35/boe and repeatable bench development. Management generated ~$1.8B free cash flow in 2024, funding buybacks/dividends while flexing activity to prices. Operational gains yielded double‑digit IP improvements and shorter cycle times; ESG progress reduced regulatory risk and broadened investor access.
| Metric | Value | Year/Source |
|---|---|---|
| Net acres | ≈1.1M | 2024 filings |
| Free cash flow | $1.8B | 2024 |
| Breakeven | $30–35/boe | Company data |
| Permian crude | 5.7M b/d | EIA 2023 |
What is included in the product
Detailed Word Document
Provides a concise SWOT analysis of Ovintiv, highlighting its operational strengths, financial and strategic weaknesses, market opportunities in energy transition and commodity cycles, and external threats from regulatory shifts, price volatility, and competition.
Customizable Excel Spreadsheet
Provides a concise, sector-specific SWOT matrix for Ovintiv to speed strategic alignment and investor reporting; editable format lets teams update risks and opportunities quickly as commodity markets shift.
Weaknesses
Commodity price dependence
Revenue and cash flow remain highly sensitive to oil and gas prices: Ovintiv’s top-line moves largely in step with WTI and Henry Hub swings (WTI averaged about $80/bbl in 2024), creating material quarterly earnings variability.
Hedging programs smooth receipts but do not eliminate volatility; Ovintiv’s marketed price protection covered a portion of 2024 volumes, yet realized prices still deviated from benchmarks.
Prolonged price downturns compress returns and force activity cuts — even with budget flexibility and a lean capex plan, downside macro shocks can materially pressure production, free cash flow and shareholder returns.
North America concentration
Ovintiv's assets are almost exclusively in the U.S. and Canada (operations 100% North America), limiting geographic diversification and tying cashflows to regional cycles. Weather extremes and 2023–2024 Canadian wildfires and U.S. storm-related outages have disrupted operations and logistics. Policy shifts in either jurisdiction—taxes, methane/royalty rules—can materially affect margins. Exposure to basin-specific constraints (takeaway capacity in the Rockies/Montney) persists.
Midstream and takeaway exposure
Pipeline capacity and processing access can bottleneck volumes or widen differentials, with Permian takeaway and Montney egress remaining periodic pain points through 2024–25. Basis volatility of several dollars per MMBtu has eroded realized pricing for producers. Dependence on third-party infrastructure raises counterparty and apportionment risk, constraining marketing optionality and cash flow predictability.
Service cost cyclicality
Inflation in rigs, pressure pumping and tubulars has compressed service margins, while tight labor and equipment markets reduce execution flexibility and keep unit costs elevated; cost deflation historically lags commodity downturns, amplifying cycle impacts, and many multi-year service contracts limit near-term relief for Ovintiv.
- Service inflation pressures
- Tight labor/equipment supply
- Cost deflation lag
- Contract rigidity limits relief
Regulatory and stakeholder scrutiny
Regulatory and stakeholder scrutiny raises costs for Ovintiv as heightened methane standards, limits on produced-water disposal and expanded setback rules increase permitting and operational expenses; US policy aims for roughly 65% methane reduction by 2030, pressuring asset economics. Community opposition commonly delays permits and infrastructure, while carbon pricing and methane fees—now present in 70+ jurisdictions globally—add recurring costs and pull management into compliance work.
- Increased capex and Opex from methane/water rules
- Permit delays from community opposition
- Carbon pricing exposure via 70+ jurisdictions (2024)
- Management distraction from complex compliance
Revenue tied to $80/bbl WTI; North America exposure and ~65% methane cuts raise margin risk
Revenue and cash flow remain highly tied to commodity swings; WTI averaged about $80/bbl in 2024, driving material quarter-to-quarter earnings variability.
Operations are 100% North America, exposing Ovintiv to regional weather, policy shifts and basin takeaway constraints that compressed realized prices in 2023–24.
Service inflation, tight labor/equipment and regulatory costs (US methane ~65% reduction target by 2030) raise Opex and capex, limiting short-term margin relief.
| Metric | 2024 |
|---|---|
| WTI avg | $80/bbl |
| Geography | 100% North America |
| Methane target | ~65% by 2030 |
| Carbon pricing | 70+ jurisdictions |
Full Version Awaits
Ovintiv SWOT Analysis
This is the actual Ovintiv SWOT analysis document you’ll receive upon purchase—no surprises, just professional quality. The preview below is taken directly from the full report you'll get; buy to unlock the complete, editable version. You’re viewing a live preview of the real file, structured and ready for immediate use after checkout.
Original: $10.00
-65%$10.00
$3.50Description
Dive Deeper Into the Company’s Strategic Blueprint
Ovintiv’s SWOT reveals resilient upstream assets, cost discipline, and exposure to commodity cycles—plus regulatory and ESG headwinds that warrant close monitoring. Want the full picture with financial context, strategic recommendations, and scenario-ready insights? Purchase the complete SWOT to get a professionally formatted Word report and editable Excel model for investment, planning, or pitch-ready use.
Strengths
Multi-basin, liquids-rich portfolio
Ovintiv’s exposure to the Permian, Montney and Anadarko balances commodity mix and geology, concentrating activity in top-tier resource plays; the Permian alone produced about 5.7 million b/d of crude in 2023 (EIA). The company’s liquids-rich inventory—higher condensate and NGL content versus dry gas—supports stronger per-unit margins. Geographic diversification reduces risk from localized operational or regulatory disruptions. That multi-basin footprint increases capital-allocation optionality across cycles.
Capital discipline and FCF focus
Management emphasizes returns over growth, generating roughly $1.8B of free cash flow in 2024 and prioritizing shareholder distributions over aggressive capex.
Rig counts and activity are flexed to price signals and service costs, enabling rapid cost-out when WTI falls and higher activity when realizations improve.
Disciplined spending has cut leverage and improved resilience in downcycles, supporting consistent buybacks/dividends through commodity volatility.
Operational efficiency and scale
Lean operations including pad drilling and advanced completions cut per-barrel costs, helping Ovintiv sustain breakevens near $30–35/boe. Supply-chain and logistics optimization shortened cycle times and lifted well productivity (double-digit IP improvements in core basins). Scale across ~1.1 million net acres strengthens bargaining power with service providers and boosts capital productivity.
High-quality inventory depth
Ovintiv’s concentrated acreage in tier-one plays underpins a multi-year drilling runway, with company filings in 2024 highlighting repeatable development across proven benches that reduces geologic risk.
High-quality inventory supports steady returns at mid-cycle prices and provides long-term planning and capital visibility, enabling multi-year cash flow modeling tied to core acreage.
- Concentrated tier-one acreage — company filings 2024
- Repeatable bench development — lowers geologic risk
- Inventory supports mid-cycle returns — enhances capital visibility
ESG and responsible development practices
Ovintiv’s emphasis on emissions reduction, water stewardship and community engagement reinforces its social license to operate. Lower methane intensity and electrification initiatives reduce regulatory risk and operating costs. Stronger ESG metrics broaden investor access, lower cost of capital and help sustain stakeholder trust.
- Emissions reduction
- Water stewardship
- Community engagement
- Lower regulatory risk
- Broader investor access
~1.1M net acres, $1.8B FCF in 2024, breakevens ~$30–35/boe, repeatable development
Ovintiv’s ~1.1M net acres in tier‑one plays and liquids‑rich inventory support breakevens near $30–35/boe and repeatable bench development. Management generated ~$1.8B free cash flow in 2024, funding buybacks/dividends while flexing activity to prices. Operational gains yielded double‑digit IP improvements and shorter cycle times; ESG progress reduced regulatory risk and broadened investor access.
| Metric | Value | Year/Source |
|---|---|---|
| Net acres | ≈1.1M | 2024 filings |
| Free cash flow | $1.8B | 2024 |
| Breakeven | $30–35/boe | Company data |
| Permian crude | 5.7M b/d | EIA 2023 |
What is included in the product
Detailed Word Document
Provides a concise SWOT analysis of Ovintiv, highlighting its operational strengths, financial and strategic weaknesses, market opportunities in energy transition and commodity cycles, and external threats from regulatory shifts, price volatility, and competition.
Customizable Excel Spreadsheet
Provides a concise, sector-specific SWOT matrix for Ovintiv to speed strategic alignment and investor reporting; editable format lets teams update risks and opportunities quickly as commodity markets shift.
Weaknesses
Commodity price dependence
Revenue and cash flow remain highly sensitive to oil and gas prices: Ovintiv’s top-line moves largely in step with WTI and Henry Hub swings (WTI averaged about $80/bbl in 2024), creating material quarterly earnings variability.
Hedging programs smooth receipts but do not eliminate volatility; Ovintiv’s marketed price protection covered a portion of 2024 volumes, yet realized prices still deviated from benchmarks.
Prolonged price downturns compress returns and force activity cuts — even with budget flexibility and a lean capex plan, downside macro shocks can materially pressure production, free cash flow and shareholder returns.
North America concentration
Ovintiv's assets are almost exclusively in the U.S. and Canada (operations 100% North America), limiting geographic diversification and tying cashflows to regional cycles. Weather extremes and 2023–2024 Canadian wildfires and U.S. storm-related outages have disrupted operations and logistics. Policy shifts in either jurisdiction—taxes, methane/royalty rules—can materially affect margins. Exposure to basin-specific constraints (takeaway capacity in the Rockies/Montney) persists.
Midstream and takeaway exposure
Pipeline capacity and processing access can bottleneck volumes or widen differentials, with Permian takeaway and Montney egress remaining periodic pain points through 2024–25. Basis volatility of several dollars per MMBtu has eroded realized pricing for producers. Dependence on third-party infrastructure raises counterparty and apportionment risk, constraining marketing optionality and cash flow predictability.
Service cost cyclicality
Inflation in rigs, pressure pumping and tubulars has compressed service margins, while tight labor and equipment markets reduce execution flexibility and keep unit costs elevated; cost deflation historically lags commodity downturns, amplifying cycle impacts, and many multi-year service contracts limit near-term relief for Ovintiv.
- Service inflation pressures
- Tight labor/equipment supply
- Cost deflation lag
- Contract rigidity limits relief
Regulatory and stakeholder scrutiny
Regulatory and stakeholder scrutiny raises costs for Ovintiv as heightened methane standards, limits on produced-water disposal and expanded setback rules increase permitting and operational expenses; US policy aims for roughly 65% methane reduction by 2030, pressuring asset economics. Community opposition commonly delays permits and infrastructure, while carbon pricing and methane fees—now present in 70+ jurisdictions globally—add recurring costs and pull management into compliance work.
- Increased capex and Opex from methane/water rules
- Permit delays from community opposition
- Carbon pricing exposure via 70+ jurisdictions (2024)
- Management distraction from complex compliance
Revenue tied to $80/bbl WTI; North America exposure and ~65% methane cuts raise margin risk
Revenue and cash flow remain highly tied to commodity swings; WTI averaged about $80/bbl in 2024, driving material quarter-to-quarter earnings variability.
Operations are 100% North America, exposing Ovintiv to regional weather, policy shifts and basin takeaway constraints that compressed realized prices in 2023–24.
Service inflation, tight labor/equipment and regulatory costs (US methane ~65% reduction target by 2030) raise Opex and capex, limiting short-term margin relief.
| Metric | 2024 |
|---|---|
| WTI avg | $80/bbl |
| Geography | 100% North America |
| Methane target | ~65% by 2030 |
| Carbon pricing | 70+ jurisdictions |
Full Version Awaits
Ovintiv SWOT Analysis
This is the actual Ovintiv SWOT analysis document you’ll receive upon purchase—no surprises, just professional quality. The preview below is taken directly from the full report you'll get; buy to unlock the complete, editable version. You’re viewing a live preview of the real file, structured and ready for immediate use after checkout.











