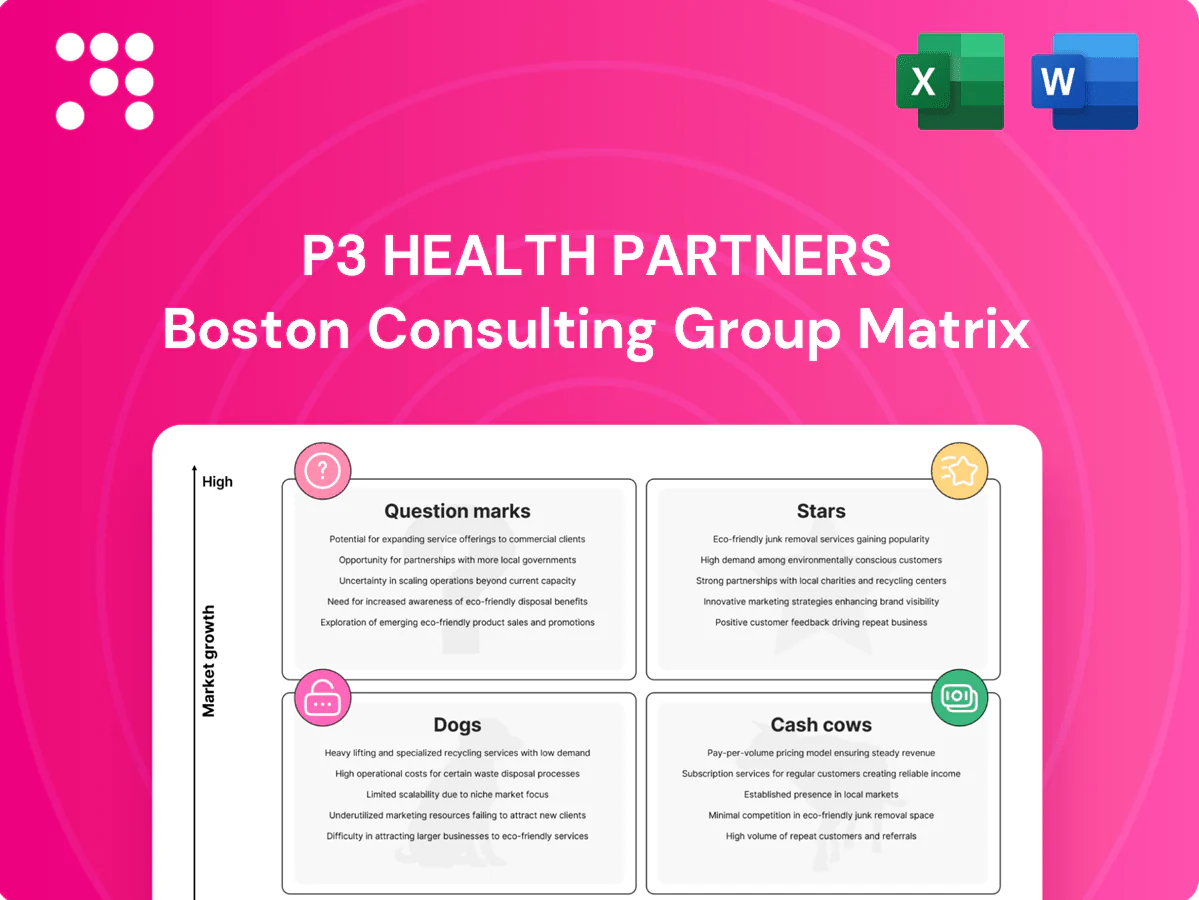
P3 Health Partners Boston Consulting Group Matrix

Download Your Competitive Advantage
Curious where P3 Health Partners’ products land—Stars, Cash Cows, Dogs, or Question Marks? This snapshot teases the structure; buy the full BCG Matrix to get quadrant-by-quadrant clarity, data-backed recommendations, and tactical next steps you can act on now. You’ll get a ready-to-present Word report plus an Excel summary, saving hours of digging and giving you a clear investment and product roadmap. Purchase now and move from guesswork to confident strategy.
Stars

Medicare Advantage risk-bearing panels
With national Medicare Advantage penetration over 50% in 2024 and P3 Health Partners’ physician-led risk panels, this sits squarely in the leader quadrant; high attribution and top-tier quality scores drive share. These panels deliver strong enrollment but consume cash for care teams and infrastructure. Continue investing in care coordination and HEDIS to protect share. Hold now; panels should mature into outsized margins over time.
Value-based primary care clinics in growth markets
De novo and acquired Value-based primary care clinics in Sunbelt growth corridors scaled rapidly in 2024, leading local cohorts on outcomes and retention metrics versus fee-for-service peers. They require targeted promotion, expanded staffing and access capacity—adding providers, same-day slots and outreach to sustain growth. If churn remains low, these sites can compound into dominant regional positions.

Chronic disease care management programs
Chronic disease care management for CKD, CHF and COPD with tight protocols shows clear outcome lifts: CHF programs cut 30‑day readmissions ~20–30% and COPD programs reduce admissions ~15–25% (meta‑analyses through 2024), while CKD care can lower progression to dialysis and avoid ~$90k/year dialysis costs per patient. They win mindshare with payers and PCPs but consume cash for nurses, pharmacists and analytics. Double down while ROIs prove out. As the market cools, the cost‑curve advantage becomes bankable margin.

Risk stratification and care analytics
The data engine that flags rising risk drives the whole model and in P3 2024 pilots reduced avoidable admissions by 15%, underpinning partner retention. It’s sticky with partners and differentiates contracting, but constant model tuning and data plumbing consumes roughly 10–12% of annual ops spend. Keep funding accuracy and workflow integration; precision sustains share and unlocked 8–10% better payor rates.
- Engine: 15% fewer avoidable admissions (2024 pilots)
- Cost: model tuning/data plumbing ≈10–12% of ops
- Impact: precision enabled 8–10% higher negotiated rates
Payer co-branded value-based partnerships
Payer co-branded value-based partnerships are scaling member attribution rapidly via joint go-to-market with Medicare Advantage (MA) plans, as MA plans accounted for roughly half of Medicare enrollment in 2024. Marketing, shared-savings alignment, and reporting currently consume significant operational resources. Protect these lanes and expand into adjacent counties to tighten network effect. With momentum, pilots convert into durable, favorable contracts.
- GTM with MA — rapid attribution
- Resource drains — marketing, reporting, savings ops
- Defense — protect lanes, expand counties
- Outcome — momentum → durable contracts
Physician MA panels: 50%+ penetration, 15% fewer admissions
Stars: P3’s physician-led MA panels sit in BCG Stars—>50% MA penetration (2024), high attribution and top HEDIS/QoS. Invest in care coordination, staffing and data to sustain growth; pilots cut avoidable admissions 15% and support 8–10% better payor rates. Operations absorb 10–12% for data/modeling but panels should convert to outsized margins as churn falls.
| Metric | 2024 | Impact |
|---|---|---|
| MA penetration | >50% | Large addressable market |
| Avoidable admissions | -15% | Retention, savings |
| Ops data cost | 10–12% | Opex pressure |
What is included in the product
 Detailed Word Document
P3 Health Partners BCG Matrix: quadrant-by-quadrant analysis with investment, hold or divest recommendations and competitive context.

 Customizable Excel Spreadsheet
One-page overview placing each P3 Health Partners unit in a BCG quadrant to simplify decisions and remove strategic friction.
Cash Cows

Mature capitated contracts in stable counties
Panels fully ramped with predictable HCC risk scores deliver steady cash flow; in mature counties churn is typically under 10% and year-over-year premium yield growth is modest. Operations are dialed in with high compliance and low variance, so avoid over-investing in capacity. Milk predictability to fund entry into new markets and pilot growth initiatives.
Established PCP networks with long tenure
Seasoned affiliated physicians deliver consistent quality and documentation, leveraging primary care experience that aligns with stable outpatient outcomes; primary care comprises about 30% of the US physician workforce (AAMC 2024). Minimal promotion is needed as long-tenured relationships drive referrals and retention. Keep light-touch enablement and coding support to sustain workflows and cash flow stays healthy without heavy lift.

Standardized preventive care workflows
Annual wellness visits, vaccinations and guideline screenings are humming under a standardized preventive care workflow. The playbook is repeatable and cheap at scale—Medicare covers AWV via codes G0438/G0439, enabling reliable reimbursement. Small process tweaks raise capture and yield quickly. Let these low‑variance cash cows bankroll the tougher builds.

Referral and utilization management
Referral and utilization management is a classic cash cow: right-site, right-cost controls are operationally dull but reliably profitable, reducing downstream spend against a US health system that hit about 4.5 trillion dollars in 2022 (CMS). The tooling is built and maintenance is low-cost; strong clinical governance and tight leakage control keep ROI predictable and continuous cash flow steady.
- Operational leverage
- Low maintenance costs
- Protects margins
- Requires clinical governance
Risk adjustment and documentation excellence
Risk adjustment and documentation excellence are P3 Health Partners' cash cow: established RAF capture with compliant practices sustains revenue amid a Medicare Advantage market that exceeded 30 million enrollees in 2024. Routine training is now low-cost and operationalized, not a major spend. Maintain audits and feedback loops to preserve payments and reliability; it quietly pays the bills.
- RAF capture: steady, compliant
- Training: routine, low marginal cost
- Audits: ongoing with feedback loops
- Business impact: reliable revenue stream
Low-churn panels, predictable HCC/RAF capture, MA scale funds growth
Panels with <10% churn and predictable HCC/RAF capture drive steady cash flow; primary care ~30% of US physicians (AAMC 2024) and MA >30M enrollees (2024) sustain margins. Low maintenance ops, standardized AWV workflows (G0438/G0439) and referral controls reduce cost while funding growth pilots.
| Metric | Value |
|---|---|
| Churn | <10% |
| Primary care share | 30% (AAMC 2024) |
| MA enrollees | >30M (2024) |
Full Transparency, Always
P3 Health Partners BCG Matrix
The P3 Health Partners BCG Matrix you're previewing is the exact file you'll receive after purchase. No watermarks, no samples—just a fully formatted, analysis-ready report tailored for healthcare strategy. Once bought, the same document is instantly downloadable and editable for presentations or internal planning. It's designed for immediate use with clear visuals and actionable insights.

Download Your Competitive Advantage
Curious where P3 Health Partners’ products land—Stars, Cash Cows, Dogs, or Question Marks? This snapshot teases the structure; buy the full BCG Matrix to get quadrant-by-quadrant clarity, data-backed recommendations, and tactical next steps you can act on now. You’ll get a ready-to-present Word report plus an Excel summary, saving hours of digging and giving you a clear investment and product roadmap. Purchase now and move from guesswork to confident strategy.
Stars
Medicare Advantage risk-bearing panels
With national Medicare Advantage penetration over 50% in 2024 and P3 Health Partners’ physician-led risk panels, this sits squarely in the leader quadrant; high attribution and top-tier quality scores drive share. These panels deliver strong enrollment but consume cash for care teams and infrastructure. Continue investing in care coordination and HEDIS to protect share. Hold now; panels should mature into outsized margins over time.
Value-based primary care clinics in growth markets
De novo and acquired Value-based primary care clinics in Sunbelt growth corridors scaled rapidly in 2024, leading local cohorts on outcomes and retention metrics versus fee-for-service peers. They require targeted promotion, expanded staffing and access capacity—adding providers, same-day slots and outreach to sustain growth. If churn remains low, these sites can compound into dominant regional positions.
Chronic disease care management programs
Chronic disease care management for CKD, CHF and COPD with tight protocols shows clear outcome lifts: CHF programs cut 30‑day readmissions ~20–30% and COPD programs reduce admissions ~15–25% (meta‑analyses through 2024), while CKD care can lower progression to dialysis and avoid ~$90k/year dialysis costs per patient. They win mindshare with payers and PCPs but consume cash for nurses, pharmacists and analytics. Double down while ROIs prove out. As the market cools, the cost‑curve advantage becomes bankable margin.
Risk stratification and care analytics
The data engine that flags rising risk drives the whole model and in P3 2024 pilots reduced avoidable admissions by 15%, underpinning partner retention. It’s sticky with partners and differentiates contracting, but constant model tuning and data plumbing consumes roughly 10–12% of annual ops spend. Keep funding accuracy and workflow integration; precision sustains share and unlocked 8–10% better payor rates.
- Engine: 15% fewer avoidable admissions (2024 pilots)
- Cost: model tuning/data plumbing ≈10–12% of ops
- Impact: precision enabled 8–10% higher negotiated rates
Payer co-branded value-based partnerships
Payer co-branded value-based partnerships are scaling member attribution rapidly via joint go-to-market with Medicare Advantage (MA) plans, as MA plans accounted for roughly half of Medicare enrollment in 2024. Marketing, shared-savings alignment, and reporting currently consume significant operational resources. Protect these lanes and expand into adjacent counties to tighten network effect. With momentum, pilots convert into durable, favorable contracts.
- GTM with MA — rapid attribution
- Resource drains — marketing, reporting, savings ops
- Defense — protect lanes, expand counties
- Outcome — momentum → durable contracts
Physician MA panels: 50%+ penetration, 15% fewer admissions
Stars: P3’s physician-led MA panels sit in BCG Stars—>50% MA penetration (2024), high attribution and top HEDIS/QoS. Invest in care coordination, staffing and data to sustain growth; pilots cut avoidable admissions 15% and support 8–10% better payor rates. Operations absorb 10–12% for data/modeling but panels should convert to outsized margins as churn falls.
| Metric | 2024 | Impact |
|---|---|---|
| MA penetration | >50% | Large addressable market |
| Avoidable admissions | -15% | Retention, savings |
| Ops data cost | 10–12% | Opex pressure |
What is included in the product
Detailed Word Document
P3 Health Partners BCG Matrix: quadrant-by-quadrant analysis with investment, hold or divest recommendations and competitive context.
Customizable Excel Spreadsheet
One-page overview placing each P3 Health Partners unit in a BCG quadrant to simplify decisions and remove strategic friction.
Cash Cows
Mature capitated contracts in stable counties
Panels fully ramped with predictable HCC risk scores deliver steady cash flow; in mature counties churn is typically under 10% and year-over-year premium yield growth is modest. Operations are dialed in with high compliance and low variance, so avoid over-investing in capacity. Milk predictability to fund entry into new markets and pilot growth initiatives.
Established PCP networks with long tenure
Seasoned affiliated physicians deliver consistent quality and documentation, leveraging primary care experience that aligns with stable outpatient outcomes; primary care comprises about 30% of the US physician workforce (AAMC 2024). Minimal promotion is needed as long-tenured relationships drive referrals and retention. Keep light-touch enablement and coding support to sustain workflows and cash flow stays healthy without heavy lift.
Standardized preventive care workflows
Annual wellness visits, vaccinations and guideline screenings are humming under a standardized preventive care workflow. The playbook is repeatable and cheap at scale—Medicare covers AWV via codes G0438/G0439, enabling reliable reimbursement. Small process tweaks raise capture and yield quickly. Let these low‑variance cash cows bankroll the tougher builds.
Referral and utilization management
Referral and utilization management is a classic cash cow: right-site, right-cost controls are operationally dull but reliably profitable, reducing downstream spend against a US health system that hit about 4.5 trillion dollars in 2022 (CMS). The tooling is built and maintenance is low-cost; strong clinical governance and tight leakage control keep ROI predictable and continuous cash flow steady.
- Operational leverage
- Low maintenance costs
- Protects margins
- Requires clinical governance
Risk adjustment and documentation excellence
Risk adjustment and documentation excellence are P3 Health Partners' cash cow: established RAF capture with compliant practices sustains revenue amid a Medicare Advantage market that exceeded 30 million enrollees in 2024. Routine training is now low-cost and operationalized, not a major spend. Maintain audits and feedback loops to preserve payments and reliability; it quietly pays the bills.
- RAF capture: steady, compliant
- Training: routine, low marginal cost
- Audits: ongoing with feedback loops
- Business impact: reliable revenue stream
Low-churn panels, predictable HCC/RAF capture, MA scale funds growth
Panels with <10% churn and predictable HCC/RAF capture drive steady cash flow; primary care ~30% of US physicians (AAMC 2024) and MA >30M enrollees (2024) sustain margins. Low maintenance ops, standardized AWV workflows (G0438/G0439) and referral controls reduce cost while funding growth pilots.
| Metric | Value |
|---|---|
| Churn | <10% |
| Primary care share | 30% (AAMC 2024) |
| MA enrollees | >30M (2024) |
Full Transparency, Always
P3 Health Partners BCG Matrix
The P3 Health Partners BCG Matrix you're previewing is the exact file you'll receive after purchase. No watermarks, no samples—just a fully formatted, analysis-ready report tailored for healthcare strategy. Once bought, the same document is instantly downloadable and editable for presentations or internal planning. It's designed for immediate use with clear visuals and actionable insights.
Original: $10.00
-65%$10.00
$3.50Description
Download Your Competitive Advantage
Curious where P3 Health Partners’ products land—Stars, Cash Cows, Dogs, or Question Marks? This snapshot teases the structure; buy the full BCG Matrix to get quadrant-by-quadrant clarity, data-backed recommendations, and tactical next steps you can act on now. You’ll get a ready-to-present Word report plus an Excel summary, saving hours of digging and giving you a clear investment and product roadmap. Purchase now and move from guesswork to confident strategy.
Stars
Medicare Advantage risk-bearing panels
With national Medicare Advantage penetration over 50% in 2024 and P3 Health Partners’ physician-led risk panels, this sits squarely in the leader quadrant; high attribution and top-tier quality scores drive share. These panels deliver strong enrollment but consume cash for care teams and infrastructure. Continue investing in care coordination and HEDIS to protect share. Hold now; panels should mature into outsized margins over time.
Value-based primary care clinics in growth markets
De novo and acquired Value-based primary care clinics in Sunbelt growth corridors scaled rapidly in 2024, leading local cohorts on outcomes and retention metrics versus fee-for-service peers. They require targeted promotion, expanded staffing and access capacity—adding providers, same-day slots and outreach to sustain growth. If churn remains low, these sites can compound into dominant regional positions.
Chronic disease care management programs
Chronic disease care management for CKD, CHF and COPD with tight protocols shows clear outcome lifts: CHF programs cut 30‑day readmissions ~20–30% and COPD programs reduce admissions ~15–25% (meta‑analyses through 2024), while CKD care can lower progression to dialysis and avoid ~$90k/year dialysis costs per patient. They win mindshare with payers and PCPs but consume cash for nurses, pharmacists and analytics. Double down while ROIs prove out. As the market cools, the cost‑curve advantage becomes bankable margin.
Risk stratification and care analytics
The data engine that flags rising risk drives the whole model and in P3 2024 pilots reduced avoidable admissions by 15%, underpinning partner retention. It’s sticky with partners and differentiates contracting, but constant model tuning and data plumbing consumes roughly 10–12% of annual ops spend. Keep funding accuracy and workflow integration; precision sustains share and unlocked 8–10% better payor rates.
- Engine: 15% fewer avoidable admissions (2024 pilots)
- Cost: model tuning/data plumbing ≈10–12% of ops
- Impact: precision enabled 8–10% higher negotiated rates
Payer co-branded value-based partnerships
Payer co-branded value-based partnerships are scaling member attribution rapidly via joint go-to-market with Medicare Advantage (MA) plans, as MA plans accounted for roughly half of Medicare enrollment in 2024. Marketing, shared-savings alignment, and reporting currently consume significant operational resources. Protect these lanes and expand into adjacent counties to tighten network effect. With momentum, pilots convert into durable, favorable contracts.
- GTM with MA — rapid attribution
- Resource drains — marketing, reporting, savings ops
- Defense — protect lanes, expand counties
- Outcome — momentum → durable contracts
Physician MA panels: 50%+ penetration, 15% fewer admissions
Stars: P3’s physician-led MA panels sit in BCG Stars—>50% MA penetration (2024), high attribution and top HEDIS/QoS. Invest in care coordination, staffing and data to sustain growth; pilots cut avoidable admissions 15% and support 8–10% better payor rates. Operations absorb 10–12% for data/modeling but panels should convert to outsized margins as churn falls.
| Metric | 2024 | Impact |
|---|---|---|
| MA penetration | >50% | Large addressable market |
| Avoidable admissions | -15% | Retention, savings |
| Ops data cost | 10–12% | Opex pressure |
What is included in the product
Detailed Word Document
P3 Health Partners BCG Matrix: quadrant-by-quadrant analysis with investment, hold or divest recommendations and competitive context.
Customizable Excel Spreadsheet
One-page overview placing each P3 Health Partners unit in a BCG quadrant to simplify decisions and remove strategic friction.
Cash Cows
Mature capitated contracts in stable counties
Panels fully ramped with predictable HCC risk scores deliver steady cash flow; in mature counties churn is typically under 10% and year-over-year premium yield growth is modest. Operations are dialed in with high compliance and low variance, so avoid over-investing in capacity. Milk predictability to fund entry into new markets and pilot growth initiatives.
Established PCP networks with long tenure
Seasoned affiliated physicians deliver consistent quality and documentation, leveraging primary care experience that aligns with stable outpatient outcomes; primary care comprises about 30% of the US physician workforce (AAMC 2024). Minimal promotion is needed as long-tenured relationships drive referrals and retention. Keep light-touch enablement and coding support to sustain workflows and cash flow stays healthy without heavy lift.
Standardized preventive care workflows
Annual wellness visits, vaccinations and guideline screenings are humming under a standardized preventive care workflow. The playbook is repeatable and cheap at scale—Medicare covers AWV via codes G0438/G0439, enabling reliable reimbursement. Small process tweaks raise capture and yield quickly. Let these low‑variance cash cows bankroll the tougher builds.
Referral and utilization management
Referral and utilization management is a classic cash cow: right-site, right-cost controls are operationally dull but reliably profitable, reducing downstream spend against a US health system that hit about 4.5 trillion dollars in 2022 (CMS). The tooling is built and maintenance is low-cost; strong clinical governance and tight leakage control keep ROI predictable and continuous cash flow steady.
- Operational leverage
- Low maintenance costs
- Protects margins
- Requires clinical governance
Risk adjustment and documentation excellence
Risk adjustment and documentation excellence are P3 Health Partners' cash cow: established RAF capture with compliant practices sustains revenue amid a Medicare Advantage market that exceeded 30 million enrollees in 2024. Routine training is now low-cost and operationalized, not a major spend. Maintain audits and feedback loops to preserve payments and reliability; it quietly pays the bills.
- RAF capture: steady, compliant
- Training: routine, low marginal cost
- Audits: ongoing with feedback loops
- Business impact: reliable revenue stream
Low-churn panels, predictable HCC/RAF capture, MA scale funds growth
Panels with <10% churn and predictable HCC/RAF capture drive steady cash flow; primary care ~30% of US physicians (AAMC 2024) and MA >30M enrollees (2024) sustain margins. Low maintenance ops, standardized AWV workflows (G0438/G0439) and referral controls reduce cost while funding growth pilots.
| Metric | Value |
|---|---|
| Churn | <10% |
| Primary care share | 30% (AAMC 2024) |
| MA enrollees | >30M (2024) |
Full Transparency, Always
P3 Health Partners BCG Matrix
The P3 Health Partners BCG Matrix you're previewing is the exact file you'll receive after purchase. No watermarks, no samples—just a fully formatted, analysis-ready report tailored for healthcare strategy. Once bought, the same document is instantly downloadable and editable for presentations or internal planning. It's designed for immediate use with clear visuals and actionable insights.











