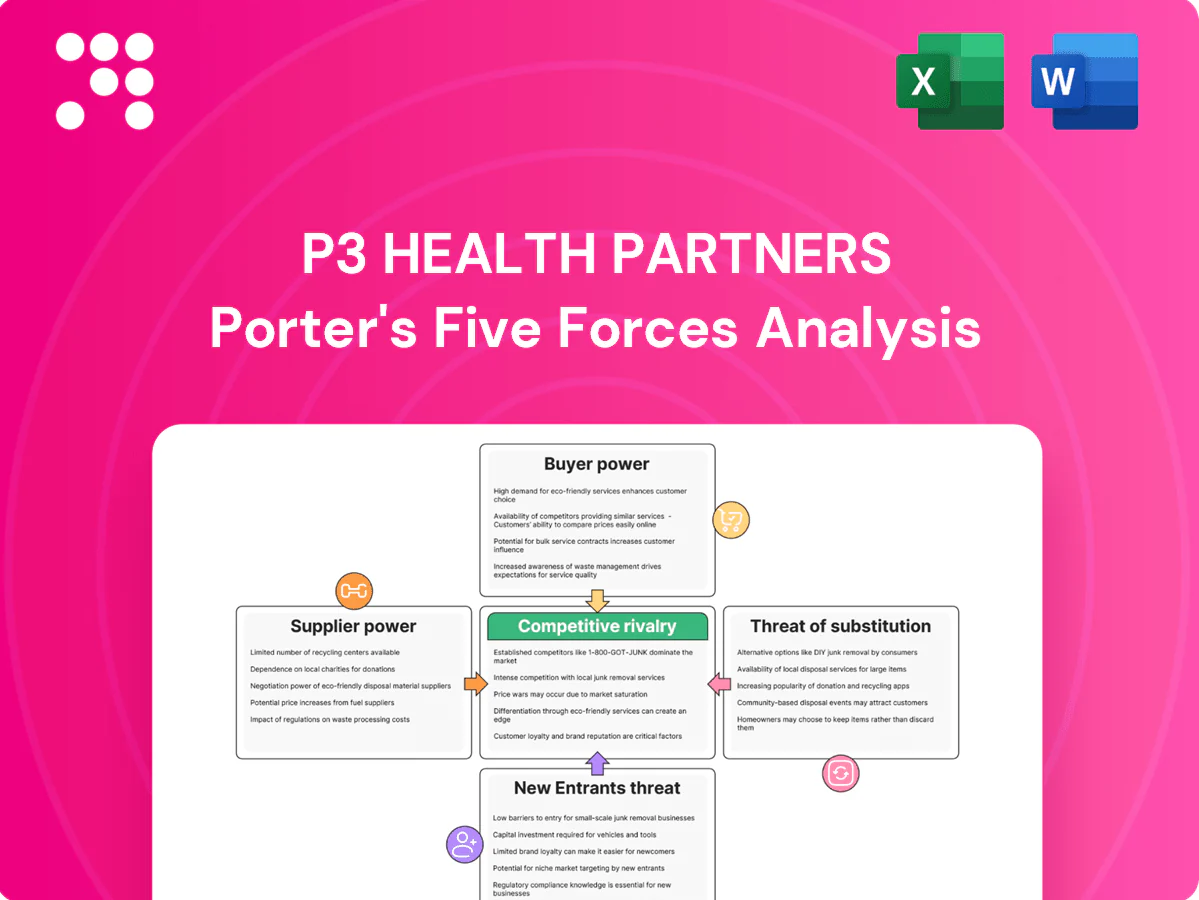
P3 Health Partners Porter's Five Forces Analysis

Go Beyond the Preview—Access the Full Strategic Report
P3 Health Partners faces moderate supplier leverage, rising buyer expectations, and intense rivalry as value-based care models reshape pricing and margins. Emerging entrants and substitutes from telehealth and payer-integrated platforms increasingly pressure growth and differentiation. This brief snapshot only scratches the surface. Unlock the full Porter's Five Forces Analysis to explore P3 Health Partners’s competitive dynamics, market pressures, and strategic advantages in detail.
Suppliers Bargaining Power

PCP scarcity elevates leverage
Tight primary care supply in many P3 markets—AAMC projects ongoing PCP shortages through 2034—gives independent PCPs leverage over panel sizes, incentives and support services. High-performing PCPs who lower medical loss ratios are disproportionately valuable under value-based contracts, driving higher acquisition/affiliation costs and expanded bonus pools. P3 mitigates by offering shared savings, multidisciplinary care teams and technology enablement to retain providers.
Specialist and facility dependence
Value-based outcomes still hinge on downstream specialists, hospitals and post-acute providers to control total cost of care; concentrated hospital markets have driven commercial prices 20%+ above Medicare and can limit steerage. Narrow preferred networks and standardized care pathways can temper this power but referral leakage often runs 10–30%. Deep partnerships and robust data‑sharing agreements are critical to moderate supplier influence.

Health IT and data vendors
Health IT and data vendors for EHR, risk coding, analytics and interoperability are highly specialized and sticky, creating significant switching costs for P3. Vendor concentration in risk-adjustment and HEDIS/Stars tooling increases pricing power, especially as Medicare Advantage enrollment surpassed 30 million in 2024, raising stakes for accurate risk scores. Long-term contracts and complex integrations further entrench suppliers. P3 can mitigate by adopting modular architectures and building selective capabilities in-house.

Ancillary services and diagnostics
Labs, imaging centers, and home health agencies shape access and total-cost trends; top labs (Quest, LabCorp) account for about 50–60% of U.S. testing volume, and outpatient imaging prices can vary up to 3x across providers. In concentrated markets suppliers can push prices and scheduling priorities, while preferred networks and volume commitments secure better terms. Growth of at-home diagnostics and point-of-care testing is reducing dependence over time.
- Labs concentration ~50–60%: bargaining power
- Imaging price variation up to 3x: scheduling/pricing leverage
- Preferred networks/volume contracts improve terms; at‑home testing lowers long‑term dependence
Clinical workforce and staffing
Clinical workforce and staffing exert strong supplier power: nursing, MAs, care managers and coders remain constrained and inflationary, driving sustained wage pressure and higher turnover that increase operating costs and risk care continuity; agency and RCM vendors have expanded share and markups during shortages, with reports in 2024 showing RN vacancy rates above 10% and agency premium spend rising into double digits.
- Wage inflation: rising compensation increases unit labor costs
- Turnover: higher rehiring/training spend and continuity risk
- Agency/RCM leverage: short-term cost spikes and margin compression
- Mitigants: workforce pipelines and automation reduce supplier power over time
Tight PCP supply and concentrated hospitals fuel strong supplier leverage
Tight PCP supply (AAMC projects shortages through 2034) and concentrated hospitals (commercial prices ~20%+ above Medicare) give suppliers strong leverage; vendor stickiness (Medicare Advantage >30M enrollees in 2024) raises switching costs. P3 mitigates via preferred networks, data‑sharing and selective insourcing.
| Supplier | Metric | Impact |
|---|---|---|
| Labs | 50–60% market share | Pricing power |
| Imaging | Up to 3x price variance | Scheduling/pricing leverage |
| Workforce | RN vacancy >10% (2024) | Wage inflation |
What is included in the product
 Detailed Word Document
Tailored Porter's Five Forces analysis for P3 Health Partners uncovering key drivers of competition, buyer and supplier influence on pricing and profitability, and barriers deterring new entrants. Identifies disruptive threats, substitutes, and strategic leverage points to protect market share and guide growth strategy.

 Customizable Excel Spreadsheet
P3 Health Partners Porter's Five Forces delivers a one-sheet, board-ready summary of competitive pressures to quickly relieve strategic uncertainty. Customize force intensities, swap in current data, and export clean visuals for decks or dashboards—no macros required.
Customers Bargaining Power

MA plan concentration
Medicare Advantage payers (UnitedHealth, Humana, CVS/Aetna) are highly concentrated—top three held roughly 55–60% of MA enrollment in 2024 and control negotiating leverage over ~30 million members. They press tight PMPM rates, risk-corridor terms and quality bonus extraction and run rigorous audits. Their scale enforces tougher contract clauses and payment timing. P3 must outperform on MLR and 4+ Stars to secure favorable economics.
Patient switching frictions
Members face plan lock-in, geography, and PCP continuity preferences that moderate individual switching power, though annual enrollment windows enable churn and broker steerage—Medicare Advantage voluntary turnover ran near 10% annually in 2023–24. High CAHPS ratings and strong access metrics correlate with lower attrition, reducing patient leverage. Consumer experience still influences payer steering decisions and broker recommendations.

Quality and Stars leverage
Payers prioritize partners that lift CMS Star Ratings and NCQA HEDIS outcomes; CMS continues to award quality bonus payments to plans scoring 4.0+ stars, and Medicare Advantage enrollment reached about 30 million in 2024, amplifying payers’ focus on measurable quality.

Data transparency demands
Plans demand granular risk, utilization, and outcomes reporting; 2024 CMS guidance tightened encounter and HEDIS submission rules, making timeliness and accuracy central to contract terms. Failure to meet standards erodes trust and triggers buyer audit rights and clawbacks. Robust analytics and compliance platforms reduce buyers' leverage by shortening reconciliation cycles and lowering error rates.
- Buyer leverage: audit rights, clawbacks
- 2024 focus: enhanced encounter/HEDIS reporting
- Risk: timeliness and accuracy
- Mitigation: analytics & compliance
Alternative provider options
Payers can shift membership to competing VBC platforms or health system groups, raising buyer leverage during renewals; Medicare Advantage enrollment surpassed 50% of beneficiaries in 2024, increasing payer bargaining clout. Availability of substitutes and concentrated market share among national insurers intensify pressure, while proven total-cost-of-care reductions remain the primary retention tool.
- Alternative platforms increase switching leverage
- MA >50% in 2024 boosts payer influence
- Insurer concentration magnifies renewal pressure
- Demonstrated TCO reduction is decisive
Top3 MA payers 55-60% control market and ~30M members
Large MA payers (top three 55–60% share) wield strong negotiating leverage over ~30M MA members in 2024, pressing PMPM, audits and clawbacks. Member switching is muted by network/PCP continuity but annual enrollment churn (~10% in 2023–24) and brokers preserve some leverage. Payers prioritize partners that raise CMS 4+ Star scores to secure bonus payments and better contract terms.
| Metric | 2024 Value |
|---|---|
| Top3 MA share | 55–60% |
| MA enrollment | ~30,000,000 |
| Annual churn | ~10% |
| Target | CMS 4+ Stars |
Preview Before You Purchase
P3 Health Partners Porter's Five Forces Analysis
This preview is the exact P3 Health Partners Porter's Five Forces analysis you'll receive after purchase—no samples or placeholders. The document shown is fully formatted, professionally written, and ready for immediate download and use. Once you complete your purchase, you’ll get instant access to this same file with all findings, charts, and conclusions intact.

Go Beyond the Preview—Access the Full Strategic Report
P3 Health Partners faces moderate supplier leverage, rising buyer expectations, and intense rivalry as value-based care models reshape pricing and margins. Emerging entrants and substitutes from telehealth and payer-integrated platforms increasingly pressure growth and differentiation. This brief snapshot only scratches the surface. Unlock the full Porter's Five Forces Analysis to explore P3 Health Partners’s competitive dynamics, market pressures, and strategic advantages in detail.
Suppliers Bargaining Power
PCP scarcity elevates leverage
Tight primary care supply in many P3 markets—AAMC projects ongoing PCP shortages through 2034—gives independent PCPs leverage over panel sizes, incentives and support services. High-performing PCPs who lower medical loss ratios are disproportionately valuable under value-based contracts, driving higher acquisition/affiliation costs and expanded bonus pools. P3 mitigates by offering shared savings, multidisciplinary care teams and technology enablement to retain providers.
Specialist and facility dependence
Value-based outcomes still hinge on downstream specialists, hospitals and post-acute providers to control total cost of care; concentrated hospital markets have driven commercial prices 20%+ above Medicare and can limit steerage. Narrow preferred networks and standardized care pathways can temper this power but referral leakage often runs 10–30%. Deep partnerships and robust data‑sharing agreements are critical to moderate supplier influence.
Health IT and data vendors
Health IT and data vendors for EHR, risk coding, analytics and interoperability are highly specialized and sticky, creating significant switching costs for P3. Vendor concentration in risk-adjustment and HEDIS/Stars tooling increases pricing power, especially as Medicare Advantage enrollment surpassed 30 million in 2024, raising stakes for accurate risk scores. Long-term contracts and complex integrations further entrench suppliers. P3 can mitigate by adopting modular architectures and building selective capabilities in-house.
Ancillary services and diagnostics
Labs, imaging centers, and home health agencies shape access and total-cost trends; top labs (Quest, LabCorp) account for about 50–60% of U.S. testing volume, and outpatient imaging prices can vary up to 3x across providers. In concentrated markets suppliers can push prices and scheduling priorities, while preferred networks and volume commitments secure better terms. Growth of at-home diagnostics and point-of-care testing is reducing dependence over time.
- Labs concentration ~50–60%: bargaining power
- Imaging price variation up to 3x: scheduling/pricing leverage
- Preferred networks/volume contracts improve terms; at‑home testing lowers long‑term dependence
Clinical workforce and staffing
Clinical workforce and staffing exert strong supplier power: nursing, MAs, care managers and coders remain constrained and inflationary, driving sustained wage pressure and higher turnover that increase operating costs and risk care continuity; agency and RCM vendors have expanded share and markups during shortages, with reports in 2024 showing RN vacancy rates above 10% and agency premium spend rising into double digits.
- Wage inflation: rising compensation increases unit labor costs
- Turnover: higher rehiring/training spend and continuity risk
- Agency/RCM leverage: short-term cost spikes and margin compression
- Mitigants: workforce pipelines and automation reduce supplier power over time
Tight PCP supply and concentrated hospitals fuel strong supplier leverage
Tight PCP supply (AAMC projects shortages through 2034) and concentrated hospitals (commercial prices ~20%+ above Medicare) give suppliers strong leverage; vendor stickiness (Medicare Advantage >30M enrollees in 2024) raises switching costs. P3 mitigates via preferred networks, data‑sharing and selective insourcing.
| Supplier | Metric | Impact |
|---|---|---|
| Labs | 50–60% market share | Pricing power |
| Imaging | Up to 3x price variance | Scheduling/pricing leverage |
| Workforce | RN vacancy >10% (2024) | Wage inflation |
What is included in the product
Detailed Word Document
Tailored Porter's Five Forces analysis for P3 Health Partners uncovering key drivers of competition, buyer and supplier influence on pricing and profitability, and barriers deterring new entrants. Identifies disruptive threats, substitutes, and strategic leverage points to protect market share and guide growth strategy.
Customizable Excel Spreadsheet
P3 Health Partners Porter's Five Forces delivers a one-sheet, board-ready summary of competitive pressures to quickly relieve strategic uncertainty. Customize force intensities, swap in current data, and export clean visuals for decks or dashboards—no macros required.
Customers Bargaining Power
MA plan concentration
Medicare Advantage payers (UnitedHealth, Humana, CVS/Aetna) are highly concentrated—top three held roughly 55–60% of MA enrollment in 2024 and control negotiating leverage over ~30 million members. They press tight PMPM rates, risk-corridor terms and quality bonus extraction and run rigorous audits. Their scale enforces tougher contract clauses and payment timing. P3 must outperform on MLR and 4+ Stars to secure favorable economics.
Patient switching frictions
Members face plan lock-in, geography, and PCP continuity preferences that moderate individual switching power, though annual enrollment windows enable churn and broker steerage—Medicare Advantage voluntary turnover ran near 10% annually in 2023–24. High CAHPS ratings and strong access metrics correlate with lower attrition, reducing patient leverage. Consumer experience still influences payer steering decisions and broker recommendations.
Quality and Stars leverage
Payers prioritize partners that lift CMS Star Ratings and NCQA HEDIS outcomes; CMS continues to award quality bonus payments to plans scoring 4.0+ stars, and Medicare Advantage enrollment reached about 30 million in 2024, amplifying payers’ focus on measurable quality.
Data transparency demands
Plans demand granular risk, utilization, and outcomes reporting; 2024 CMS guidance tightened encounter and HEDIS submission rules, making timeliness and accuracy central to contract terms. Failure to meet standards erodes trust and triggers buyer audit rights and clawbacks. Robust analytics and compliance platforms reduce buyers' leverage by shortening reconciliation cycles and lowering error rates.
- Buyer leverage: audit rights, clawbacks
- 2024 focus: enhanced encounter/HEDIS reporting
- Risk: timeliness and accuracy
- Mitigation: analytics & compliance
Alternative provider options
Payers can shift membership to competing VBC platforms or health system groups, raising buyer leverage during renewals; Medicare Advantage enrollment surpassed 50% of beneficiaries in 2024, increasing payer bargaining clout. Availability of substitutes and concentrated market share among national insurers intensify pressure, while proven total-cost-of-care reductions remain the primary retention tool.
- Alternative platforms increase switching leverage
- MA >50% in 2024 boosts payer influence
- Insurer concentration magnifies renewal pressure
- Demonstrated TCO reduction is decisive
Top3 MA payers 55-60% control market and ~30M members
Large MA payers (top three 55–60% share) wield strong negotiating leverage over ~30M MA members in 2024, pressing PMPM, audits and clawbacks. Member switching is muted by network/PCP continuity but annual enrollment churn (~10% in 2023–24) and brokers preserve some leverage. Payers prioritize partners that raise CMS 4+ Star scores to secure bonus payments and better contract terms.
| Metric | 2024 Value |
|---|---|
| Top3 MA share | 55–60% |
| MA enrollment | ~30,000,000 |
| Annual churn | ~10% |
| Target | CMS 4+ Stars |
Preview Before You Purchase
P3 Health Partners Porter's Five Forces Analysis
This preview is the exact P3 Health Partners Porter's Five Forces analysis you'll receive after purchase—no samples or placeholders. The document shown is fully formatted, professionally written, and ready for immediate download and use. Once you complete your purchase, you’ll get instant access to this same file with all findings, charts, and conclusions intact.
Original: $10.00
-65%$10.00
$3.50Description
Go Beyond the Preview—Access the Full Strategic Report
P3 Health Partners faces moderate supplier leverage, rising buyer expectations, and intense rivalry as value-based care models reshape pricing and margins. Emerging entrants and substitutes from telehealth and payer-integrated platforms increasingly pressure growth and differentiation. This brief snapshot only scratches the surface. Unlock the full Porter's Five Forces Analysis to explore P3 Health Partners’s competitive dynamics, market pressures, and strategic advantages in detail.
Suppliers Bargaining Power
PCP scarcity elevates leverage
Tight primary care supply in many P3 markets—AAMC projects ongoing PCP shortages through 2034—gives independent PCPs leverage over panel sizes, incentives and support services. High-performing PCPs who lower medical loss ratios are disproportionately valuable under value-based contracts, driving higher acquisition/affiliation costs and expanded bonus pools. P3 mitigates by offering shared savings, multidisciplinary care teams and technology enablement to retain providers.
Specialist and facility dependence
Value-based outcomes still hinge on downstream specialists, hospitals and post-acute providers to control total cost of care; concentrated hospital markets have driven commercial prices 20%+ above Medicare and can limit steerage. Narrow preferred networks and standardized care pathways can temper this power but referral leakage often runs 10–30%. Deep partnerships and robust data‑sharing agreements are critical to moderate supplier influence.
Health IT and data vendors
Health IT and data vendors for EHR, risk coding, analytics and interoperability are highly specialized and sticky, creating significant switching costs for P3. Vendor concentration in risk-adjustment and HEDIS/Stars tooling increases pricing power, especially as Medicare Advantage enrollment surpassed 30 million in 2024, raising stakes for accurate risk scores. Long-term contracts and complex integrations further entrench suppliers. P3 can mitigate by adopting modular architectures and building selective capabilities in-house.
Ancillary services and diagnostics
Labs, imaging centers, and home health agencies shape access and total-cost trends; top labs (Quest, LabCorp) account for about 50–60% of U.S. testing volume, and outpatient imaging prices can vary up to 3x across providers. In concentrated markets suppliers can push prices and scheduling priorities, while preferred networks and volume commitments secure better terms. Growth of at-home diagnostics and point-of-care testing is reducing dependence over time.
- Labs concentration ~50–60%: bargaining power
- Imaging price variation up to 3x: scheduling/pricing leverage
- Preferred networks/volume contracts improve terms; at‑home testing lowers long‑term dependence
Clinical workforce and staffing
Clinical workforce and staffing exert strong supplier power: nursing, MAs, care managers and coders remain constrained and inflationary, driving sustained wage pressure and higher turnover that increase operating costs and risk care continuity; agency and RCM vendors have expanded share and markups during shortages, with reports in 2024 showing RN vacancy rates above 10% and agency premium spend rising into double digits.
- Wage inflation: rising compensation increases unit labor costs
- Turnover: higher rehiring/training spend and continuity risk
- Agency/RCM leverage: short-term cost spikes and margin compression
- Mitigants: workforce pipelines and automation reduce supplier power over time
Tight PCP supply and concentrated hospitals fuel strong supplier leverage
Tight PCP supply (AAMC projects shortages through 2034) and concentrated hospitals (commercial prices ~20%+ above Medicare) give suppliers strong leverage; vendor stickiness (Medicare Advantage >30M enrollees in 2024) raises switching costs. P3 mitigates via preferred networks, data‑sharing and selective insourcing.
| Supplier | Metric | Impact |
|---|---|---|
| Labs | 50–60% market share | Pricing power |
| Imaging | Up to 3x price variance | Scheduling/pricing leverage |
| Workforce | RN vacancy >10% (2024) | Wage inflation |
What is included in the product
Detailed Word Document
Tailored Porter's Five Forces analysis for P3 Health Partners uncovering key drivers of competition, buyer and supplier influence on pricing and profitability, and barriers deterring new entrants. Identifies disruptive threats, substitutes, and strategic leverage points to protect market share and guide growth strategy.
Customizable Excel Spreadsheet
P3 Health Partners Porter's Five Forces delivers a one-sheet, board-ready summary of competitive pressures to quickly relieve strategic uncertainty. Customize force intensities, swap in current data, and export clean visuals for decks or dashboards—no macros required.
Customers Bargaining Power
MA plan concentration
Medicare Advantage payers (UnitedHealth, Humana, CVS/Aetna) are highly concentrated—top three held roughly 55–60% of MA enrollment in 2024 and control negotiating leverage over ~30 million members. They press tight PMPM rates, risk-corridor terms and quality bonus extraction and run rigorous audits. Their scale enforces tougher contract clauses and payment timing. P3 must outperform on MLR and 4+ Stars to secure favorable economics.
Patient switching frictions
Members face plan lock-in, geography, and PCP continuity preferences that moderate individual switching power, though annual enrollment windows enable churn and broker steerage—Medicare Advantage voluntary turnover ran near 10% annually in 2023–24. High CAHPS ratings and strong access metrics correlate with lower attrition, reducing patient leverage. Consumer experience still influences payer steering decisions and broker recommendations.
Quality and Stars leverage
Payers prioritize partners that lift CMS Star Ratings and NCQA HEDIS outcomes; CMS continues to award quality bonus payments to plans scoring 4.0+ stars, and Medicare Advantage enrollment reached about 30 million in 2024, amplifying payers’ focus on measurable quality.
Data transparency demands
Plans demand granular risk, utilization, and outcomes reporting; 2024 CMS guidance tightened encounter and HEDIS submission rules, making timeliness and accuracy central to contract terms. Failure to meet standards erodes trust and triggers buyer audit rights and clawbacks. Robust analytics and compliance platforms reduce buyers' leverage by shortening reconciliation cycles and lowering error rates.
- Buyer leverage: audit rights, clawbacks
- 2024 focus: enhanced encounter/HEDIS reporting
- Risk: timeliness and accuracy
- Mitigation: analytics & compliance
Alternative provider options
Payers can shift membership to competing VBC platforms or health system groups, raising buyer leverage during renewals; Medicare Advantage enrollment surpassed 50% of beneficiaries in 2024, increasing payer bargaining clout. Availability of substitutes and concentrated market share among national insurers intensify pressure, while proven total-cost-of-care reductions remain the primary retention tool.
- Alternative platforms increase switching leverage
- MA >50% in 2024 boosts payer influence
- Insurer concentration magnifies renewal pressure
- Demonstrated TCO reduction is decisive
Top3 MA payers 55-60% control market and ~30M members
Large MA payers (top three 55–60% share) wield strong negotiating leverage over ~30M MA members in 2024, pressing PMPM, audits and clawbacks. Member switching is muted by network/PCP continuity but annual enrollment churn (~10% in 2023–24) and brokers preserve some leverage. Payers prioritize partners that raise CMS 4+ Star scores to secure bonus payments and better contract terms.
| Metric | 2024 Value |
|---|---|
| Top3 MA share | 55–60% |
| MA enrollment | ~30,000,000 |
| Annual churn | ~10% |
| Target | CMS 4+ Stars |
Preview Before You Purchase
P3 Health Partners Porter's Five Forces Analysis
This preview is the exact P3 Health Partners Porter's Five Forces analysis you'll receive after purchase—no samples or placeholders. The document shown is fully formatted, professionally written, and ready for immediate download and use. Once you complete your purchase, you’ll get instant access to this same file with all findings, charts, and conclusions intact.











