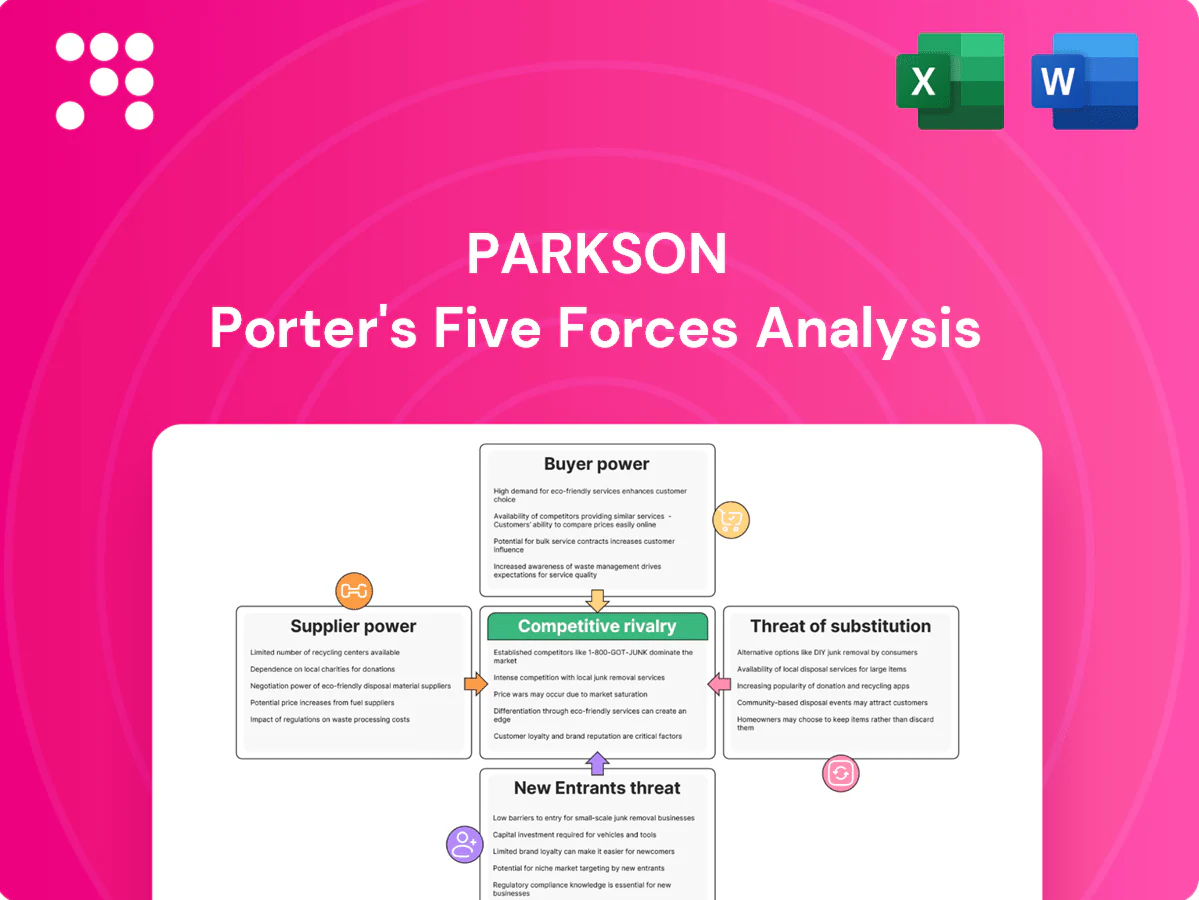
Parkson Porter's Five Forces Analysis

A Must-Have Tool for Decision-Makers
Parkson’s Porter's Five Forces snapshot highlights competitive rivalry, supplier and buyer leverage, threat of substitutes, and barriers to entry—revealing pressure points that shape profitability. This brief snapshot only scratches the surface. Unlock the full Porter's Five Forces Analysis to explore Parkson’s competitive dynamics in detail.
Suppliers Bargaining Power

Brand concentration in key categories
Global cosmetics and premium fashion labels command outsized leverage—global beauty was roughly $400bn in 2024 and top groups capture an estimated ~60% of sales—so Parkson must secure marquee labels to drive footfall, increasing vendor power. Exclusive distribution deals further limit pricing flexibility and margin control, while diversifying into local/regional brands can partially offset dependence and compress supplier leverage.
Private label and concession mix
Concession models shift inventory risk to suppliers while ceding pricing and merchandising control, leaving Parkson exposed to vendor-led assortment decisions and margin pressure; concession sales accounted for roughly 30% of in-store turnover in comparable Asian department stores in 2024. Private label can cut supplier dependence and boost gross margins by about 200–400 basis points but demands design, sourcing and QC investment. The concession/private-label mix directly shapes negotiating leverage, and scaling private label from low-single digits toward double-digit penetration (eg, 5% to 15%) materially rebalances supplier power across markets.

Supply chain and logistics complexity
Multi-country operations expose Parkson to import tariffs and compliance fees that commonly add 5–20% to landed costs, which suppliers can pass through; currency swings in 2024 — with the USD remaining strong vs. several regional currencies — further boosted supplier leverage on imported goods. Consolidated procurement and centralized negotiations have reduced vendor price dispersion and can cut procurement unit costs by several percent. Nearshoring and regional sourcing in 2024 shortened lead times and improved leverage across key product categories.

Switching costs for curated assortments
Replacing anchor brands risks sales disruption and customer churn, often shifting 20–40% of category traffic and raising perceived switching costs for Parkson.
Vendor onboarding lead times of 8–12 weeks limit agility; long-standing suppliers secure better allocations and occasional exclusives, improving sell-through by up to 10%.
Data-sharing and joint merchandising plans allow suppliers to trade promotional discounts or margin concessions for premium shelf space and co-marketing.
- anchor-share: 20–40%
- onboarding-time: 8–12 weeks
- exclusive-lift: ~10%
- data-for-space: negotiated concessions
Supplier access to alternative channels
Brands increasingly sell direct via e-commerce and mono-brand stores, with global e-commerce reaching about 23% of retail sales in 2024, reducing dependence on department stores and boosting suppliers’ leverage over margin and marketing support.
- Direct channels ↑ supplier outside options
- 23% global e-commerce (2024)
- Parkson must offer omnichannel traffic & experiential value
- Co-marketing & loyalty integration align incentives
Supplier power strong; e-commerce rise, private-label +200-400bps GM, 5-20% tariff risk
Supplier power is high: marquee global beauty/fashion labels (global beauty ~$400bn in 2024; top groups ≈60% share) and rising direct e-commerce (≈23% of retail sales in 2024) limit Parkson’s pricing control; concession models (~30% in-store turnover) shift inventory risk. Consolidated procurement, private label (potential +200–400bps GM) and nearshoring reduce leverage; tariffs/currency add 5–20% landed cost risk.
| Metric | 2024 |
|---|---|
| Global beauty | $400bn |
| Top groups share | ~60% |
| E‑commerce | 23% |
| Concession turnover | ~30% |
| Private‑label GM lift | 200–400bps |
| Tariff/cost impact | 5–20% |
What is included in the product
 Detailed Word Document
Parkson Porter’s Five Forces analysis uncovers key drivers of competition, buyer and supplier power, threats from substitutes and new entrants, and disruptive pressures on market share — tailored to Parkson with strategic commentary and editable Word-ready findings for investor decks, business plans, or internal strategy use.

 Customizable Excel Spreadsheet
Parkson Porter's Five Forces distills competitive pressure into a single, actionable sheet—instantly highlighting threats and opportunities so teams can prioritize strategic responses and relieve decision-making bottlenecks.
Customers Bargaining Power

Price-sensitive mass market shoppers
Price-sensitive mass-market shoppers in Malaysia, Vietnam and Cambodia amplify price elasticity, with e-commerce accounting for roughly 8% of retail sales in Southeast Asia in 2024, increasing price transparency. Frequent sector-wide promotions train buyers to delay purchases for discounts, while easy online price comparison—used by over 60% of shoppers—strengthens buyer leverage. Targeted loyalty programs and bundled offers can partially moderate sensitivity.
Abundant channel alternatives
Shoppers easily switch from Parkson to specialty retailers, fast-fashion chains, marketplaces and brand e-stores, with global e-commerce accounting for about 21% of retail sales in 2024, boosting buyer leverage. Low switching costs and average online return rates near 18% heighten price and service pressure. Click-and-collect and lenient returns materially shape channel choice, while curated in-store experiences and higher service quality remain key differentiation levers.

Information symmetry via digital
Mobile price comparisons and reviews have given customers leverage: in 2024 about 70% of shoppers used mobile to compare prices, shrinking information gaps on quality and price. Buyers now negotiate with their feet across platforms and stores, and omnichannel consistency is critical to prevent arbitrage as omnichannel shoppers spend roughly 3x more. Real-time pricing and inventory transparency can boost conversion by up to 30% and retain trust.

Demand for assortment and freshness
Customers now demand rapid refresh cycles in fashion and beauty; McKinsey 2024 finds personalization can boost sales 10–30%, making slow inventory turns cost retailers through markdowns and churn. Data-driven, store-level assortment meets micro-market needs, while exclusive drops and limited editions reduce direct comparability and support higher margins.
- High refresh expectation — personalization lifts sales 10–30% (McKinsey 2024)
- Slow turns → markdowns, lost loyalty
- Store-level data tailoring meets micro-markets
- Exclusive drops reduce comparability, protect margins
Loyalty and experiential expectations
- Loyalty spend uplift ~20%
- Services-driven retention
- Events/beauty boost frequency
- Cross-border rewards aid regional traffic
SEA shoppers: 70% mobile compares, personalization 10-30% lift
Price-sensitive SEA shoppers and 8% e-commerce penetration (2024) increase price elasticity; >60% use online price comparison and 70% use mobile (2024), raising buyer leverage. Low switching costs and ~18% online return rates force service/price pressure; loyalty lifts spend ~20% and can reduce churn. Rapid refresh cycles and personalization (10–30% uplift) favor agile retailers.
| Metric | 2024 value |
|---|---|
| SEA e‑commerce penetration | 8% |
| Global e‑commerce | 21% |
| Mobile price compare | 70% |
| Online price comparison users | >60% |
| Online return rate | ~18% |
| Loyalty spend uplift | ~20% |
| Personalization sales uplift | 10–30% |
Preview Before You Purchase
Parkson Porter's Five Forces Analysis
This preview shows the exact Parkson Porter's Five Forces Analysis you'll receive after purchase—fully formatted and ready to use. There are no mockups or placeholders; the file displayed is the final deliverable. Buy and download instantly to access the same comprehensive, professionally written document.

A Must-Have Tool for Decision-Makers
Parkson’s Porter's Five Forces snapshot highlights competitive rivalry, supplier and buyer leverage, threat of substitutes, and barriers to entry—revealing pressure points that shape profitability. This brief snapshot only scratches the surface. Unlock the full Porter's Five Forces Analysis to explore Parkson’s competitive dynamics in detail.
Suppliers Bargaining Power
Brand concentration in key categories
Global cosmetics and premium fashion labels command outsized leverage—global beauty was roughly $400bn in 2024 and top groups capture an estimated ~60% of sales—so Parkson must secure marquee labels to drive footfall, increasing vendor power. Exclusive distribution deals further limit pricing flexibility and margin control, while diversifying into local/regional brands can partially offset dependence and compress supplier leverage.
Private label and concession mix
Concession models shift inventory risk to suppliers while ceding pricing and merchandising control, leaving Parkson exposed to vendor-led assortment decisions and margin pressure; concession sales accounted for roughly 30% of in-store turnover in comparable Asian department stores in 2024. Private label can cut supplier dependence and boost gross margins by about 200–400 basis points but demands design, sourcing and QC investment. The concession/private-label mix directly shapes negotiating leverage, and scaling private label from low-single digits toward double-digit penetration (eg, 5% to 15%) materially rebalances supplier power across markets.
Supply chain and logistics complexity
Multi-country operations expose Parkson to import tariffs and compliance fees that commonly add 5–20% to landed costs, which suppliers can pass through; currency swings in 2024 — with the USD remaining strong vs. several regional currencies — further boosted supplier leverage on imported goods. Consolidated procurement and centralized negotiations have reduced vendor price dispersion and can cut procurement unit costs by several percent. Nearshoring and regional sourcing in 2024 shortened lead times and improved leverage across key product categories.
Switching costs for curated assortments
Replacing anchor brands risks sales disruption and customer churn, often shifting 20–40% of category traffic and raising perceived switching costs for Parkson.
Vendor onboarding lead times of 8–12 weeks limit agility; long-standing suppliers secure better allocations and occasional exclusives, improving sell-through by up to 10%.
Data-sharing and joint merchandising plans allow suppliers to trade promotional discounts or margin concessions for premium shelf space and co-marketing.
- anchor-share: 20–40%
- onboarding-time: 8–12 weeks
- exclusive-lift: ~10%
- data-for-space: negotiated concessions
Supplier access to alternative channels
Brands increasingly sell direct via e-commerce and mono-brand stores, with global e-commerce reaching about 23% of retail sales in 2024, reducing dependence on department stores and boosting suppliers’ leverage over margin and marketing support.
- Direct channels ↑ supplier outside options
- 23% global e-commerce (2024)
- Parkson must offer omnichannel traffic & experiential value
- Co-marketing & loyalty integration align incentives
Supplier power strong; e-commerce rise, private-label +200-400bps GM, 5-20% tariff risk
Supplier power is high: marquee global beauty/fashion labels (global beauty ~$400bn in 2024; top groups ≈60% share) and rising direct e-commerce (≈23% of retail sales in 2024) limit Parkson’s pricing control; concession models (~30% in-store turnover) shift inventory risk. Consolidated procurement, private label (potential +200–400bps GM) and nearshoring reduce leverage; tariffs/currency add 5–20% landed cost risk.
| Metric | 2024 |
|---|---|
| Global beauty | $400bn |
| Top groups share | ~60% |
| E‑commerce | 23% |
| Concession turnover | ~30% |
| Private‑label GM lift | 200–400bps |
| Tariff/cost impact | 5–20% |
What is included in the product
Detailed Word Document
Parkson Porter’s Five Forces analysis uncovers key drivers of competition, buyer and supplier power, threats from substitutes and new entrants, and disruptive pressures on market share — tailored to Parkson with strategic commentary and editable Word-ready findings for investor decks, business plans, or internal strategy use.
Customizable Excel Spreadsheet
Parkson Porter's Five Forces distills competitive pressure into a single, actionable sheet—instantly highlighting threats and opportunities so teams can prioritize strategic responses and relieve decision-making bottlenecks.
Customers Bargaining Power
Price-sensitive mass market shoppers
Price-sensitive mass-market shoppers in Malaysia, Vietnam and Cambodia amplify price elasticity, with e-commerce accounting for roughly 8% of retail sales in Southeast Asia in 2024, increasing price transparency. Frequent sector-wide promotions train buyers to delay purchases for discounts, while easy online price comparison—used by over 60% of shoppers—strengthens buyer leverage. Targeted loyalty programs and bundled offers can partially moderate sensitivity.
Abundant channel alternatives
Shoppers easily switch from Parkson to specialty retailers, fast-fashion chains, marketplaces and brand e-stores, with global e-commerce accounting for about 21% of retail sales in 2024, boosting buyer leverage. Low switching costs and average online return rates near 18% heighten price and service pressure. Click-and-collect and lenient returns materially shape channel choice, while curated in-store experiences and higher service quality remain key differentiation levers.
Information symmetry via digital
Mobile price comparisons and reviews have given customers leverage: in 2024 about 70% of shoppers used mobile to compare prices, shrinking information gaps on quality and price. Buyers now negotiate with their feet across platforms and stores, and omnichannel consistency is critical to prevent arbitrage as omnichannel shoppers spend roughly 3x more. Real-time pricing and inventory transparency can boost conversion by up to 30% and retain trust.
Demand for assortment and freshness
Customers now demand rapid refresh cycles in fashion and beauty; McKinsey 2024 finds personalization can boost sales 10–30%, making slow inventory turns cost retailers through markdowns and churn. Data-driven, store-level assortment meets micro-market needs, while exclusive drops and limited editions reduce direct comparability and support higher margins.
- High refresh expectation — personalization lifts sales 10–30% (McKinsey 2024)
- Slow turns → markdowns, lost loyalty
- Store-level data tailoring meets micro-markets
- Exclusive drops reduce comparability, protect margins
Loyalty and experiential expectations
- Loyalty spend uplift ~20%
- Services-driven retention
- Events/beauty boost frequency
- Cross-border rewards aid regional traffic
SEA shoppers: 70% mobile compares, personalization 10-30% lift
Price-sensitive SEA shoppers and 8% e-commerce penetration (2024) increase price elasticity; >60% use online price comparison and 70% use mobile (2024), raising buyer leverage. Low switching costs and ~18% online return rates force service/price pressure; loyalty lifts spend ~20% and can reduce churn. Rapid refresh cycles and personalization (10–30% uplift) favor agile retailers.
| Metric | 2024 value |
|---|---|
| SEA e‑commerce penetration | 8% |
| Global e‑commerce | 21% |
| Mobile price compare | 70% |
| Online price comparison users | >60% |
| Online return rate | ~18% |
| Loyalty spend uplift | ~20% |
| Personalization sales uplift | 10–30% |
Preview Before You Purchase
Parkson Porter's Five Forces Analysis
This preview shows the exact Parkson Porter's Five Forces Analysis you'll receive after purchase—fully formatted and ready to use. There are no mockups or placeholders; the file displayed is the final deliverable. Buy and download instantly to access the same comprehensive, professionally written document.
Original: $10.00
-65%$10.00
$3.50Description
A Must-Have Tool for Decision-Makers
Parkson’s Porter's Five Forces snapshot highlights competitive rivalry, supplier and buyer leverage, threat of substitutes, and barriers to entry—revealing pressure points that shape profitability. This brief snapshot only scratches the surface. Unlock the full Porter's Five Forces Analysis to explore Parkson’s competitive dynamics in detail.
Suppliers Bargaining Power
Brand concentration in key categories
Global cosmetics and premium fashion labels command outsized leverage—global beauty was roughly $400bn in 2024 and top groups capture an estimated ~60% of sales—so Parkson must secure marquee labels to drive footfall, increasing vendor power. Exclusive distribution deals further limit pricing flexibility and margin control, while diversifying into local/regional brands can partially offset dependence and compress supplier leverage.
Private label and concession mix
Concession models shift inventory risk to suppliers while ceding pricing and merchandising control, leaving Parkson exposed to vendor-led assortment decisions and margin pressure; concession sales accounted for roughly 30% of in-store turnover in comparable Asian department stores in 2024. Private label can cut supplier dependence and boost gross margins by about 200–400 basis points but demands design, sourcing and QC investment. The concession/private-label mix directly shapes negotiating leverage, and scaling private label from low-single digits toward double-digit penetration (eg, 5% to 15%) materially rebalances supplier power across markets.
Supply chain and logistics complexity
Multi-country operations expose Parkson to import tariffs and compliance fees that commonly add 5–20% to landed costs, which suppliers can pass through; currency swings in 2024 — with the USD remaining strong vs. several regional currencies — further boosted supplier leverage on imported goods. Consolidated procurement and centralized negotiations have reduced vendor price dispersion and can cut procurement unit costs by several percent. Nearshoring and regional sourcing in 2024 shortened lead times and improved leverage across key product categories.
Switching costs for curated assortments
Replacing anchor brands risks sales disruption and customer churn, often shifting 20–40% of category traffic and raising perceived switching costs for Parkson.
Vendor onboarding lead times of 8–12 weeks limit agility; long-standing suppliers secure better allocations and occasional exclusives, improving sell-through by up to 10%.
Data-sharing and joint merchandising plans allow suppliers to trade promotional discounts or margin concessions for premium shelf space and co-marketing.
- anchor-share: 20–40%
- onboarding-time: 8–12 weeks
- exclusive-lift: ~10%
- data-for-space: negotiated concessions
Supplier access to alternative channels
Brands increasingly sell direct via e-commerce and mono-brand stores, with global e-commerce reaching about 23% of retail sales in 2024, reducing dependence on department stores and boosting suppliers’ leverage over margin and marketing support.
- Direct channels ↑ supplier outside options
- 23% global e-commerce (2024)
- Parkson must offer omnichannel traffic & experiential value
- Co-marketing & loyalty integration align incentives
Supplier power strong; e-commerce rise, private-label +200-400bps GM, 5-20% tariff risk
Supplier power is high: marquee global beauty/fashion labels (global beauty ~$400bn in 2024; top groups ≈60% share) and rising direct e-commerce (≈23% of retail sales in 2024) limit Parkson’s pricing control; concession models (~30% in-store turnover) shift inventory risk. Consolidated procurement, private label (potential +200–400bps GM) and nearshoring reduce leverage; tariffs/currency add 5–20% landed cost risk.
| Metric | 2024 |
|---|---|
| Global beauty | $400bn |
| Top groups share | ~60% |
| E‑commerce | 23% |
| Concession turnover | ~30% |
| Private‑label GM lift | 200–400bps |
| Tariff/cost impact | 5–20% |
What is included in the product
Detailed Word Document
Parkson Porter’s Five Forces analysis uncovers key drivers of competition, buyer and supplier power, threats from substitutes and new entrants, and disruptive pressures on market share — tailored to Parkson with strategic commentary and editable Word-ready findings for investor decks, business plans, or internal strategy use.
Customizable Excel Spreadsheet
Parkson Porter's Five Forces distills competitive pressure into a single, actionable sheet—instantly highlighting threats and opportunities so teams can prioritize strategic responses and relieve decision-making bottlenecks.
Customers Bargaining Power
Price-sensitive mass market shoppers
Price-sensitive mass-market shoppers in Malaysia, Vietnam and Cambodia amplify price elasticity, with e-commerce accounting for roughly 8% of retail sales in Southeast Asia in 2024, increasing price transparency. Frequent sector-wide promotions train buyers to delay purchases for discounts, while easy online price comparison—used by over 60% of shoppers—strengthens buyer leverage. Targeted loyalty programs and bundled offers can partially moderate sensitivity.
Abundant channel alternatives
Shoppers easily switch from Parkson to specialty retailers, fast-fashion chains, marketplaces and brand e-stores, with global e-commerce accounting for about 21% of retail sales in 2024, boosting buyer leverage. Low switching costs and average online return rates near 18% heighten price and service pressure. Click-and-collect and lenient returns materially shape channel choice, while curated in-store experiences and higher service quality remain key differentiation levers.
Information symmetry via digital
Mobile price comparisons and reviews have given customers leverage: in 2024 about 70% of shoppers used mobile to compare prices, shrinking information gaps on quality and price. Buyers now negotiate with their feet across platforms and stores, and omnichannel consistency is critical to prevent arbitrage as omnichannel shoppers spend roughly 3x more. Real-time pricing and inventory transparency can boost conversion by up to 30% and retain trust.
Demand for assortment and freshness
Customers now demand rapid refresh cycles in fashion and beauty; McKinsey 2024 finds personalization can boost sales 10–30%, making slow inventory turns cost retailers through markdowns and churn. Data-driven, store-level assortment meets micro-market needs, while exclusive drops and limited editions reduce direct comparability and support higher margins.
- High refresh expectation — personalization lifts sales 10–30% (McKinsey 2024)
- Slow turns → markdowns, lost loyalty
- Store-level data tailoring meets micro-markets
- Exclusive drops reduce comparability, protect margins
Loyalty and experiential expectations
- Loyalty spend uplift ~20%
- Services-driven retention
- Events/beauty boost frequency
- Cross-border rewards aid regional traffic
SEA shoppers: 70% mobile compares, personalization 10-30% lift
Price-sensitive SEA shoppers and 8% e-commerce penetration (2024) increase price elasticity; >60% use online price comparison and 70% use mobile (2024), raising buyer leverage. Low switching costs and ~18% online return rates force service/price pressure; loyalty lifts spend ~20% and can reduce churn. Rapid refresh cycles and personalization (10–30% uplift) favor agile retailers.
| Metric | 2024 value |
|---|---|
| SEA e‑commerce penetration | 8% |
| Global e‑commerce | 21% |
| Mobile price compare | 70% |
| Online price comparison users | >60% |
| Online return rate | ~18% |
| Loyalty spend uplift | ~20% |
| Personalization sales uplift | 10–30% |
Preview Before You Purchase
Parkson Porter's Five Forces Analysis
This preview shows the exact Parkson Porter's Five Forces Analysis you'll receive after purchase—fully formatted and ready to use. There are no mockups or placeholders; the file displayed is the final deliverable. Buy and download instantly to access the same comprehensive, professionally written document.











