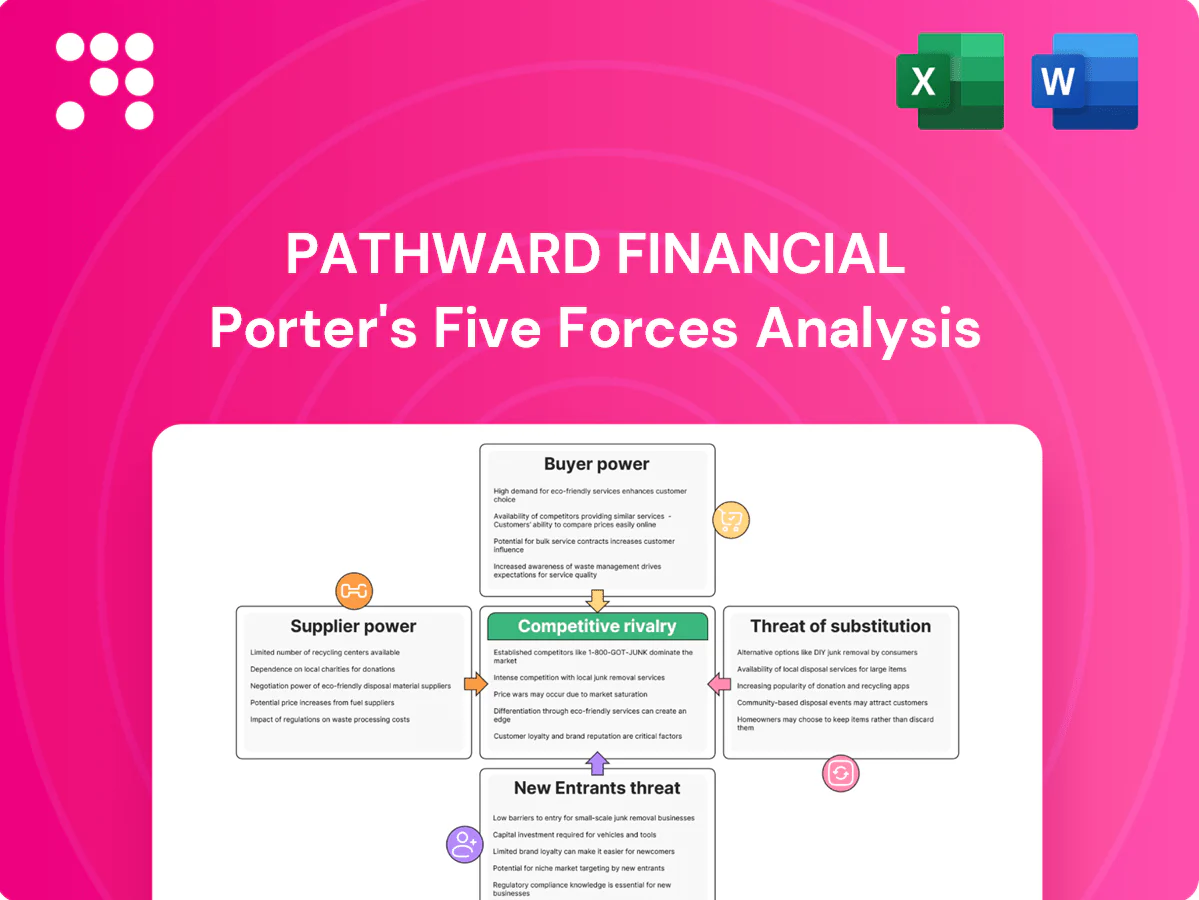
Pathward Financial Porter's Five Forces Analysis

A Must-Have Tool for Decision-Makers
Pathward Financial operates in a competitive niche where customer concentration, regulatory oversight, and fintech disruption shape margins and growth prospects. This snapshot highlights buyer power, supplier influence, substitution risk, and entry threats to frame strategic priorities. This brief only scratches the surface; unlock the full Porter's Five Forces Analysis to explore Pathward Financial’s competitive dynamics, market pressures, and strategic advantages in detail.
Suppliers Bargaining Power

Concentrated tech vendors
Pathward depends on a few core processors and cloud providers (AWS ~32%, Azure ~22%, Google ~11% in 2024) and dominant card networks, giving suppliers pricing and roadmap leverage. Visa and Mastercard control roughly 80%+ of global card volume, and their network rules are non-negotiable, constraining product design. Service outages or contract changes can compress margins and harm reliability almost immediately.
Funding and deposits
Low-cost deposits underpin Pathward’s BaaS and lending pipelines; as of mid-2024 Pathward reported roughly $6.9 billion in total deposits, making stable retail funding a critical input and competitive battleground.
Rising competition for sticky deposits pushed interest expense and promotional offers higher in 2023–24, with average deposit rates across the industry climbing into the low-single-digit range and pressuring net interest margins.
Wholesale funding provides flexibility and funded about 15–25% of Pathward-like balance sheets in 2024, but it brings higher rate and rollover risk compared with core deposits.
Liquidity and prudential rules (eg, LCR and NSFR pressures) in 2024 limited rapid substitution between deposit and wholesale sources, constraining funding mix choices under stress.

Data/KYC/AML providers
Third-party identity verification and AML providers (eg LexisNexis Risk, Experian, TransUnion, Socure, Ekata) are essential to onboard fintech customers at scale and concentrate bargaining power; industry lookup fees typically range from $0.10–$2.00 per check, with monthly minimums and throttling that can materially raise unit costs and cap growth. Integration complexity and proprietary data sets further increase switching costs for Pathward.

Payment rails and processors
Payment rails and processors (ACH, RTP, card networks, sponsor processors) set fees, dispute regimes and certification gates that feed directly into Pathward program economics; fee or rule changes in 2024 translate immediately to margins and pricing, while faster-payments access commonly requires multi-month certification and integration cycles; supplier SLAs shape client uptime commitments and penalty exposure.
- Fees & rules set by card networks and sponsors
- Certification timelines for RTP/FedNow often span months
- Rule changes flow into program economics in 2024
- Supplier SLAs drive uptime and contractual risk
Regulatory compliance services
External counsel, audit firms, and specialized compliance platforms provide bank-grade oversight for Pathward; heightened BaaS scrutiny in 2024 has increased reliance on these suppliers and concentrated demand on top providers. Capacity constraints at leading firms often create multi-week to multi-month wait times, raising fees and delaying client launches and revenue ramps.
- Concentration risk: top firms serve hundreds of banks
- Cost pressure: premium rates from scarce capacity
- Time-to-market: onboarding delays slow revenue realization
Concentrated cloud and card vendor power plus funding mix compress margins and raise switching costs
Pathward faces concentrated supplier power in cloud/processing (AWS ~32%, Azure ~22%, Google ~11% in 2024), dominant card networks (~80%+ volume) and identity/AML vendors (lookup fees $0.10–$2.00), which compress pricing flexibility and raise switching costs. Stable retail deposits ($6.9B mid‑2024) are critical but competition and higher deposit rates tightened margins; wholesale funding (15–25%) adds rollover risk under LCR/NSFR constraints.
| Supplier | 2024 Metric |
|---|---|
| Cloud/processing | AWS 32% / Azure 22% / Google 11% |
| Deposits | $6.9B (mid‑2024) |
| Card networks | ~80%+ global volume |
What is included in the product
 Detailed Word Document
Comprehensive Porter’s Five Forces analysis tailored for Pathward Financial, highlighting competitive intensity, buyer and supplier power, threat of new entrants and substitutes, and strategic levers to protect margins and market position.

 Customizable Excel Spreadsheet
Quick, one-sheet Porter's Five Forces for Pathward Financial relieves strategic uncertainty—customizable pressure levels, radar visualization, and clean layout make it easy to update scenarios, share in decks, and integrate with reports without any coding.
Customers Bargaining Power

Concentrated fintech clients
As of 2024, Pathward's BaaS revenue is often concentrated among a handful of large program managers and platforms, who use referenceability and scale to demand favorable terms. These buyers negotiate aggressively on pricing, revenue share, and marketing funds, and losing a top client can materially reduce volumes and fee income. In RFPs, large platforms wield disproportionate leverage given their ability to shift scale quickly.
Multihoming and switching
In 2024 over 60% of fintechs dual-source sponsor banks to reduce concentration risk, while API intermediaries have cut migration friction—industry estimates show up to a 40% reduction in integration time—expanding buyer options. Still, compliance re-underwriting and re-tokenization introduce 2–6 week delays and operational costs, and the credible threat of switching continues to compress pricing and tighten service SLAs by an estimated 5–10%.

Price sensitivity
Clients scrutinize every basis point on interchange splits, ledger fees, KYC costs, and float, often pushing for 50–200 bps on interchange in 2024 RFP benchmarks. Competitive benchmarks are widely known via RFPs and advisors, increasing transparency and negotiation leverage. Volume discounts and minimum guarantees are common asks, with large-deal concessions driving margin compression risk in major contracts.

Demand for speed and uptime
Buyers demand fast onboarding, high SLA uptime and rapid roadmap velocity, using SLA credits and termination-for-cause clauses as contractual leverage; feature gaps are leverage to push concessions while superior service can reduce price pressure but increases operating costs. 99.9% uptime equals ~8.76 hours annual downtime, 99.99% ~52.6 minutes.
- Onboarding speed
- SLA uptime (99.9% vs 99.99%)
- Roadmap velocity
- Contractual leverage: credits/termination
- Service quality vs operating cost
Regulatory burden shifting
Clients increasingly expect banks to absorb compliance oversight and audits; 2024 surveys show about 60% of corporate clients prefer providers to own regulatory responsibility, while 45% reported renegotiating contracts due to misaligned risk appetites. Expanded monitoring often increases scope without higher fees, and buyers pressure for standardized controls to scale faster.
- Regulatory-shift: client absorbance 60%
- Fee-pressure: scope up, fees flat
- Standardization: faster scaling
- Churn-risk: 45% renegotiations
Concentrated BaaS buyers wield pricing power; dual-sourcing, APIs squeeze fees
Pathward's BaaS buyers are concentrated and exert strong pricing leverage; losing a top client can materially cut fee income. 2024 trends: >60% of fintechs dual‑source, APIs cut integration time up to 40% but switching still incurs 2–6 week re‑underwriting delays, compressing pricing by ~5–10% and prompting 50–200 bps demands on interchange. 60% of clients want banks to assume regulatory oversight; 45% renegotiated contracts in 2024.
| Metric | 2024 Value |
|---|---|
| Fintechs dual‑sourcing | >60% |
| API integration time reduction | up to 40% |
| Switching delay | 2–6 weeks |
| Price compression | 5–10% |
| Interchange pressure | 50–200 bps |
| Clients want bank compliance | 60% |
| Contract renegotiations | 45% |
Full Version Awaits
Pathward Financial Porter's Five Forces Analysis
This preview shows the full Porter’s Five Forces analysis of Pathward Financial — assessing competitive rivalry, threat of new entrants, buyer and supplier power, and substitutes — and is the exact document you'll receive after purchase. No placeholders or samples: the file is fully formatted, ready to download and use immediately upon payment.

A Must-Have Tool for Decision-Makers
Pathward Financial operates in a competitive niche where customer concentration, regulatory oversight, and fintech disruption shape margins and growth prospects. This snapshot highlights buyer power, supplier influence, substitution risk, and entry threats to frame strategic priorities. This brief only scratches the surface; unlock the full Porter's Five Forces Analysis to explore Pathward Financial’s competitive dynamics, market pressures, and strategic advantages in detail.
Suppliers Bargaining Power
Concentrated tech vendors
Pathward depends on a few core processors and cloud providers (AWS ~32%, Azure ~22%, Google ~11% in 2024) and dominant card networks, giving suppliers pricing and roadmap leverage. Visa and Mastercard control roughly 80%+ of global card volume, and their network rules are non-negotiable, constraining product design. Service outages or contract changes can compress margins and harm reliability almost immediately.
Funding and deposits
Low-cost deposits underpin Pathward’s BaaS and lending pipelines; as of mid-2024 Pathward reported roughly $6.9 billion in total deposits, making stable retail funding a critical input and competitive battleground.
Rising competition for sticky deposits pushed interest expense and promotional offers higher in 2023–24, with average deposit rates across the industry climbing into the low-single-digit range and pressuring net interest margins.
Wholesale funding provides flexibility and funded about 15–25% of Pathward-like balance sheets in 2024, but it brings higher rate and rollover risk compared with core deposits.
Liquidity and prudential rules (eg, LCR and NSFR pressures) in 2024 limited rapid substitution between deposit and wholesale sources, constraining funding mix choices under stress.
Data/KYC/AML providers
Third-party identity verification and AML providers (eg LexisNexis Risk, Experian, TransUnion, Socure, Ekata) are essential to onboard fintech customers at scale and concentrate bargaining power; industry lookup fees typically range from $0.10–$2.00 per check, with monthly minimums and throttling that can materially raise unit costs and cap growth. Integration complexity and proprietary data sets further increase switching costs for Pathward.
Payment rails and processors
Payment rails and processors (ACH, RTP, card networks, sponsor processors) set fees, dispute regimes and certification gates that feed directly into Pathward program economics; fee or rule changes in 2024 translate immediately to margins and pricing, while faster-payments access commonly requires multi-month certification and integration cycles; supplier SLAs shape client uptime commitments and penalty exposure.
- Fees & rules set by card networks and sponsors
- Certification timelines for RTP/FedNow often span months
- Rule changes flow into program economics in 2024
- Supplier SLAs drive uptime and contractual risk
Regulatory compliance services
External counsel, audit firms, and specialized compliance platforms provide bank-grade oversight for Pathward; heightened BaaS scrutiny in 2024 has increased reliance on these suppliers and concentrated demand on top providers. Capacity constraints at leading firms often create multi-week to multi-month wait times, raising fees and delaying client launches and revenue ramps.
- Concentration risk: top firms serve hundreds of banks
- Cost pressure: premium rates from scarce capacity
- Time-to-market: onboarding delays slow revenue realization
Concentrated cloud and card vendor power plus funding mix compress margins and raise switching costs
Pathward faces concentrated supplier power in cloud/processing (AWS ~32%, Azure ~22%, Google ~11% in 2024), dominant card networks (~80%+ volume) and identity/AML vendors (lookup fees $0.10–$2.00), which compress pricing flexibility and raise switching costs. Stable retail deposits ($6.9B mid‑2024) are critical but competition and higher deposit rates tightened margins; wholesale funding (15–25%) adds rollover risk under LCR/NSFR constraints.
| Supplier | 2024 Metric |
|---|---|
| Cloud/processing | AWS 32% / Azure 22% / Google 11% |
| Deposits | $6.9B (mid‑2024) |
| Card networks | ~80%+ global volume |
What is included in the product
Detailed Word Document
Comprehensive Porter’s Five Forces analysis tailored for Pathward Financial, highlighting competitive intensity, buyer and supplier power, threat of new entrants and substitutes, and strategic levers to protect margins and market position.
Customizable Excel Spreadsheet
Quick, one-sheet Porter's Five Forces for Pathward Financial relieves strategic uncertainty—customizable pressure levels, radar visualization, and clean layout make it easy to update scenarios, share in decks, and integrate with reports without any coding.
Customers Bargaining Power
Concentrated fintech clients
As of 2024, Pathward's BaaS revenue is often concentrated among a handful of large program managers and platforms, who use referenceability and scale to demand favorable terms. These buyers negotiate aggressively on pricing, revenue share, and marketing funds, and losing a top client can materially reduce volumes and fee income. In RFPs, large platforms wield disproportionate leverage given their ability to shift scale quickly.
Multihoming and switching
In 2024 over 60% of fintechs dual-source sponsor banks to reduce concentration risk, while API intermediaries have cut migration friction—industry estimates show up to a 40% reduction in integration time—expanding buyer options. Still, compliance re-underwriting and re-tokenization introduce 2–6 week delays and operational costs, and the credible threat of switching continues to compress pricing and tighten service SLAs by an estimated 5–10%.
Price sensitivity
Clients scrutinize every basis point on interchange splits, ledger fees, KYC costs, and float, often pushing for 50–200 bps on interchange in 2024 RFP benchmarks. Competitive benchmarks are widely known via RFPs and advisors, increasing transparency and negotiation leverage. Volume discounts and minimum guarantees are common asks, with large-deal concessions driving margin compression risk in major contracts.
Demand for speed and uptime
Buyers demand fast onboarding, high SLA uptime and rapid roadmap velocity, using SLA credits and termination-for-cause clauses as contractual leverage; feature gaps are leverage to push concessions while superior service can reduce price pressure but increases operating costs. 99.9% uptime equals ~8.76 hours annual downtime, 99.99% ~52.6 minutes.
- Onboarding speed
- SLA uptime (99.9% vs 99.99%)
- Roadmap velocity
- Contractual leverage: credits/termination
- Service quality vs operating cost
Regulatory burden shifting
Clients increasingly expect banks to absorb compliance oversight and audits; 2024 surveys show about 60% of corporate clients prefer providers to own regulatory responsibility, while 45% reported renegotiating contracts due to misaligned risk appetites. Expanded monitoring often increases scope without higher fees, and buyers pressure for standardized controls to scale faster.
- Regulatory-shift: client absorbance 60%
- Fee-pressure: scope up, fees flat
- Standardization: faster scaling
- Churn-risk: 45% renegotiations
Concentrated BaaS buyers wield pricing power; dual-sourcing, APIs squeeze fees
Pathward's BaaS buyers are concentrated and exert strong pricing leverage; losing a top client can materially cut fee income. 2024 trends: >60% of fintechs dual‑source, APIs cut integration time up to 40% but switching still incurs 2–6 week re‑underwriting delays, compressing pricing by ~5–10% and prompting 50–200 bps demands on interchange. 60% of clients want banks to assume regulatory oversight; 45% renegotiated contracts in 2024.
| Metric | 2024 Value |
|---|---|
| Fintechs dual‑sourcing | >60% |
| API integration time reduction | up to 40% |
| Switching delay | 2–6 weeks |
| Price compression | 5–10% |
| Interchange pressure | 50–200 bps |
| Clients want bank compliance | 60% |
| Contract renegotiations | 45% |
Full Version Awaits
Pathward Financial Porter's Five Forces Analysis
This preview shows the full Porter’s Five Forces analysis of Pathward Financial — assessing competitive rivalry, threat of new entrants, buyer and supplier power, and substitutes — and is the exact document you'll receive after purchase. No placeholders or samples: the file is fully formatted, ready to download and use immediately upon payment.
Original: $10.00
-65%$10.00
$3.50Description
A Must-Have Tool for Decision-Makers
Pathward Financial operates in a competitive niche where customer concentration, regulatory oversight, and fintech disruption shape margins and growth prospects. This snapshot highlights buyer power, supplier influence, substitution risk, and entry threats to frame strategic priorities. This brief only scratches the surface; unlock the full Porter's Five Forces Analysis to explore Pathward Financial’s competitive dynamics, market pressures, and strategic advantages in detail.
Suppliers Bargaining Power
Concentrated tech vendors
Pathward depends on a few core processors and cloud providers (AWS ~32%, Azure ~22%, Google ~11% in 2024) and dominant card networks, giving suppliers pricing and roadmap leverage. Visa and Mastercard control roughly 80%+ of global card volume, and their network rules are non-negotiable, constraining product design. Service outages or contract changes can compress margins and harm reliability almost immediately.
Funding and deposits
Low-cost deposits underpin Pathward’s BaaS and lending pipelines; as of mid-2024 Pathward reported roughly $6.9 billion in total deposits, making stable retail funding a critical input and competitive battleground.
Rising competition for sticky deposits pushed interest expense and promotional offers higher in 2023–24, with average deposit rates across the industry climbing into the low-single-digit range and pressuring net interest margins.
Wholesale funding provides flexibility and funded about 15–25% of Pathward-like balance sheets in 2024, but it brings higher rate and rollover risk compared with core deposits.
Liquidity and prudential rules (eg, LCR and NSFR pressures) in 2024 limited rapid substitution between deposit and wholesale sources, constraining funding mix choices under stress.
Data/KYC/AML providers
Third-party identity verification and AML providers (eg LexisNexis Risk, Experian, TransUnion, Socure, Ekata) are essential to onboard fintech customers at scale and concentrate bargaining power; industry lookup fees typically range from $0.10–$2.00 per check, with monthly minimums and throttling that can materially raise unit costs and cap growth. Integration complexity and proprietary data sets further increase switching costs for Pathward.
Payment rails and processors
Payment rails and processors (ACH, RTP, card networks, sponsor processors) set fees, dispute regimes and certification gates that feed directly into Pathward program economics; fee or rule changes in 2024 translate immediately to margins and pricing, while faster-payments access commonly requires multi-month certification and integration cycles; supplier SLAs shape client uptime commitments and penalty exposure.
- Fees & rules set by card networks and sponsors
- Certification timelines for RTP/FedNow often span months
- Rule changes flow into program economics in 2024
- Supplier SLAs drive uptime and contractual risk
Regulatory compliance services
External counsel, audit firms, and specialized compliance platforms provide bank-grade oversight for Pathward; heightened BaaS scrutiny in 2024 has increased reliance on these suppliers and concentrated demand on top providers. Capacity constraints at leading firms often create multi-week to multi-month wait times, raising fees and delaying client launches and revenue ramps.
- Concentration risk: top firms serve hundreds of banks
- Cost pressure: premium rates from scarce capacity
- Time-to-market: onboarding delays slow revenue realization
Concentrated cloud and card vendor power plus funding mix compress margins and raise switching costs
Pathward faces concentrated supplier power in cloud/processing (AWS ~32%, Azure ~22%, Google ~11% in 2024), dominant card networks (~80%+ volume) and identity/AML vendors (lookup fees $0.10–$2.00), which compress pricing flexibility and raise switching costs. Stable retail deposits ($6.9B mid‑2024) are critical but competition and higher deposit rates tightened margins; wholesale funding (15–25%) adds rollover risk under LCR/NSFR constraints.
| Supplier | 2024 Metric |
|---|---|
| Cloud/processing | AWS 32% / Azure 22% / Google 11% |
| Deposits | $6.9B (mid‑2024) |
| Card networks | ~80%+ global volume |
What is included in the product
Detailed Word Document
Comprehensive Porter’s Five Forces analysis tailored for Pathward Financial, highlighting competitive intensity, buyer and supplier power, threat of new entrants and substitutes, and strategic levers to protect margins and market position.
Customizable Excel Spreadsheet
Quick, one-sheet Porter's Five Forces for Pathward Financial relieves strategic uncertainty—customizable pressure levels, radar visualization, and clean layout make it easy to update scenarios, share in decks, and integrate with reports without any coding.
Customers Bargaining Power
Concentrated fintech clients
As of 2024, Pathward's BaaS revenue is often concentrated among a handful of large program managers and platforms, who use referenceability and scale to demand favorable terms. These buyers negotiate aggressively on pricing, revenue share, and marketing funds, and losing a top client can materially reduce volumes and fee income. In RFPs, large platforms wield disproportionate leverage given their ability to shift scale quickly.
Multihoming and switching
In 2024 over 60% of fintechs dual-source sponsor banks to reduce concentration risk, while API intermediaries have cut migration friction—industry estimates show up to a 40% reduction in integration time—expanding buyer options. Still, compliance re-underwriting and re-tokenization introduce 2–6 week delays and operational costs, and the credible threat of switching continues to compress pricing and tighten service SLAs by an estimated 5–10%.
Price sensitivity
Clients scrutinize every basis point on interchange splits, ledger fees, KYC costs, and float, often pushing for 50–200 bps on interchange in 2024 RFP benchmarks. Competitive benchmarks are widely known via RFPs and advisors, increasing transparency and negotiation leverage. Volume discounts and minimum guarantees are common asks, with large-deal concessions driving margin compression risk in major contracts.
Demand for speed and uptime
Buyers demand fast onboarding, high SLA uptime and rapid roadmap velocity, using SLA credits and termination-for-cause clauses as contractual leverage; feature gaps are leverage to push concessions while superior service can reduce price pressure but increases operating costs. 99.9% uptime equals ~8.76 hours annual downtime, 99.99% ~52.6 minutes.
- Onboarding speed
- SLA uptime (99.9% vs 99.99%)
- Roadmap velocity
- Contractual leverage: credits/termination
- Service quality vs operating cost
Regulatory burden shifting
Clients increasingly expect banks to absorb compliance oversight and audits; 2024 surveys show about 60% of corporate clients prefer providers to own regulatory responsibility, while 45% reported renegotiating contracts due to misaligned risk appetites. Expanded monitoring often increases scope without higher fees, and buyers pressure for standardized controls to scale faster.
- Regulatory-shift: client absorbance 60%
- Fee-pressure: scope up, fees flat
- Standardization: faster scaling
- Churn-risk: 45% renegotiations
Concentrated BaaS buyers wield pricing power; dual-sourcing, APIs squeeze fees
Pathward's BaaS buyers are concentrated and exert strong pricing leverage; losing a top client can materially cut fee income. 2024 trends: >60% of fintechs dual‑source, APIs cut integration time up to 40% but switching still incurs 2–6 week re‑underwriting delays, compressing pricing by ~5–10% and prompting 50–200 bps demands on interchange. 60% of clients want banks to assume regulatory oversight; 45% renegotiated contracts in 2024.
| Metric | 2024 Value |
|---|---|
| Fintechs dual‑sourcing | >60% |
| API integration time reduction | up to 40% |
| Switching delay | 2–6 weeks |
| Price compression | 5–10% |
| Interchange pressure | 50–200 bps |
| Clients want bank compliance | 60% |
| Contract renegotiations | 45% |
Full Version Awaits
Pathward Financial Porter's Five Forces Analysis
This preview shows the full Porter’s Five Forces analysis of Pathward Financial — assessing competitive rivalry, threat of new entrants, buyer and supplier power, and substitutes — and is the exact document you'll receive after purchase. No placeholders or samples: the file is fully formatted, ready to download and use immediately upon payment.











