Patrick Porter's Five Forces Analysis

Elevate Your Analysis with the Complete Porter's Five Forces Analysis
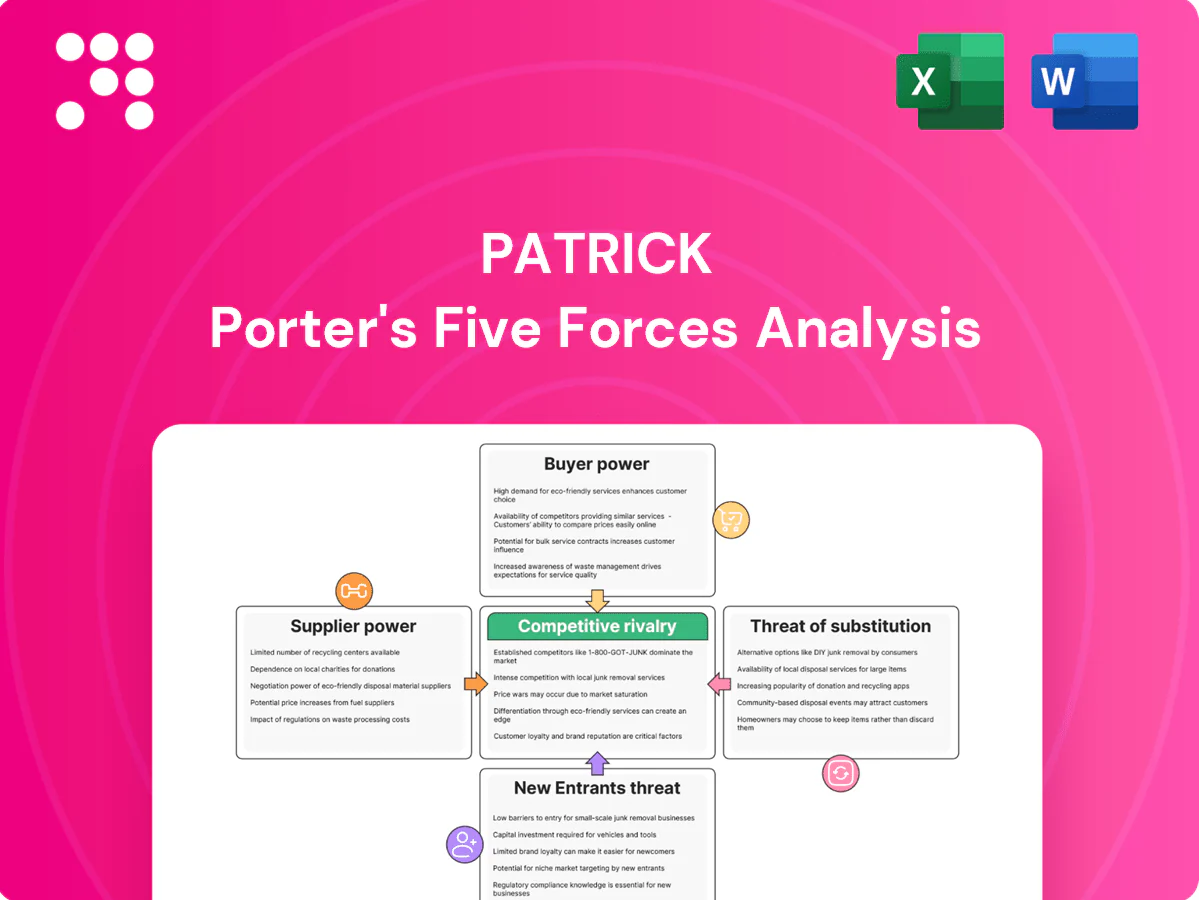
Patrick Porter's Five Forces Analysis distills supplier and buyer power, entry barriers, substitute threats, and competitive rivalry into a concise strategic snapshot that highlights where Patrick holds leverage and where vulnerabilities lie. This preview teases core insights—unlock the full Porter's Five Forces Analysis to explore force-by-force ratings, market pressures, and actionable recommendations. Purchase the complete report for consultant-grade visuals, Excel/Word deliverables, and a ready-to-use strategic toolkit.
Suppliers Bargaining Power

Raw material concentration
Patrick relies on aluminum, fiberglass resins, wood/MDF and specialty adhesives from a relatively concentrated base of chemical and metals producers; China accounted for roughly 55% of global primary aluminum capacity in 2024, tightening markets. Concentration elevates supplier leverage during capacity constraints or price spikes, though multi-sourcing and commodity hedging can offset some risk. Regional mills and distributors provide optionality but quality and lead times (commonly 2–8 weeks) vary.
Commodity price volatility
Resin, aluminum and lumber exhibit high cyclicality—historical swings of 20–50%—putting margin pressure when suppliers pass hikes within weeks while Patrick typically recovers costs over 1–3 quarters. Index-linked pricing and surcharges, present in roughly 30% of contracts, reduce lag risk. Inventory hedging and forward buys mitigate exposure but can tie up 5–15% of working capital.

Switching costs and specifications
Many components are spec’d-in with dedicated tooling, certifications, and quality audits, raising switching costs and lengthening qualification cycles; by 2024 industry best practice calls for dual-qualification with two qualified suppliers to reduce single-source risk. Patrick’s internal fabrication reduces exposure to finished-component shortages but still depends on compliant raw materials and certified inputs. Maintaining dual-qualification programs preserves leverage and continuity.

Logistics and lead-time dependencies
Suppliers’ lead times (commonly 2–10 weeks) and volatile freight rates directly affect availability and landed cost; cross-border flows and tariff checks add further delay. Disruptions in chemicals or metals supply chains in 2024 caused multi-week plant slowdowns for manufacturers, rippling into Patrick’s schedules. Patrick’s North American footprint and local stocking (multi-week buffers) reduce but do not remove risk; collaborative forecasting with suppliers raised on-time deliveries in 2024.
- Lead times: 2–10 weeks
- Freight cost impact: significant on landed cost
- Local stocking: multi-week buffers
- Mitigation: collaborative forecasting improved reliability in 2024
Supplier consolidation and bargaining leverage
Ongoing consolidation among chemical and specialty-material suppliers increased supplier pricing power in 2024, tightening spot availability and raising negotiation thresholds. Scale buyers like Patrick offset some pressure via volume purchasing and multi‑year contracts that commonly yield 5–15% cost reductions. Supplier scorecards and vendor-managed inventory (VMI) align service levels and reduce stockouts. Strategic partnerships trade demand visibility for allocation priority.
- Supplier concentration: higher in 2024
- Buyer leverage: volume + long-term contracts (5–15% savings)
- Operational tools: scorecards, VMI
- Strategic partnerships: demand visibility → priority
Aluminum risk: China ~55% capacity, 2–10 week lead times boost volatility and costs
Supplier concentration (China ~55% of primary aluminum capacity in 2024) and chemical consolidation increased supplier leverage, raising spot volatility and landed costs; lead times 2–10 weeks amplify disruption risk. Patrick offsets with dual-qualification, hedging, VMI and multi‑year contracts (typical savings 5–15%), but inventory hedging ties up 5–15% of working capital.
| Metric | 2024 value | Impact |
|---|---|---|
| China aluminum share | ~55% | High supply concentration |
| Lead times | 2–10 weeks | Availability risk |
| Contract savings | 5–15% | Cost mitigation |
| Working capital tied | 5–15% | Liquidity impact |
What is included in the product
 Detailed Word Document
Uncovers key drivers of competition, customer influence, and market entry risks tailored exclusively for Patrick, analyzing its position within the competitive landscape. Identifies disruptive threats and substitutes, evaluates supplier and buyer power on pricing and profitability, and is delivered in fully editable Word format for use in plans, investor materials, or strategy decks.

 Customizable Excel Spreadsheet
A clear, one-sheet Patrick Porter Five Forces summary that instantly highlights strategic pressure points with a compact spider chart—ideal for quick decisions, slide-ready presentations, and easy customization without complex tools.
Customers Bargaining Power

High OEM concentration
High OEM concentration gives large RV and marine manufacturers outsized negotiating leverage, allowing them to demand price concessions, higher service levels, and design support; in 2024 Patrick faces this risk as top OEMs drive much of channel demand. Patrick mitigates through broad SKU assortment, geographic proximity, and integrated solutions, but loss of a key OEM line would be material and heightens switching-risk focus.
Price transparency and benchmarking
With commodity inputs, buyers can benchmark prices and push pass-throughs, and in 2024 OEMs routinely run RFQs across multiple component suppliers to extract savings. Patrick’s kitting, value-add services and just-in-time delivery support pricing differentials by reducing buyer total cost of ownership. Cost models and open-book arrangements can institutionalize fair margins and improve supplier-OEM transparency.

Dual-sourcing and make-vs-buy
OEMs commonly dual-source critical components—over 60% of manufacturers reported dual-sourcing in 2024—to avoid dependence and preserve negotiating leverage. In-sourcing is a credible threat for standardized parts if cost and quality targets are met; Patrick defends with engineering support, tooling capital and scale procurement. Customization raises switching costs and reduces buyer power.

Service and delivery requirements
Just-in-time delivery to final assembly lines raises the cost of supplier failure because single missed shipment can halt production; in 2024 industry OTIF targets commonly run 98–99%, so buyers quickly reward reliable OTIF and penalize lapses via chargebacks and reduced orders. Patrick’s distributed footprint and logistics capabilities lower disruption risk, while embedded teams and EDI integration increase customer stickiness and perceived value.
- JIT sensitivity: OTIF targets 98–99% (2024)
- Penalty dynamics: chargebacks and order reductions for lapses
- Resilience: distributed footprint reduces single-point failure
- Stickiness: embedded teams + EDI raise switching costs
Aftermarket and breadth of offering
Access to aftermarket and replacement channels gives Patrick incremental margin and service value to OEMs and end users; Patrick reported approximately 4.1 billion USD in net sales in FY2024, highlighting aftermarket scale. A broad portfolio enables bundling to capture more share-of-wallet and trade lower prices for volume commitments, reducing buyer leverage; cross-selling across RV, marine and MH cuts single-program dependence.
- FY2024 net sales ~4.1B USD
- Bundling increases wallet share, lowers price sensitivity
- Aftermarket channels add recurring revenue
- Cross-selling diversifies program risk
High OEM concentration, >60% dual-sourcing and 98-99% OTIF boost buyer leverage
High OEM concentration and >60% dual-sourcing (2024) give buyers strong price leverage; OTIF targets 98–99% (2024) make reliability a key differentiator. Patrick’s FY2024 net sales ~4.1B USD, kitting, JIT and aftermarket reduce buyer power by raising switching costs.
| Metric | 2024 |
|---|---|
| FY Net Sales | ~4.1B USD |
| Dual-sourcing | >60% |
| OTIF targets | 98–99% |
Full Version Awaits
Patrick Porter's Five Forces Analysis
You're viewing Patrick Porter's Five Forces Analysis: the exact, fully formatted document you'll receive immediately after purchase. This preview contains the complete strategic assessment—no placeholders or samples—ready for download and use. The file delivered post-purchase is identical to what you see here and requires no additional setup or customization.

Elevate Your Analysis with the Complete Porter's Five Forces Analysis
Patrick Porter's Five Forces Analysis distills supplier and buyer power, entry barriers, substitute threats, and competitive rivalry into a concise strategic snapshot that highlights where Patrick holds leverage and where vulnerabilities lie. This preview teases core insights—unlock the full Porter's Five Forces Analysis to explore force-by-force ratings, market pressures, and actionable recommendations. Purchase the complete report for consultant-grade visuals, Excel/Word deliverables, and a ready-to-use strategic toolkit.
Suppliers Bargaining Power
Raw material concentration
Patrick relies on aluminum, fiberglass resins, wood/MDF and specialty adhesives from a relatively concentrated base of chemical and metals producers; China accounted for roughly 55% of global primary aluminum capacity in 2024, tightening markets. Concentration elevates supplier leverage during capacity constraints or price spikes, though multi-sourcing and commodity hedging can offset some risk. Regional mills and distributors provide optionality but quality and lead times (commonly 2–8 weeks) vary.
Commodity price volatility
Resin, aluminum and lumber exhibit high cyclicality—historical swings of 20–50%—putting margin pressure when suppliers pass hikes within weeks while Patrick typically recovers costs over 1–3 quarters. Index-linked pricing and surcharges, present in roughly 30% of contracts, reduce lag risk. Inventory hedging and forward buys mitigate exposure but can tie up 5–15% of working capital.
Switching costs and specifications
Many components are spec’d-in with dedicated tooling, certifications, and quality audits, raising switching costs and lengthening qualification cycles; by 2024 industry best practice calls for dual-qualification with two qualified suppliers to reduce single-source risk. Patrick’s internal fabrication reduces exposure to finished-component shortages but still depends on compliant raw materials and certified inputs. Maintaining dual-qualification programs preserves leverage and continuity.
Logistics and lead-time dependencies
Suppliers’ lead times (commonly 2–10 weeks) and volatile freight rates directly affect availability and landed cost; cross-border flows and tariff checks add further delay. Disruptions in chemicals or metals supply chains in 2024 caused multi-week plant slowdowns for manufacturers, rippling into Patrick’s schedules. Patrick’s North American footprint and local stocking (multi-week buffers) reduce but do not remove risk; collaborative forecasting with suppliers raised on-time deliveries in 2024.
- Lead times: 2–10 weeks
- Freight cost impact: significant on landed cost
- Local stocking: multi-week buffers
- Mitigation: collaborative forecasting improved reliability in 2024
Supplier consolidation and bargaining leverage
Ongoing consolidation among chemical and specialty-material suppliers increased supplier pricing power in 2024, tightening spot availability and raising negotiation thresholds. Scale buyers like Patrick offset some pressure via volume purchasing and multi‑year contracts that commonly yield 5–15% cost reductions. Supplier scorecards and vendor-managed inventory (VMI) align service levels and reduce stockouts. Strategic partnerships trade demand visibility for allocation priority.
- Supplier concentration: higher in 2024
- Buyer leverage: volume + long-term contracts (5–15% savings)
- Operational tools: scorecards, VMI
- Strategic partnerships: demand visibility → priority
Aluminum risk: China ~55% capacity, 2–10 week lead times boost volatility and costs
Supplier concentration (China ~55% of primary aluminum capacity in 2024) and chemical consolidation increased supplier leverage, raising spot volatility and landed costs; lead times 2–10 weeks amplify disruption risk. Patrick offsets with dual-qualification, hedging, VMI and multi‑year contracts (typical savings 5–15%), but inventory hedging ties up 5–15% of working capital.
| Metric | 2024 value | Impact |
|---|---|---|
| China aluminum share | ~55% | High supply concentration |
| Lead times | 2–10 weeks | Availability risk |
| Contract savings | 5–15% | Cost mitigation |
| Working capital tied | 5–15% | Liquidity impact |
What is included in the product
Detailed Word Document
Uncovers key drivers of competition, customer influence, and market entry risks tailored exclusively for Patrick, analyzing its position within the competitive landscape. Identifies disruptive threats and substitutes, evaluates supplier and buyer power on pricing and profitability, and is delivered in fully editable Word format for use in plans, investor materials, or strategy decks.
Customizable Excel Spreadsheet
A clear, one-sheet Patrick Porter Five Forces summary that instantly highlights strategic pressure points with a compact spider chart—ideal for quick decisions, slide-ready presentations, and easy customization without complex tools.
Customers Bargaining Power
High OEM concentration
High OEM concentration gives large RV and marine manufacturers outsized negotiating leverage, allowing them to demand price concessions, higher service levels, and design support; in 2024 Patrick faces this risk as top OEMs drive much of channel demand. Patrick mitigates through broad SKU assortment, geographic proximity, and integrated solutions, but loss of a key OEM line would be material and heightens switching-risk focus.
Price transparency and benchmarking
With commodity inputs, buyers can benchmark prices and push pass-throughs, and in 2024 OEMs routinely run RFQs across multiple component suppliers to extract savings. Patrick’s kitting, value-add services and just-in-time delivery support pricing differentials by reducing buyer total cost of ownership. Cost models and open-book arrangements can institutionalize fair margins and improve supplier-OEM transparency.
Dual-sourcing and make-vs-buy
OEMs commonly dual-source critical components—over 60% of manufacturers reported dual-sourcing in 2024—to avoid dependence and preserve negotiating leverage. In-sourcing is a credible threat for standardized parts if cost and quality targets are met; Patrick defends with engineering support, tooling capital and scale procurement. Customization raises switching costs and reduces buyer power.
Service and delivery requirements
Just-in-time delivery to final assembly lines raises the cost of supplier failure because single missed shipment can halt production; in 2024 industry OTIF targets commonly run 98–99%, so buyers quickly reward reliable OTIF and penalize lapses via chargebacks and reduced orders. Patrick’s distributed footprint and logistics capabilities lower disruption risk, while embedded teams and EDI integration increase customer stickiness and perceived value.
- JIT sensitivity: OTIF targets 98–99% (2024)
- Penalty dynamics: chargebacks and order reductions for lapses
- Resilience: distributed footprint reduces single-point failure
- Stickiness: embedded teams + EDI raise switching costs
Aftermarket and breadth of offering
Access to aftermarket and replacement channels gives Patrick incremental margin and service value to OEMs and end users; Patrick reported approximately 4.1 billion USD in net sales in FY2024, highlighting aftermarket scale. A broad portfolio enables bundling to capture more share-of-wallet and trade lower prices for volume commitments, reducing buyer leverage; cross-selling across RV, marine and MH cuts single-program dependence.
- FY2024 net sales ~4.1B USD
- Bundling increases wallet share, lowers price sensitivity
- Aftermarket channels add recurring revenue
- Cross-selling diversifies program risk
High OEM concentration, >60% dual-sourcing and 98-99% OTIF boost buyer leverage
High OEM concentration and >60% dual-sourcing (2024) give buyers strong price leverage; OTIF targets 98–99% (2024) make reliability a key differentiator. Patrick’s FY2024 net sales ~4.1B USD, kitting, JIT and aftermarket reduce buyer power by raising switching costs.
| Metric | 2024 |
|---|---|
| FY Net Sales | ~4.1B USD |
| Dual-sourcing | >60% |
| OTIF targets | 98–99% |
Full Version Awaits
Patrick Porter's Five Forces Analysis
You're viewing Patrick Porter's Five Forces Analysis: the exact, fully formatted document you'll receive immediately after purchase. This preview contains the complete strategic assessment—no placeholders or samples—ready for download and use. The file delivered post-purchase is identical to what you see here and requires no additional setup or customization.
Description
Elevate Your Analysis with the Complete Porter's Five Forces Analysis
Patrick Porter's Five Forces Analysis distills supplier and buyer power, entry barriers, substitute threats, and competitive rivalry into a concise strategic snapshot that highlights where Patrick holds leverage and where vulnerabilities lie. This preview teases core insights—unlock the full Porter's Five Forces Analysis to explore force-by-force ratings, market pressures, and actionable recommendations. Purchase the complete report for consultant-grade visuals, Excel/Word deliverables, and a ready-to-use strategic toolkit.
Suppliers Bargaining Power
Raw material concentration
Patrick relies on aluminum, fiberglass resins, wood/MDF and specialty adhesives from a relatively concentrated base of chemical and metals producers; China accounted for roughly 55% of global primary aluminum capacity in 2024, tightening markets. Concentration elevates supplier leverage during capacity constraints or price spikes, though multi-sourcing and commodity hedging can offset some risk. Regional mills and distributors provide optionality but quality and lead times (commonly 2–8 weeks) vary.
Commodity price volatility
Resin, aluminum and lumber exhibit high cyclicality—historical swings of 20–50%—putting margin pressure when suppliers pass hikes within weeks while Patrick typically recovers costs over 1–3 quarters. Index-linked pricing and surcharges, present in roughly 30% of contracts, reduce lag risk. Inventory hedging and forward buys mitigate exposure but can tie up 5–15% of working capital.
Switching costs and specifications
Many components are spec’d-in with dedicated tooling, certifications, and quality audits, raising switching costs and lengthening qualification cycles; by 2024 industry best practice calls for dual-qualification with two qualified suppliers to reduce single-source risk. Patrick’s internal fabrication reduces exposure to finished-component shortages but still depends on compliant raw materials and certified inputs. Maintaining dual-qualification programs preserves leverage and continuity.
Logistics and lead-time dependencies
Suppliers’ lead times (commonly 2–10 weeks) and volatile freight rates directly affect availability and landed cost; cross-border flows and tariff checks add further delay. Disruptions in chemicals or metals supply chains in 2024 caused multi-week plant slowdowns for manufacturers, rippling into Patrick’s schedules. Patrick’s North American footprint and local stocking (multi-week buffers) reduce but do not remove risk; collaborative forecasting with suppliers raised on-time deliveries in 2024.
- Lead times: 2–10 weeks
- Freight cost impact: significant on landed cost
- Local stocking: multi-week buffers
- Mitigation: collaborative forecasting improved reliability in 2024
Supplier consolidation and bargaining leverage
Ongoing consolidation among chemical and specialty-material suppliers increased supplier pricing power in 2024, tightening spot availability and raising negotiation thresholds. Scale buyers like Patrick offset some pressure via volume purchasing and multi‑year contracts that commonly yield 5–15% cost reductions. Supplier scorecards and vendor-managed inventory (VMI) align service levels and reduce stockouts. Strategic partnerships trade demand visibility for allocation priority.
- Supplier concentration: higher in 2024
- Buyer leverage: volume + long-term contracts (5–15% savings)
- Operational tools: scorecards, VMI
- Strategic partnerships: demand visibility → priority
Aluminum risk: China ~55% capacity, 2–10 week lead times boost volatility and costs
Supplier concentration (China ~55% of primary aluminum capacity in 2024) and chemical consolidation increased supplier leverage, raising spot volatility and landed costs; lead times 2–10 weeks amplify disruption risk. Patrick offsets with dual-qualification, hedging, VMI and multi‑year contracts (typical savings 5–15%), but inventory hedging ties up 5–15% of working capital.
| Metric | 2024 value | Impact |
|---|---|---|
| China aluminum share | ~55% | High supply concentration |
| Lead times | 2–10 weeks | Availability risk |
| Contract savings | 5–15% | Cost mitigation |
| Working capital tied | 5–15% | Liquidity impact |
What is included in the product
Detailed Word Document
Uncovers key drivers of competition, customer influence, and market entry risks tailored exclusively for Patrick, analyzing its position within the competitive landscape. Identifies disruptive threats and substitutes, evaluates supplier and buyer power on pricing and profitability, and is delivered in fully editable Word format for use in plans, investor materials, or strategy decks.
Customizable Excel Spreadsheet
A clear, one-sheet Patrick Porter Five Forces summary that instantly highlights strategic pressure points with a compact spider chart—ideal for quick decisions, slide-ready presentations, and easy customization without complex tools.
Customers Bargaining Power
High OEM concentration
High OEM concentration gives large RV and marine manufacturers outsized negotiating leverage, allowing them to demand price concessions, higher service levels, and design support; in 2024 Patrick faces this risk as top OEMs drive much of channel demand. Patrick mitigates through broad SKU assortment, geographic proximity, and integrated solutions, but loss of a key OEM line would be material and heightens switching-risk focus.
Price transparency and benchmarking
With commodity inputs, buyers can benchmark prices and push pass-throughs, and in 2024 OEMs routinely run RFQs across multiple component suppliers to extract savings. Patrick’s kitting, value-add services and just-in-time delivery support pricing differentials by reducing buyer total cost of ownership. Cost models and open-book arrangements can institutionalize fair margins and improve supplier-OEM transparency.
Dual-sourcing and make-vs-buy
OEMs commonly dual-source critical components—over 60% of manufacturers reported dual-sourcing in 2024—to avoid dependence and preserve negotiating leverage. In-sourcing is a credible threat for standardized parts if cost and quality targets are met; Patrick defends with engineering support, tooling capital and scale procurement. Customization raises switching costs and reduces buyer power.
Service and delivery requirements
Just-in-time delivery to final assembly lines raises the cost of supplier failure because single missed shipment can halt production; in 2024 industry OTIF targets commonly run 98–99%, so buyers quickly reward reliable OTIF and penalize lapses via chargebacks and reduced orders. Patrick’s distributed footprint and logistics capabilities lower disruption risk, while embedded teams and EDI integration increase customer stickiness and perceived value.
- JIT sensitivity: OTIF targets 98–99% (2024)
- Penalty dynamics: chargebacks and order reductions for lapses
- Resilience: distributed footprint reduces single-point failure
- Stickiness: embedded teams + EDI raise switching costs
Aftermarket and breadth of offering
Access to aftermarket and replacement channels gives Patrick incremental margin and service value to OEMs and end users; Patrick reported approximately 4.1 billion USD in net sales in FY2024, highlighting aftermarket scale. A broad portfolio enables bundling to capture more share-of-wallet and trade lower prices for volume commitments, reducing buyer leverage; cross-selling across RV, marine and MH cuts single-program dependence.
- FY2024 net sales ~4.1B USD
- Bundling increases wallet share, lowers price sensitivity
- Aftermarket channels add recurring revenue
- Cross-selling diversifies program risk
High OEM concentration, >60% dual-sourcing and 98-99% OTIF boost buyer leverage
High OEM concentration and >60% dual-sourcing (2024) give buyers strong price leverage; OTIF targets 98–99% (2024) make reliability a key differentiator. Patrick’s FY2024 net sales ~4.1B USD, kitting, JIT and aftermarket reduce buyer power by raising switching costs.
| Metric | 2024 |
|---|---|
| FY Net Sales | ~4.1B USD |
| Dual-sourcing | >60% |
| OTIF targets | 98–99% |
Full Version Awaits
Patrick Porter's Five Forces Analysis
You're viewing Patrick Porter's Five Forces Analysis: the exact, fully formatted document you'll receive immediately after purchase. This preview contains the complete strategic assessment—no placeholders or samples—ready for download and use. The file delivered post-purchase is identical to what you see here and requires no additional setup or customization.











