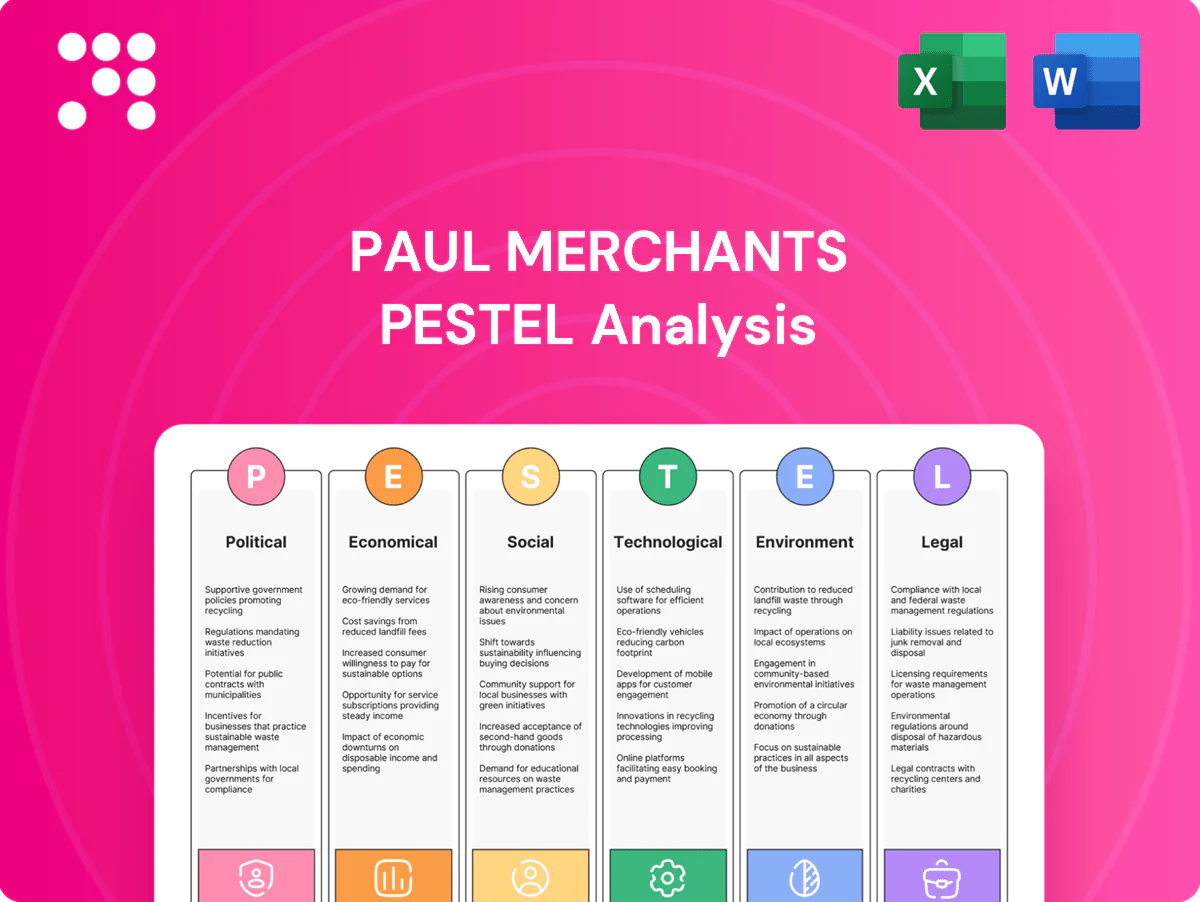
Paul Merchants PESTLE Analysis

Your Competitive Advantage Starts with This Report
Gain strategic clarity with our PESTLE Analysis of Paul Merchants—concise, actionable insights into political, economic, social, technological, legal and environmental drivers shaping its future. Ideal for investors and strategists; purchase the full report for a detailed, downloadable breakdown.
Political factors

RBI oversight and policy direction
RBI shapes rules for remittances, forex and payments, impacting licensing, capital and operations for Paul Merchants; cross-border remittances to India exceed $100 billion annually. Policy shifts on money-transfer schemes or outsourcing can materially alter cost structures and compliance burdens. Close alignment with RBI priorities—financial inclusion and digital payments—supports growth, while tightening on forex or MTO arrangements could slow expansion.
Government push for financial inclusion
Government financial-inclusion drives expand Paul Merchants addressable market: Pradhan Mantri Jan Dhan reached about 462 million accounts, UPI exceeded 100 billion transactions in 2024, and DBT channels route roughly INR 12 lakh crore annually, channeling subsidies and wages into formal accounts; rural outreach and subsidy flows lift branch/agent volumes and political momentum keeps the network relevant beyond metros.

International relations and remittance corridors
Bilateral ties with the GCC, US, UK and Southeast Asia shape migrant flows and remittance throughput; GCC hosts roughly 25 million migrant workers while global remittances to low- and middle-income countries were about $630 billion in 2022 (World Bank), concentrating volumes on those corridors. Visa regimes, labor pacts and geopolitical tensions raise compliance costs or can abruptly disrupt corridors, increasing operational risk and liquidity needs. Favorable diplomacy facilitates correspondent partnerships and market access, while sanctions shifts—illustrated by recent Russia-related measures—force rapid updates to screening and controls, elevating compliance spend and transaction delays.

Public sector competition and partnerships
Policy support for India Post Payments Bank and public banks can intensify last-mile competition while offering politically backed tie-ups for payout distribution and travel forex; India Post’s network of 154,965 post offices (as of March 2024) underpins scale for such partnerships.
- Competition: public-bank/IPPB outreach vs fintech
- Tie-ups: payout & travel forex often government-facilitated
- Seasonality: pilgrimage/travel programs drive forex spikes
- Risk: stability of government programs affects planning
Election-cycle policy uncertainty
Election-cycle policy shifts—budget reassignments, fee caps, or tax tweaks—can materially change pricing and demand; firms should note that major electoral years in 2024–25 produced heightened regulatory review in banking and fintech sectors. Administrative continuity enables multi-year tech and branch investments with typical payback horizons of 3–5 years, while short-term uncertainty often delays partnerships or product launches by months. Risk hedging and scenario planning are essential to protect margins and timing.
RBI rules reshape cross-border remittances amid India’s $100B+ inflows and UPI boom
RBI rules on remittances, forex and MTO licensing directly affect Paul Merchants; cross-border remittances to India exceed $100 billion annually. Financial-inclusion drives magnify addressable market: Jan Dhan ~462 million accounts, UPI >100 billion txns in 2024, DBT ~INR 12 lakh crore. GCC migrant stock ~25 million and global remittances ~$630 billion (2022) concentrate corridor risk and compliance costs.
| Metric | Value |
|---|---|
| India remittances | $100+ bn/yr |
| Jan Dhan | 462M accounts |
| UPI 2024 | 100B+ txns |
| DBT | INR 12 lakh crore |
| Post offices | 154,965 (Mar 2024) |
What is included in the product
 Detailed Word Document
Explores how macro-environmental factors uniquely affect Paul Merchants across Political, Economic, Social, Technological, Environmental, and Legal dimensions, with data-backed trends and regionally relevant examples. Designed for executives and investors, it delivers clean, forward-looking insights ready for plans, decks, or scenario planning.

 Customizable Excel Spreadsheet
Paul Merchants PESTLE Analysis condenses external factors into a clean, visually segmented summary that’s easily shareable and editable, helping teams quickly align on risks, market positioning, and strategic actions.
Economic factors

INR volatility and FX spreads
Exchange-rate swings (INR near 83/USD in June 2025) compress margins on currency exchange and remittance conversion as conversion costs move with spot. Volatility—implied FX vols near 9–10% in 2024—can widen spreads but dampen consumer remittance demand. Robust treasury and active hedging programs stabilize reported earnings by smoothing realized FX effects. Transparent pricing during sharp INR moves preserves customer trust and volume.
Migration and employment trends
Overseas and domestic migrant employment drives remittance volumes—India received about $111 billion in remittances in 2023, underpinning Paul Merchants’ core flows. GCC construction and services cycles and India’s job market affect average ticket sizes as hiring in 2023–24 remained uneven. Brent averaged roughly $86/bbl in 2023, so oil-driven GCC budget shifts materially influence remitter incomes. Diversified corridors (GCC, UK, USA) reduce cyclicality.

Tourism and travel cycles
Outbound and inbound tourism, plus rising student mobility, drive demand for forex cards and cash—global international tourism receipts recovered to about 95% of 2019 levels in 2023, totaling roughly USD 1.4 trillion, boosting transaction volumes. Macroeconomic health, airfares and disposable income create clear seasonality in flows. Shocks like pandemics or oil-price spikes can sharply compress volumes. A flexible product mix (prepaid cards, multi-currency wallets, emergency cash) helps buffer troughs.

Interest rates and liquidity conditions
Policy rates drive Paul Merchants’ working capital and partner float economics; US federal funds at 5.25–5.50% (June 2025) raises short-term funding costs and squeezes margins. Tight liquidity elevates transaction costs and settlement risk, while lower rates historically boost travel and remittance volumes, making dynamic pricing and active cash management critical levers.
- Rate environment: US Fed 5.25–5.50% (Jun 2025)
- Impact: higher working capital cost, partner float compression
- Risk: increased transaction/settlement costs under tight liquidity
- Levers: dynamic pricing, cash pooling, float optimization
Competitive fee compression
Fintechs and banks use scale and digital rails to push fees lower, forcing competitive fee compression in remittances and forex; World Bank data showed the global average remittance cost near 6.4% in 2023, underscoring price sensitivity and the need for efficiency gains. Paul Merchants can offset margin pressure with value-added services and loyalty programs while optimizing cost-to-serve to preserve profitability.
- Scale-driven pricing
- Average remittance cost ~6.4% (2023)
- Value-adds offset margins
- Cost-to-serve optimization
RBI rules reshape cross-border remittances amid India’s $100B+ inflows and UPI boom
INR ~83/USD (Jun 2025) and Fed funds 5.25–5.50% (Jun 2025) raise funding costs and compress remittance margins; hedging and treasury programs mitigate earnings volatility. India remittances $111B (2023) and global remittance cost ~6.4% (2023) keep price sensitivity high. Tourism recovery (~$1.4T receipts, 2023) and GCC oil swings (Brent ~$86/bbl, 2023) drive corridor volumes and ticket sizes.
| Metric | Value |
|---|---|
| INR/USD (Jun 2025) | ~83 |
| Fed funds (Jun 2025) | 5.25–5.50% |
| India remittances (2023) | $111B |
| Avg remittance cost (2023) | ~6.4% |
| Global tourism receipts (2023) | ~$1.4T |
| Brent (2023 avg) | ~$86/bbl |
Full Version Awaits
Paul Merchants PESTLE Analysis
The Paul Merchants PESTLE Analysis provides a concise assessment of political, economic, social, technological, legal, and environmental factors affecting the company, with actionable insights for strategy and risk management. The preview shown here is the exact document you’ll receive after purchase—fully formatted and ready to use. No placeholders or surprises—this is the final, downloadable file.

Your Competitive Advantage Starts with This Report
Gain strategic clarity with our PESTLE Analysis of Paul Merchants—concise, actionable insights into political, economic, social, technological, legal and environmental drivers shaping its future. Ideal for investors and strategists; purchase the full report for a detailed, downloadable breakdown.
Political factors
RBI oversight and policy direction
RBI shapes rules for remittances, forex and payments, impacting licensing, capital and operations for Paul Merchants; cross-border remittances to India exceed $100 billion annually. Policy shifts on money-transfer schemes or outsourcing can materially alter cost structures and compliance burdens. Close alignment with RBI priorities—financial inclusion and digital payments—supports growth, while tightening on forex or MTO arrangements could slow expansion.
Government push for financial inclusion
Government financial-inclusion drives expand Paul Merchants addressable market: Pradhan Mantri Jan Dhan reached about 462 million accounts, UPI exceeded 100 billion transactions in 2024, and DBT channels route roughly INR 12 lakh crore annually, channeling subsidies and wages into formal accounts; rural outreach and subsidy flows lift branch/agent volumes and political momentum keeps the network relevant beyond metros.
International relations and remittance corridors
Bilateral ties with the GCC, US, UK and Southeast Asia shape migrant flows and remittance throughput; GCC hosts roughly 25 million migrant workers while global remittances to low- and middle-income countries were about $630 billion in 2022 (World Bank), concentrating volumes on those corridors. Visa regimes, labor pacts and geopolitical tensions raise compliance costs or can abruptly disrupt corridors, increasing operational risk and liquidity needs. Favorable diplomacy facilitates correspondent partnerships and market access, while sanctions shifts—illustrated by recent Russia-related measures—force rapid updates to screening and controls, elevating compliance spend and transaction delays.
Public sector competition and partnerships
Policy support for India Post Payments Bank and public banks can intensify last-mile competition while offering politically backed tie-ups for payout distribution and travel forex; India Post’s network of 154,965 post offices (as of March 2024) underpins scale for such partnerships.
- Competition: public-bank/IPPB outreach vs fintech
- Tie-ups: payout & travel forex often government-facilitated
- Seasonality: pilgrimage/travel programs drive forex spikes
- Risk: stability of government programs affects planning
Election-cycle policy uncertainty
Election-cycle policy shifts—budget reassignments, fee caps, or tax tweaks—can materially change pricing and demand; firms should note that major electoral years in 2024–25 produced heightened regulatory review in banking and fintech sectors. Administrative continuity enables multi-year tech and branch investments with typical payback horizons of 3–5 years, while short-term uncertainty often delays partnerships or product launches by months. Risk hedging and scenario planning are essential to protect margins and timing.
RBI rules reshape cross-border remittances amid India’s $100B+ inflows and UPI boom
RBI rules on remittances, forex and MTO licensing directly affect Paul Merchants; cross-border remittances to India exceed $100 billion annually. Financial-inclusion drives magnify addressable market: Jan Dhan ~462 million accounts, UPI >100 billion txns in 2024, DBT ~INR 12 lakh crore. GCC migrant stock ~25 million and global remittances ~$630 billion (2022) concentrate corridor risk and compliance costs.
| Metric | Value |
|---|---|
| India remittances | $100+ bn/yr |
| Jan Dhan | 462M accounts |
| UPI 2024 | 100B+ txns |
| DBT | INR 12 lakh crore |
| Post offices | 154,965 (Mar 2024) |
What is included in the product
Detailed Word Document
Explores how macro-environmental factors uniquely affect Paul Merchants across Political, Economic, Social, Technological, Environmental, and Legal dimensions, with data-backed trends and regionally relevant examples. Designed for executives and investors, it delivers clean, forward-looking insights ready for plans, decks, or scenario planning.
Customizable Excel Spreadsheet
Paul Merchants PESTLE Analysis condenses external factors into a clean, visually segmented summary that’s easily shareable and editable, helping teams quickly align on risks, market positioning, and strategic actions.
Economic factors
INR volatility and FX spreads
Exchange-rate swings (INR near 83/USD in June 2025) compress margins on currency exchange and remittance conversion as conversion costs move with spot. Volatility—implied FX vols near 9–10% in 2024—can widen spreads but dampen consumer remittance demand. Robust treasury and active hedging programs stabilize reported earnings by smoothing realized FX effects. Transparent pricing during sharp INR moves preserves customer trust and volume.
Migration and employment trends
Overseas and domestic migrant employment drives remittance volumes—India received about $111 billion in remittances in 2023, underpinning Paul Merchants’ core flows. GCC construction and services cycles and India’s job market affect average ticket sizes as hiring in 2023–24 remained uneven. Brent averaged roughly $86/bbl in 2023, so oil-driven GCC budget shifts materially influence remitter incomes. Diversified corridors (GCC, UK, USA) reduce cyclicality.
Tourism and travel cycles
Outbound and inbound tourism, plus rising student mobility, drive demand for forex cards and cash—global international tourism receipts recovered to about 95% of 2019 levels in 2023, totaling roughly USD 1.4 trillion, boosting transaction volumes. Macroeconomic health, airfares and disposable income create clear seasonality in flows. Shocks like pandemics or oil-price spikes can sharply compress volumes. A flexible product mix (prepaid cards, multi-currency wallets, emergency cash) helps buffer troughs.
Interest rates and liquidity conditions
Policy rates drive Paul Merchants’ working capital and partner float economics; US federal funds at 5.25–5.50% (June 2025) raises short-term funding costs and squeezes margins. Tight liquidity elevates transaction costs and settlement risk, while lower rates historically boost travel and remittance volumes, making dynamic pricing and active cash management critical levers.
- Rate environment: US Fed 5.25–5.50% (Jun 2025)
- Impact: higher working capital cost, partner float compression
- Risk: increased transaction/settlement costs under tight liquidity
- Levers: dynamic pricing, cash pooling, float optimization
Competitive fee compression
Fintechs and banks use scale and digital rails to push fees lower, forcing competitive fee compression in remittances and forex; World Bank data showed the global average remittance cost near 6.4% in 2023, underscoring price sensitivity and the need for efficiency gains. Paul Merchants can offset margin pressure with value-added services and loyalty programs while optimizing cost-to-serve to preserve profitability.
- Scale-driven pricing
- Average remittance cost ~6.4% (2023)
- Value-adds offset margins
- Cost-to-serve optimization
RBI rules reshape cross-border remittances amid India’s $100B+ inflows and UPI boom
INR ~83/USD (Jun 2025) and Fed funds 5.25–5.50% (Jun 2025) raise funding costs and compress remittance margins; hedging and treasury programs mitigate earnings volatility. India remittances $111B (2023) and global remittance cost ~6.4% (2023) keep price sensitivity high. Tourism recovery (~$1.4T receipts, 2023) and GCC oil swings (Brent ~$86/bbl, 2023) drive corridor volumes and ticket sizes.
| Metric | Value |
|---|---|
| INR/USD (Jun 2025) | ~83 |
| Fed funds (Jun 2025) | 5.25–5.50% |
| India remittances (2023) | $111B |
| Avg remittance cost (2023) | ~6.4% |
| Global tourism receipts (2023) | ~$1.4T |
| Brent (2023 avg) | ~$86/bbl |
Full Version Awaits
Paul Merchants PESTLE Analysis
The Paul Merchants PESTLE Analysis provides a concise assessment of political, economic, social, technological, legal, and environmental factors affecting the company, with actionable insights for strategy and risk management. The preview shown here is the exact document you’ll receive after purchase—fully formatted and ready to use. No placeholders or surprises—this is the final, downloadable file.
Original: $10.00
-65%$10.00
$3.50Description
Your Competitive Advantage Starts with This Report
Gain strategic clarity with our PESTLE Analysis of Paul Merchants—concise, actionable insights into political, economic, social, technological, legal and environmental drivers shaping its future. Ideal for investors and strategists; purchase the full report for a detailed, downloadable breakdown.
Political factors
RBI oversight and policy direction
RBI shapes rules for remittances, forex and payments, impacting licensing, capital and operations for Paul Merchants; cross-border remittances to India exceed $100 billion annually. Policy shifts on money-transfer schemes or outsourcing can materially alter cost structures and compliance burdens. Close alignment with RBI priorities—financial inclusion and digital payments—supports growth, while tightening on forex or MTO arrangements could slow expansion.
Government push for financial inclusion
Government financial-inclusion drives expand Paul Merchants addressable market: Pradhan Mantri Jan Dhan reached about 462 million accounts, UPI exceeded 100 billion transactions in 2024, and DBT channels route roughly INR 12 lakh crore annually, channeling subsidies and wages into formal accounts; rural outreach and subsidy flows lift branch/agent volumes and political momentum keeps the network relevant beyond metros.
International relations and remittance corridors
Bilateral ties with the GCC, US, UK and Southeast Asia shape migrant flows and remittance throughput; GCC hosts roughly 25 million migrant workers while global remittances to low- and middle-income countries were about $630 billion in 2022 (World Bank), concentrating volumes on those corridors. Visa regimes, labor pacts and geopolitical tensions raise compliance costs or can abruptly disrupt corridors, increasing operational risk and liquidity needs. Favorable diplomacy facilitates correspondent partnerships and market access, while sanctions shifts—illustrated by recent Russia-related measures—force rapid updates to screening and controls, elevating compliance spend and transaction delays.
Public sector competition and partnerships
Policy support for India Post Payments Bank and public banks can intensify last-mile competition while offering politically backed tie-ups for payout distribution and travel forex; India Post’s network of 154,965 post offices (as of March 2024) underpins scale for such partnerships.
- Competition: public-bank/IPPB outreach vs fintech
- Tie-ups: payout & travel forex often government-facilitated
- Seasonality: pilgrimage/travel programs drive forex spikes
- Risk: stability of government programs affects planning
Election-cycle policy uncertainty
Election-cycle policy shifts—budget reassignments, fee caps, or tax tweaks—can materially change pricing and demand; firms should note that major electoral years in 2024–25 produced heightened regulatory review in banking and fintech sectors. Administrative continuity enables multi-year tech and branch investments with typical payback horizons of 3–5 years, while short-term uncertainty often delays partnerships or product launches by months. Risk hedging and scenario planning are essential to protect margins and timing.
RBI rules reshape cross-border remittances amid India’s $100B+ inflows and UPI boom
RBI rules on remittances, forex and MTO licensing directly affect Paul Merchants; cross-border remittances to India exceed $100 billion annually. Financial-inclusion drives magnify addressable market: Jan Dhan ~462 million accounts, UPI >100 billion txns in 2024, DBT ~INR 12 lakh crore. GCC migrant stock ~25 million and global remittances ~$630 billion (2022) concentrate corridor risk and compliance costs.
| Metric | Value |
|---|---|
| India remittances | $100+ bn/yr |
| Jan Dhan | 462M accounts |
| UPI 2024 | 100B+ txns |
| DBT | INR 12 lakh crore |
| Post offices | 154,965 (Mar 2024) |
What is included in the product
Detailed Word Document
Explores how macro-environmental factors uniquely affect Paul Merchants across Political, Economic, Social, Technological, Environmental, and Legal dimensions, with data-backed trends and regionally relevant examples. Designed for executives and investors, it delivers clean, forward-looking insights ready for plans, decks, or scenario planning.
Customizable Excel Spreadsheet
Paul Merchants PESTLE Analysis condenses external factors into a clean, visually segmented summary that’s easily shareable and editable, helping teams quickly align on risks, market positioning, and strategic actions.
Economic factors
INR volatility and FX spreads
Exchange-rate swings (INR near 83/USD in June 2025) compress margins on currency exchange and remittance conversion as conversion costs move with spot. Volatility—implied FX vols near 9–10% in 2024—can widen spreads but dampen consumer remittance demand. Robust treasury and active hedging programs stabilize reported earnings by smoothing realized FX effects. Transparent pricing during sharp INR moves preserves customer trust and volume.
Migration and employment trends
Overseas and domestic migrant employment drives remittance volumes—India received about $111 billion in remittances in 2023, underpinning Paul Merchants’ core flows. GCC construction and services cycles and India’s job market affect average ticket sizes as hiring in 2023–24 remained uneven. Brent averaged roughly $86/bbl in 2023, so oil-driven GCC budget shifts materially influence remitter incomes. Diversified corridors (GCC, UK, USA) reduce cyclicality.
Tourism and travel cycles
Outbound and inbound tourism, plus rising student mobility, drive demand for forex cards and cash—global international tourism receipts recovered to about 95% of 2019 levels in 2023, totaling roughly USD 1.4 trillion, boosting transaction volumes. Macroeconomic health, airfares and disposable income create clear seasonality in flows. Shocks like pandemics or oil-price spikes can sharply compress volumes. A flexible product mix (prepaid cards, multi-currency wallets, emergency cash) helps buffer troughs.
Interest rates and liquidity conditions
Policy rates drive Paul Merchants’ working capital and partner float economics; US federal funds at 5.25–5.50% (June 2025) raises short-term funding costs and squeezes margins. Tight liquidity elevates transaction costs and settlement risk, while lower rates historically boost travel and remittance volumes, making dynamic pricing and active cash management critical levers.
- Rate environment: US Fed 5.25–5.50% (Jun 2025)
- Impact: higher working capital cost, partner float compression
- Risk: increased transaction/settlement costs under tight liquidity
- Levers: dynamic pricing, cash pooling, float optimization
Competitive fee compression
Fintechs and banks use scale and digital rails to push fees lower, forcing competitive fee compression in remittances and forex; World Bank data showed the global average remittance cost near 6.4% in 2023, underscoring price sensitivity and the need for efficiency gains. Paul Merchants can offset margin pressure with value-added services and loyalty programs while optimizing cost-to-serve to preserve profitability.
- Scale-driven pricing
- Average remittance cost ~6.4% (2023)
- Value-adds offset margins
- Cost-to-serve optimization
RBI rules reshape cross-border remittances amid India’s $100B+ inflows and UPI boom
INR ~83/USD (Jun 2025) and Fed funds 5.25–5.50% (Jun 2025) raise funding costs and compress remittance margins; hedging and treasury programs mitigate earnings volatility. India remittances $111B (2023) and global remittance cost ~6.4% (2023) keep price sensitivity high. Tourism recovery (~$1.4T receipts, 2023) and GCC oil swings (Brent ~$86/bbl, 2023) drive corridor volumes and ticket sizes.
| Metric | Value |
|---|---|
| INR/USD (Jun 2025) | ~83 |
| Fed funds (Jun 2025) | 5.25–5.50% |
| India remittances (2023) | $111B |
| Avg remittance cost (2023) | ~6.4% |
| Global tourism receipts (2023) | ~$1.4T |
| Brent (2023 avg) | ~$86/bbl |
Full Version Awaits
Paul Merchants PESTLE Analysis
The Paul Merchants PESTLE Analysis provides a concise assessment of political, economic, social, technological, legal, and environmental factors affecting the company, with actionable insights for strategy and risk management. The preview shown here is the exact document you’ll receive after purchase—fully formatted and ready to use. No placeholders or surprises—this is the final, downloadable file.











