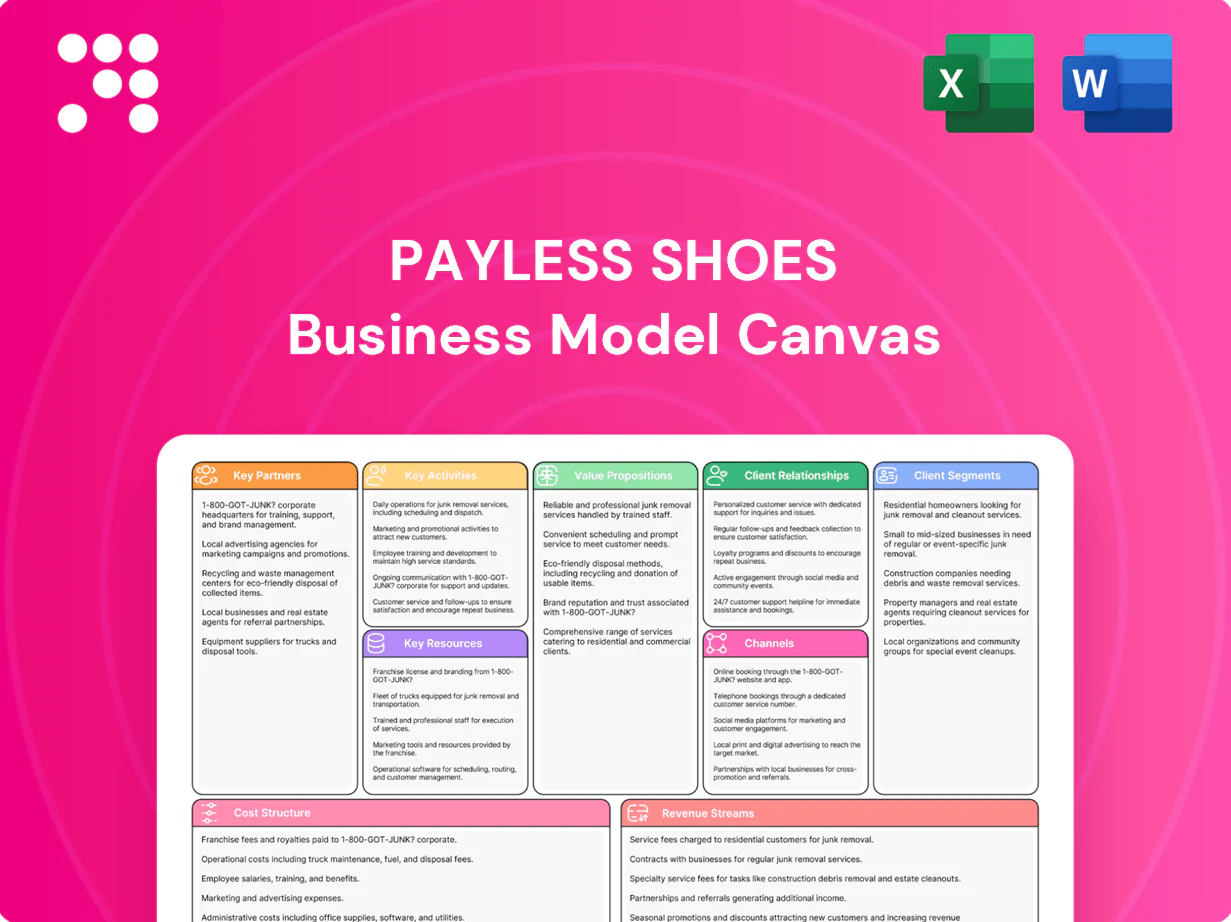
Payless Shoes Business Model Canvas

Unlock the strategic blueprint of a leading discount footwear retailer's Business Model Canvas
Unlock the full strategic blueprint behind Payless Shoes’s Business Model Canvas—an in-depth map of how the brand creates value, manages costs, and monetizes scale. This concise canvas highlights value propositions, channels, key partners, and revenue levers. Ideal for entrepreneurs, analysts, and investors seeking actionable insights. Download the Word/Excel file to benchmark and implement proven retail strategies.
Partnerships

Global footwear manufacturers
Partner with low-cost and mid-tier factories capable of scaling to 1–5 million pairs annually, securing volume discounts of 10–20% and flexible MOQs as low as 500–1,000 pairs to manage seasonal swings. Co-develop value-engineered designs that cut unit costs 5–15% while preserving style and durability. Mandate third-party audits and corrective-action plans to ensure labor and quality compliance and protect brand reputation in the $420B global footwear market (2024).
Sourcing agents and wholesalers
Sourcing agents and wholesalers let Payless widen supplier options and shorten lead times—ocean transit from Asia to the US averages 30–45 days, and intermediaries can cut sourcing delays through local consolidation. Their market intelligence helps spot trend-right SKUs at optimal prices, improving SKU turn and reducing markdowns. Consolidating orders reduces logistics complexity and inventory carrying costs, typically 20–30% of inventory value, while contingency sources mitigate supply disruptions.

Logistics and 3PL providers
Partner with freight forwarders, ocean carriers and last-mile couriers to scale volume and negotiate rates; improved container utilization (8–12% uplift) and cross-docking can lower transport and handling costs by up to 15% in 2024 benchmarks. Integrate WMS/TMS for real-time visibility—industry studies show ~30% faster order cycles—enabling coordinated BOPIS and ship-from-store that can raise same-day fulfillment to ~50% and cut last-mile cost ~20%.

Marketplace and tech platforms
Retail landlords and co-marketing allies
Partner with retail landlords to secure favorable leases in value-oriented centers and high-traffic strips, leveraging Payless experience that once peaked at over 4,100 global stores to justify rent tiers. Collaborate with adjacent family retailers for cross-promotions, coordinate local events and coupons to boost footfall, and use landlord traffic and demographic data to refine tenant mix and store formats.
- Lease leverage: value centers
- Co-promo: family retailers
- Local events & coupons
- Use landlord footfall & demo data
Partnerships cut costs and speed fulfillment: factories 10-20% off, logistics 30% faster
Key partnerships secure low-cost factories (10–20% volume discounts, MOQ 500–1,000), logistics and WMS/TMS (30% faster order cycles) and e-commerce/payment partners (fees 2.5–3.5%, +10–15% conversion). Marketplaces clear 20–35% of online footwear volume (2024) and landlords enable favorable leases for high-footfall value centers.
| Partner | Metric |
|---|---|
| Factories | 10–20% discount, MOQ 500–1,000 |
| Logistics/WMS | +30% cycle speed |
| Marketplaces | 20–35% volume (2024) |
What is included in the product
 Detailed Word Document
A concise, pre-written Business Model Canvas for Payless Shoes detailing customer segments, omnichannel channels, value propositions of affordable footwear, key partners, cost structure and revenue streams across 9 BMC blocks. Ideal for investors and strategists, it highlights operational efficiencies, competitive advantages, and market risks to support funding and strategic planning.

 Customizable Excel Spreadsheet
High-level view of Payless Shoes’ business model with editable cells to quickly pinpoint cost drivers, retail channel weaknesses, and margin leakages—relieving the pain of fragmented strategy reviews and accelerating turnaround decisions.
Activities

Assortment planning and merchandising
Curate core basics, seasonal trend lines and private-labels to cover value shoppers in a U.S. footwear market worth about $88 billion in 2024; balance entry-to-mid price points to align with family budgets and median apparel spend patterns. Manage store-cluster size curves and depth to minimize stockouts while using refreshed endcaps and targeted promos to lift impulse sales and conversion.
Supply chain and inventory management
Forecast demand from historical sales and promotion lift rates, targeting weekly cadence to align buys with sell-through; replenish fast-movers rapidly and markdown slow SKUs within promotional windows to protect margin. Allocate inventory across stores, DCs and e-commerce (e-commerce = 22% of global retail sales in 2024) and operate reverse logistics for returns and defects to recover value.

Omnichannel retail operations
Run efficient store processes supporting BOPIS and curbside pickup, enable ship-from-store to boost sell-through and reduce markdowns; omnichannel shoppers in 2024 spend roughly 10–20% more than single-channel buyers. Maintain consistent pricing and promotions across channels to protect margin and conversion. Train staff for fitting, sizing and handling digital orders to improve fulfillment speed and conversion.

Marketing and promotions
Execute weekly deals, bundles and family discounts to drive repeat visits; target value-seeking households via segmented email and SMS (SMS open rates ~98% and CTR ~19% in 2024). Deploy localized ads to lift store traffic by ~15–25% and optimize SEO/SEM to capture intent-driven searches, with organic search delivering ~53% of website traffic (2024 data).
- Deals/Bundles
- Email+SMS targeting
- Localized ads (+15–25% store visits)
- SEO/SEM (organic ≈53% traffic)
Product development and quality control
Design and source private-label styles tuned to value-fashion trends, with materials tested for comfort and durability and QA enforced at supplier factories plus inbound checks at distribution centers to limit defects. Product teams iterate rapidly using returns and reviews data to refine fits and SKUs; online footwear return rates averaged about 25% in 2024, driving faster design cycles to cut costly returns.
- Private-label focus
- Material testing
- Factory QA + DC checks
- Data-driven iteration (returns ~25% in 2024)
Private-label footwear for US families — $88B, omnichannel growth
Curate value-driven basics and private-labels to serve families in a US footwear market ≈$88B (2024), balancing entry-to-mid price points and store clusters to reduce stockouts. Run weekly demand forecasts, rapid replenishment and markdown cadence; e-commerce (22% of retail sales, 2024) and omnichannel shoppers spend ~10–20% more. Execute localized promos, SMS/email (SMS open ~98%, CTR ~19%, 2024) and SEO (organic ≈53% traffic) to drive traffic; manage returns (~25% online, 2024) with QA and fast design iteration.
| Activity | KPI | 2024 Metric |
|---|---|---|
| Market focus | Market size | $88B US footwear |
| Omnichannel ops | E-comm share | 22% |
| Marketing | SMS open/CTR | 98% / 19% |
| Product | Return rate | 25% |
Full Document Unlocks After Purchase
Business Model Canvas
The document you're previewing is the actual Payless Shoes Business Model Canvas—not a mockup. When you purchase, you’ll receive this exact file with every section included, ready to edit and present. Delivery includes the same professionally formatted Word and Excel versions for immediate download.

Unlock the strategic blueprint of a leading discount footwear retailer's Business Model Canvas
Unlock the full strategic blueprint behind Payless Shoes’s Business Model Canvas—an in-depth map of how the brand creates value, manages costs, and monetizes scale. This concise canvas highlights value propositions, channels, key partners, and revenue levers. Ideal for entrepreneurs, analysts, and investors seeking actionable insights. Download the Word/Excel file to benchmark and implement proven retail strategies.
Partnerships
Global footwear manufacturers
Partner with low-cost and mid-tier factories capable of scaling to 1–5 million pairs annually, securing volume discounts of 10–20% and flexible MOQs as low as 500–1,000 pairs to manage seasonal swings. Co-develop value-engineered designs that cut unit costs 5–15% while preserving style and durability. Mandate third-party audits and corrective-action plans to ensure labor and quality compliance and protect brand reputation in the $420B global footwear market (2024).
Sourcing agents and wholesalers
Sourcing agents and wholesalers let Payless widen supplier options and shorten lead times—ocean transit from Asia to the US averages 30–45 days, and intermediaries can cut sourcing delays through local consolidation. Their market intelligence helps spot trend-right SKUs at optimal prices, improving SKU turn and reducing markdowns. Consolidating orders reduces logistics complexity and inventory carrying costs, typically 20–30% of inventory value, while contingency sources mitigate supply disruptions.
Logistics and 3PL providers
Partner with freight forwarders, ocean carriers and last-mile couriers to scale volume and negotiate rates; improved container utilization (8–12% uplift) and cross-docking can lower transport and handling costs by up to 15% in 2024 benchmarks. Integrate WMS/TMS for real-time visibility—industry studies show ~30% faster order cycles—enabling coordinated BOPIS and ship-from-store that can raise same-day fulfillment to ~50% and cut last-mile cost ~20%.
Marketplace and tech platforms
Retail landlords and co-marketing allies
Partner with retail landlords to secure favorable leases in value-oriented centers and high-traffic strips, leveraging Payless experience that once peaked at over 4,100 global stores to justify rent tiers. Collaborate with adjacent family retailers for cross-promotions, coordinate local events and coupons to boost footfall, and use landlord traffic and demographic data to refine tenant mix and store formats.
- Lease leverage: value centers
- Co-promo: family retailers
- Local events & coupons
- Use landlord footfall & demo data
Partnerships cut costs and speed fulfillment: factories 10-20% off, logistics 30% faster
Key partnerships secure low-cost factories (10–20% volume discounts, MOQ 500–1,000), logistics and WMS/TMS (30% faster order cycles) and e-commerce/payment partners (fees 2.5–3.5%, +10–15% conversion). Marketplaces clear 20–35% of online footwear volume (2024) and landlords enable favorable leases for high-footfall value centers.
| Partner | Metric |
|---|---|
| Factories | 10–20% discount, MOQ 500–1,000 |
| Logistics/WMS | +30% cycle speed |
| Marketplaces | 20–35% volume (2024) |
What is included in the product
Detailed Word Document
A concise, pre-written Business Model Canvas for Payless Shoes detailing customer segments, omnichannel channels, value propositions of affordable footwear, key partners, cost structure and revenue streams across 9 BMC blocks. Ideal for investors and strategists, it highlights operational efficiencies, competitive advantages, and market risks to support funding and strategic planning.
Customizable Excel Spreadsheet
High-level view of Payless Shoes’ business model with editable cells to quickly pinpoint cost drivers, retail channel weaknesses, and margin leakages—relieving the pain of fragmented strategy reviews and accelerating turnaround decisions.
Activities
Assortment planning and merchandising
Curate core basics, seasonal trend lines and private-labels to cover value shoppers in a U.S. footwear market worth about $88 billion in 2024; balance entry-to-mid price points to align with family budgets and median apparel spend patterns. Manage store-cluster size curves and depth to minimize stockouts while using refreshed endcaps and targeted promos to lift impulse sales and conversion.
Supply chain and inventory management
Forecast demand from historical sales and promotion lift rates, targeting weekly cadence to align buys with sell-through; replenish fast-movers rapidly and markdown slow SKUs within promotional windows to protect margin. Allocate inventory across stores, DCs and e-commerce (e-commerce = 22% of global retail sales in 2024) and operate reverse logistics for returns and defects to recover value.
Omnichannel retail operations
Run efficient store processes supporting BOPIS and curbside pickup, enable ship-from-store to boost sell-through and reduce markdowns; omnichannel shoppers in 2024 spend roughly 10–20% more than single-channel buyers. Maintain consistent pricing and promotions across channels to protect margin and conversion. Train staff for fitting, sizing and handling digital orders to improve fulfillment speed and conversion.
Marketing and promotions
Execute weekly deals, bundles and family discounts to drive repeat visits; target value-seeking households via segmented email and SMS (SMS open rates ~98% and CTR ~19% in 2024). Deploy localized ads to lift store traffic by ~15–25% and optimize SEO/SEM to capture intent-driven searches, with organic search delivering ~53% of website traffic (2024 data).
- Deals/Bundles
- Email+SMS targeting
- Localized ads (+15–25% store visits)
- SEO/SEM (organic ≈53% traffic)
Product development and quality control
Design and source private-label styles tuned to value-fashion trends, with materials tested for comfort and durability and QA enforced at supplier factories plus inbound checks at distribution centers to limit defects. Product teams iterate rapidly using returns and reviews data to refine fits and SKUs; online footwear return rates averaged about 25% in 2024, driving faster design cycles to cut costly returns.
- Private-label focus
- Material testing
- Factory QA + DC checks
- Data-driven iteration (returns ~25% in 2024)
Private-label footwear for US families — $88B, omnichannel growth
Curate value-driven basics and private-labels to serve families in a US footwear market ≈$88B (2024), balancing entry-to-mid price points and store clusters to reduce stockouts. Run weekly demand forecasts, rapid replenishment and markdown cadence; e-commerce (22% of retail sales, 2024) and omnichannel shoppers spend ~10–20% more. Execute localized promos, SMS/email (SMS open ~98%, CTR ~19%, 2024) and SEO (organic ≈53% traffic) to drive traffic; manage returns (~25% online, 2024) with QA and fast design iteration.
| Activity | KPI | 2024 Metric |
|---|---|---|
| Market focus | Market size | $88B US footwear |
| Omnichannel ops | E-comm share | 22% |
| Marketing | SMS open/CTR | 98% / 19% |
| Product | Return rate | 25% |
Full Document Unlocks After Purchase
Business Model Canvas
The document you're previewing is the actual Payless Shoes Business Model Canvas—not a mockup. When you purchase, you’ll receive this exact file with every section included, ready to edit and present. Delivery includes the same professionally formatted Word and Excel versions for immediate download.
Description
Unlock the strategic blueprint of a leading discount footwear retailer's Business Model Canvas
Unlock the full strategic blueprint behind Payless Shoes’s Business Model Canvas—an in-depth map of how the brand creates value, manages costs, and monetizes scale. This concise canvas highlights value propositions, channels, key partners, and revenue levers. Ideal for entrepreneurs, analysts, and investors seeking actionable insights. Download the Word/Excel file to benchmark and implement proven retail strategies.
Partnerships
Global footwear manufacturers
Partner with low-cost and mid-tier factories capable of scaling to 1–5 million pairs annually, securing volume discounts of 10–20% and flexible MOQs as low as 500–1,000 pairs to manage seasonal swings. Co-develop value-engineered designs that cut unit costs 5–15% while preserving style and durability. Mandate third-party audits and corrective-action plans to ensure labor and quality compliance and protect brand reputation in the $420B global footwear market (2024).
Sourcing agents and wholesalers
Sourcing agents and wholesalers let Payless widen supplier options and shorten lead times—ocean transit from Asia to the US averages 30–45 days, and intermediaries can cut sourcing delays through local consolidation. Their market intelligence helps spot trend-right SKUs at optimal prices, improving SKU turn and reducing markdowns. Consolidating orders reduces logistics complexity and inventory carrying costs, typically 20–30% of inventory value, while contingency sources mitigate supply disruptions.
Logistics and 3PL providers
Partner with freight forwarders, ocean carriers and last-mile couriers to scale volume and negotiate rates; improved container utilization (8–12% uplift) and cross-docking can lower transport and handling costs by up to 15% in 2024 benchmarks. Integrate WMS/TMS for real-time visibility—industry studies show ~30% faster order cycles—enabling coordinated BOPIS and ship-from-store that can raise same-day fulfillment to ~50% and cut last-mile cost ~20%.
Marketplace and tech platforms
Retail landlords and co-marketing allies
Partner with retail landlords to secure favorable leases in value-oriented centers and high-traffic strips, leveraging Payless experience that once peaked at over 4,100 global stores to justify rent tiers. Collaborate with adjacent family retailers for cross-promotions, coordinate local events and coupons to boost footfall, and use landlord traffic and demographic data to refine tenant mix and store formats.
- Lease leverage: value centers
- Co-promo: family retailers
- Local events & coupons
- Use landlord footfall & demo data
Partnerships cut costs and speed fulfillment: factories 10-20% off, logistics 30% faster
Key partnerships secure low-cost factories (10–20% volume discounts, MOQ 500–1,000), logistics and WMS/TMS (30% faster order cycles) and e-commerce/payment partners (fees 2.5–3.5%, +10–15% conversion). Marketplaces clear 20–35% of online footwear volume (2024) and landlords enable favorable leases for high-footfall value centers.
| Partner | Metric |
|---|---|
| Factories | 10–20% discount, MOQ 500–1,000 |
| Logistics/WMS | +30% cycle speed |
| Marketplaces | 20–35% volume (2024) |
What is included in the product
Detailed Word Document
A concise, pre-written Business Model Canvas for Payless Shoes detailing customer segments, omnichannel channels, value propositions of affordable footwear, key partners, cost structure and revenue streams across 9 BMC blocks. Ideal for investors and strategists, it highlights operational efficiencies, competitive advantages, and market risks to support funding and strategic planning.
Customizable Excel Spreadsheet
High-level view of Payless Shoes’ business model with editable cells to quickly pinpoint cost drivers, retail channel weaknesses, and margin leakages—relieving the pain of fragmented strategy reviews and accelerating turnaround decisions.
Activities
Assortment planning and merchandising
Curate core basics, seasonal trend lines and private-labels to cover value shoppers in a U.S. footwear market worth about $88 billion in 2024; balance entry-to-mid price points to align with family budgets and median apparel spend patterns. Manage store-cluster size curves and depth to minimize stockouts while using refreshed endcaps and targeted promos to lift impulse sales and conversion.
Supply chain and inventory management
Forecast demand from historical sales and promotion lift rates, targeting weekly cadence to align buys with sell-through; replenish fast-movers rapidly and markdown slow SKUs within promotional windows to protect margin. Allocate inventory across stores, DCs and e-commerce (e-commerce = 22% of global retail sales in 2024) and operate reverse logistics for returns and defects to recover value.
Omnichannel retail operations
Run efficient store processes supporting BOPIS and curbside pickup, enable ship-from-store to boost sell-through and reduce markdowns; omnichannel shoppers in 2024 spend roughly 10–20% more than single-channel buyers. Maintain consistent pricing and promotions across channels to protect margin and conversion. Train staff for fitting, sizing and handling digital orders to improve fulfillment speed and conversion.
Marketing and promotions
Execute weekly deals, bundles and family discounts to drive repeat visits; target value-seeking households via segmented email and SMS (SMS open rates ~98% and CTR ~19% in 2024). Deploy localized ads to lift store traffic by ~15–25% and optimize SEO/SEM to capture intent-driven searches, with organic search delivering ~53% of website traffic (2024 data).
- Deals/Bundles
- Email+SMS targeting
- Localized ads (+15–25% store visits)
- SEO/SEM (organic ≈53% traffic)
Product development and quality control
Design and source private-label styles tuned to value-fashion trends, with materials tested for comfort and durability and QA enforced at supplier factories plus inbound checks at distribution centers to limit defects. Product teams iterate rapidly using returns and reviews data to refine fits and SKUs; online footwear return rates averaged about 25% in 2024, driving faster design cycles to cut costly returns.
- Private-label focus
- Material testing
- Factory QA + DC checks
- Data-driven iteration (returns ~25% in 2024)
Private-label footwear for US families — $88B, omnichannel growth
Curate value-driven basics and private-labels to serve families in a US footwear market ≈$88B (2024), balancing entry-to-mid price points and store clusters to reduce stockouts. Run weekly demand forecasts, rapid replenishment and markdown cadence; e-commerce (22% of retail sales, 2024) and omnichannel shoppers spend ~10–20% more. Execute localized promos, SMS/email (SMS open ~98%, CTR ~19%, 2024) and SEO (organic ≈53% traffic) to drive traffic; manage returns (~25% online, 2024) with QA and fast design iteration.
| Activity | KPI | 2024 Metric |
|---|---|---|
| Market focus | Market size | $88B US footwear |
| Omnichannel ops | E-comm share | 22% |
| Marketing | SMS open/CTR | 98% / 19% |
| Product | Return rate | 25% |
Full Document Unlocks After Purchase
Business Model Canvas
The document you're previewing is the actual Payless Shoes Business Model Canvas—not a mockup. When you purchase, you’ll receive this exact file with every section included, ready to edit and present. Delivery includes the same professionally formatted Word and Excel versions for immediate download.











