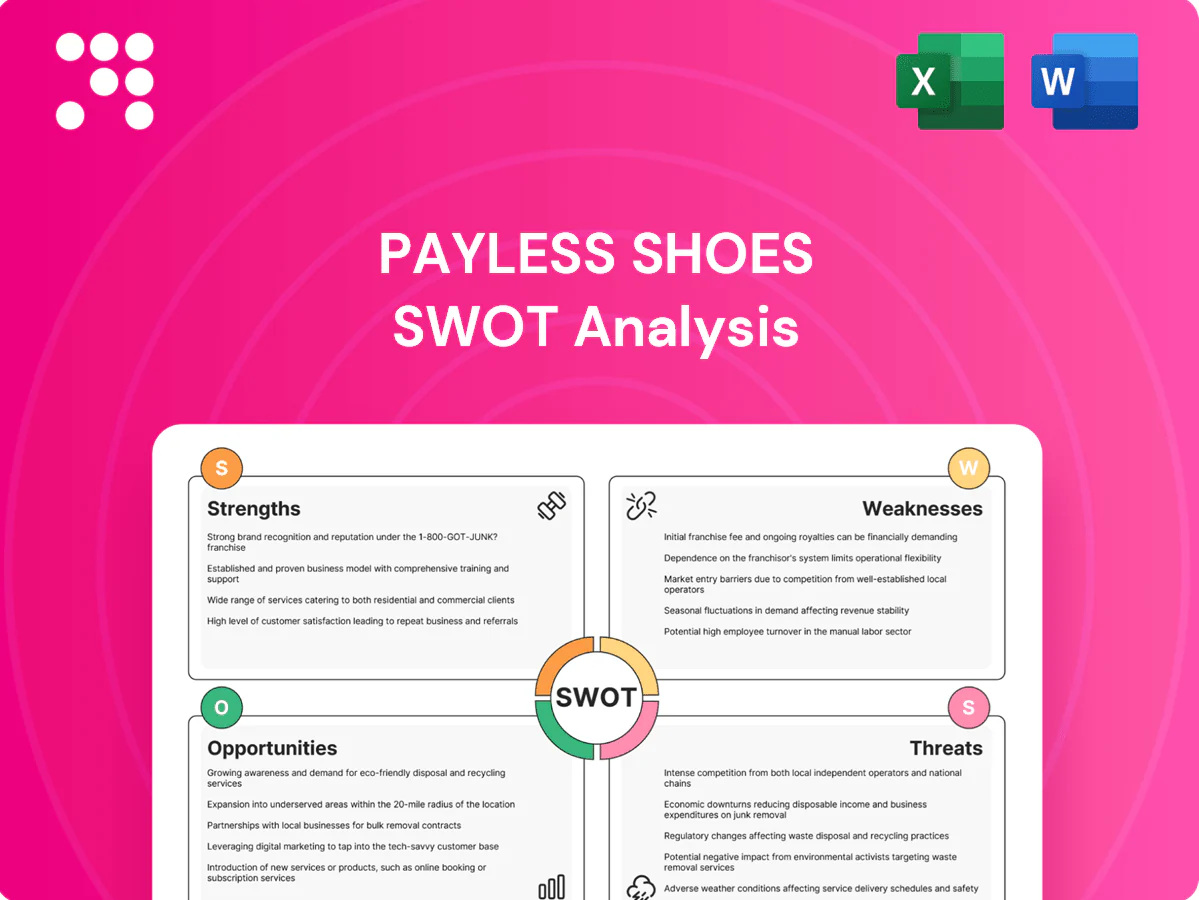
Payless Shoes SWOT Analysis

Go Beyond the Preview—Access the Full Strategic Report
Payless Shoes faces resilient brand recognition and low-cost scale but struggles with retail shifts and thin margins; our concise SWOT highlights competitive pricing, supply-chain leverage, market threats, and expansion opportunities. Want the full story behind the company’s strengths, risks, and growth drivers? Purchase the complete SWOT analysis to gain access to a professionally written, fully editable report designed to support planning, pitches, and research.
Strengths

Everyday low pricing
Aggressive everyday-low pricing attracts budget-conscious families and drives high volume, leveraging Payless’s historical scale—about 5,000 stores at peak—to be a go-to for affordable essentials and trend-right looks. Consistent price points simplify purchase decisions and increase basket size, supporting repeat visits. Scale purchasing and narrow margins help sustain price leadership without eroding core value in a global footwear market valued at roughly $365 billion in 2023.
Broad family assortment
Serving men, women and children lets Payless be a one-stop destination, driving multiproduct trips (socks, accessories, seasonal) that boost average order value; US footwear retail sales reached about $88 billion in 2023, highlighting market scale. Year-round basics smooth demand across trend cycles, while wide size and wide-fit options expand the addressable customer base and reduce lost sales.

Omnichannel reach
Payless combines physical retail and e-commerce—leveraging a historical footprint of about 3,300 stores across roughly 40 countries at its peak—and an online relaunch in 2020 to boost convenience and coverage. Click-and-collect and ship-to-store lower last-mile costs and help reduce returns by enabling in-person fitting. Unified local inventory visibility and shared customer data across channels support more targeted promotions and higher conversion.

High brand recognition
Founded in 1956, Payless's nearly 70-year presence in discount footwear creates strong name recall. Consistent top-of-mind awareness lowers customer acquisition costs, and its trusted value proposition drives higher repeat purchases among budget-conscious shoppers. Local store footprints and community ties reinforce accessibility and convenience.
- Founded 1956 — nearly 70 years of brand history
- Top-of-mind awareness reduces acquisition costs
- Trusted value proposition boosts repeat purchases
- Local store presence strengthens accessibility
Private label capability
Private label brands give Payless higher gross margins than wholesale by capturing retailer markup and reducing supplier fees, enabling stronger price-profit balance.
Faster design-to-shelf cycles let Payless respond to trends quickly, keeping assortments fresh and turnover high.
Owning materials and specs stabilizes quality at targeted price points and differentiated SKUs lower direct price comparisons.
- Higher margins via owned brands
- Faster trend responsiveness
- Quality control at price targets
- SKU differentiation reduces price competition
Aggressive low prices, ~5,000 stores and omnichannel reach drive high-volume footwear sales
Aggressive everyday-low pricing and peak scale (~5,000 stores historically) make Payless a go-to for affordable essentials, supporting high volume and repeat visits.
Wide assortment for men, women and children plus private-labels boost average basket value and margins, with faster design-to-shelf cycles driving turnover.
Omnichannel reach (historic ~3,300 stores in ~40 countries; online relaunch 2020) and near-70-year brand recall lower acquisition costs and increase accessibility.
| Metric | Value |
|---|---|
| Founded | 1956 |
| Peak stores | ~5,000 |
| Global footwear market (2023) | $365B |
| US footwear retail (2023) | $88B |
What is included in the product
 Detailed Word Document
Provides a concise SWOT overview of Payless Shoes, highlighting internal strengths and weaknesses and external opportunities and threats; maps competitive position, growth drivers, operational gaps, and market risks to inform strategic decisions.

 Customizable Excel Spreadsheet
Provides a clear, visual SWOT matrix that highlights Payless Shoes’ cost-leadership strengths and market vulnerabilities for rapid strategy alignment, enabling quick stakeholder buy-in. Editable format allows fast updates to reflect shifting retail dynamics and competitive threats for on-the-fly decision-making.
Weaknesses

Value-quality perception
Low everyday prices often signal lower durability compared with specialty brands, and negative reviews about comfort or lifespan have reduced repeat purchase intent for value retailers. Upgrading materials to boost perceived quality would likely compress already thin gross margins. Effectively communicating product improvements across channels remains an ongoing marketing challenge for the brand.
Thin margin structure
Discount pricing yields slim gross margins—estimated ~30–35% for value footwear like Payless—so a 2–4ppt jump in COGS or heavy promotions can wipe out profits; promotional depth often reduces margins by several points. Ecommerce adds ~25–30% return rates and 3–5% higher fulfillment/freight costs, forcing tight cost control to stay competitive.

Limited differentiation
Styles often overlap with mass merchants and online marketplaces, inviting direct price comparisons and higher customer churn.
Payless brand equity centers on low price rather than design innovation; Payless filed Chapter 11 in 2019, highlighting vulnerability to competitive pressure and weak loyalty in fashion-driven segments.
In a global footwear market estimated at $365 billion in 2023, limited distinctiveness makes commanding premium share difficult.

Store footprint constraints
Legacy Payless sites remain concentrated in secondary, lower-traffic centers where occupancy costs have risen faster than sales; by 2024 an estimated share of its footprint remained in subregional malls and strip centers, limiting footfall. Smaller-format stores constrain experiential retailing and inventory depth, inconsistent in-store execution depresses conversion, and ongoing store rationalization risks eroding local brand awareness.
- 2024 footprint: significant concentration in secondary centers
- Smaller formats: limited SKU depth and experience
- Execution: inconsistent conversion impact
- Rationalization: reduces local visibility
Fit and returns friction
Online footwear return rates averaged 30–35% in 2024 due to sizing variability, forcing Payless into costly reverse logistics; returns cost an estimated $12–18 per unit and can shave roughly 200–300 basis points off gross margin.
- 30–35% online return rate (2024)
- $12–18 average reverse-logistics cost per return
- 200–300 bps margin erosion
- 10–15% lower conversion without fit tech
- Seamless exchanges required to retain customers
Low-price retail: 30-35% margins and returns erode profits
Low-price positioning drives weak perceived durability and low loyalty; 2019 Chapter 11 underscores vulnerability.
Thin gross margins (~30–35%) mean 2–4ppt COGS or deep promos can erase profits.
Online returns 30–35% in 2024 cost $12–18/unit, shaving ~200–300bps margin.
Footprint concentrated in secondary centers; smaller formats limit SKU depth and conversion.
| Metric | Value (2023/24) |
|---|---|
| Gross margin | ~30–35% |
| Online return rate | 30–35% |
| Return cost/unit | $12–18 |
| Margin erosion | 200–300bps |
Preview Before You Purchase
Payless Shoes SWOT Analysis
This is the actual SWOT analysis document you’ll receive upon purchase—no surprises, just professional quality. The preview below is taken directly from the full SWOT report you'll get, and buying unlocks the complete, editable version. You’re viewing a live preview of the real file; the full detailed Payless analysis becomes available after checkout.

Go Beyond the Preview—Access the Full Strategic Report
Payless Shoes faces resilient brand recognition and low-cost scale but struggles with retail shifts and thin margins; our concise SWOT highlights competitive pricing, supply-chain leverage, market threats, and expansion opportunities. Want the full story behind the company’s strengths, risks, and growth drivers? Purchase the complete SWOT analysis to gain access to a professionally written, fully editable report designed to support planning, pitches, and research.
Strengths
Everyday low pricing
Aggressive everyday-low pricing attracts budget-conscious families and drives high volume, leveraging Payless’s historical scale—about 5,000 stores at peak—to be a go-to for affordable essentials and trend-right looks. Consistent price points simplify purchase decisions and increase basket size, supporting repeat visits. Scale purchasing and narrow margins help sustain price leadership without eroding core value in a global footwear market valued at roughly $365 billion in 2023.
Broad family assortment
Serving men, women and children lets Payless be a one-stop destination, driving multiproduct trips (socks, accessories, seasonal) that boost average order value; US footwear retail sales reached about $88 billion in 2023, highlighting market scale. Year-round basics smooth demand across trend cycles, while wide size and wide-fit options expand the addressable customer base and reduce lost sales.
Omnichannel reach
Payless combines physical retail and e-commerce—leveraging a historical footprint of about 3,300 stores across roughly 40 countries at its peak—and an online relaunch in 2020 to boost convenience and coverage. Click-and-collect and ship-to-store lower last-mile costs and help reduce returns by enabling in-person fitting. Unified local inventory visibility and shared customer data across channels support more targeted promotions and higher conversion.
High brand recognition
Founded in 1956, Payless's nearly 70-year presence in discount footwear creates strong name recall. Consistent top-of-mind awareness lowers customer acquisition costs, and its trusted value proposition drives higher repeat purchases among budget-conscious shoppers. Local store footprints and community ties reinforce accessibility and convenience.
- Founded 1956 — nearly 70 years of brand history
- Top-of-mind awareness reduces acquisition costs
- Trusted value proposition boosts repeat purchases
- Local store presence strengthens accessibility
Private label capability
Private label brands give Payless higher gross margins than wholesale by capturing retailer markup and reducing supplier fees, enabling stronger price-profit balance.
Faster design-to-shelf cycles let Payless respond to trends quickly, keeping assortments fresh and turnover high.
Owning materials and specs stabilizes quality at targeted price points and differentiated SKUs lower direct price comparisons.
- Higher margins via owned brands
- Faster trend responsiveness
- Quality control at price targets
- SKU differentiation reduces price competition
Aggressive low prices, ~5,000 stores and omnichannel reach drive high-volume footwear sales
Aggressive everyday-low pricing and peak scale (~5,000 stores historically) make Payless a go-to for affordable essentials, supporting high volume and repeat visits.
Wide assortment for men, women and children plus private-labels boost average basket value and margins, with faster design-to-shelf cycles driving turnover.
Omnichannel reach (historic ~3,300 stores in ~40 countries; online relaunch 2020) and near-70-year brand recall lower acquisition costs and increase accessibility.
| Metric | Value |
|---|---|
| Founded | 1956 |
| Peak stores | ~5,000 |
| Global footwear market (2023) | $365B |
| US footwear retail (2023) | $88B |
What is included in the product
Detailed Word Document
Provides a concise SWOT overview of Payless Shoes, highlighting internal strengths and weaknesses and external opportunities and threats; maps competitive position, growth drivers, operational gaps, and market risks to inform strategic decisions.
Customizable Excel Spreadsheet
Provides a clear, visual SWOT matrix that highlights Payless Shoes’ cost-leadership strengths and market vulnerabilities for rapid strategy alignment, enabling quick stakeholder buy-in. Editable format allows fast updates to reflect shifting retail dynamics and competitive threats for on-the-fly decision-making.
Weaknesses
Value-quality perception
Low everyday prices often signal lower durability compared with specialty brands, and negative reviews about comfort or lifespan have reduced repeat purchase intent for value retailers. Upgrading materials to boost perceived quality would likely compress already thin gross margins. Effectively communicating product improvements across channels remains an ongoing marketing challenge for the brand.
Thin margin structure
Discount pricing yields slim gross margins—estimated ~30–35% for value footwear like Payless—so a 2–4ppt jump in COGS or heavy promotions can wipe out profits; promotional depth often reduces margins by several points. Ecommerce adds ~25–30% return rates and 3–5% higher fulfillment/freight costs, forcing tight cost control to stay competitive.
Limited differentiation
Styles often overlap with mass merchants and online marketplaces, inviting direct price comparisons and higher customer churn.
Payless brand equity centers on low price rather than design innovation; Payless filed Chapter 11 in 2019, highlighting vulnerability to competitive pressure and weak loyalty in fashion-driven segments.
In a global footwear market estimated at $365 billion in 2023, limited distinctiveness makes commanding premium share difficult.
Store footprint constraints
Legacy Payless sites remain concentrated in secondary, lower-traffic centers where occupancy costs have risen faster than sales; by 2024 an estimated share of its footprint remained in subregional malls and strip centers, limiting footfall. Smaller-format stores constrain experiential retailing and inventory depth, inconsistent in-store execution depresses conversion, and ongoing store rationalization risks eroding local brand awareness.
- 2024 footprint: significant concentration in secondary centers
- Smaller formats: limited SKU depth and experience
- Execution: inconsistent conversion impact
- Rationalization: reduces local visibility
Fit and returns friction
Online footwear return rates averaged 30–35% in 2024 due to sizing variability, forcing Payless into costly reverse logistics; returns cost an estimated $12–18 per unit and can shave roughly 200–300 basis points off gross margin.
- 30–35% online return rate (2024)
- $12–18 average reverse-logistics cost per return
- 200–300 bps margin erosion
- 10–15% lower conversion without fit tech
- Seamless exchanges required to retain customers
Low-price retail: 30-35% margins and returns erode profits
Low-price positioning drives weak perceived durability and low loyalty; 2019 Chapter 11 underscores vulnerability.
Thin gross margins (~30–35%) mean 2–4ppt COGS or deep promos can erase profits.
Online returns 30–35% in 2024 cost $12–18/unit, shaving ~200–300bps margin.
Footprint concentrated in secondary centers; smaller formats limit SKU depth and conversion.
| Metric | Value (2023/24) |
|---|---|
| Gross margin | ~30–35% |
| Online return rate | 30–35% |
| Return cost/unit | $12–18 |
| Margin erosion | 200–300bps |
Preview Before You Purchase
Payless Shoes SWOT Analysis
This is the actual SWOT analysis document you’ll receive upon purchase—no surprises, just professional quality. The preview below is taken directly from the full SWOT report you'll get, and buying unlocks the complete, editable version. You’re viewing a live preview of the real file; the full detailed Payless analysis becomes available after checkout.
Original: $10.00
-65%$10.00
$3.50Description
Go Beyond the Preview—Access the Full Strategic Report
Payless Shoes faces resilient brand recognition and low-cost scale but struggles with retail shifts and thin margins; our concise SWOT highlights competitive pricing, supply-chain leverage, market threats, and expansion opportunities. Want the full story behind the company’s strengths, risks, and growth drivers? Purchase the complete SWOT analysis to gain access to a professionally written, fully editable report designed to support planning, pitches, and research.
Strengths
Everyday low pricing
Aggressive everyday-low pricing attracts budget-conscious families and drives high volume, leveraging Payless’s historical scale—about 5,000 stores at peak—to be a go-to for affordable essentials and trend-right looks. Consistent price points simplify purchase decisions and increase basket size, supporting repeat visits. Scale purchasing and narrow margins help sustain price leadership without eroding core value in a global footwear market valued at roughly $365 billion in 2023.
Broad family assortment
Serving men, women and children lets Payless be a one-stop destination, driving multiproduct trips (socks, accessories, seasonal) that boost average order value; US footwear retail sales reached about $88 billion in 2023, highlighting market scale. Year-round basics smooth demand across trend cycles, while wide size and wide-fit options expand the addressable customer base and reduce lost sales.
Omnichannel reach
Payless combines physical retail and e-commerce—leveraging a historical footprint of about 3,300 stores across roughly 40 countries at its peak—and an online relaunch in 2020 to boost convenience and coverage. Click-and-collect and ship-to-store lower last-mile costs and help reduce returns by enabling in-person fitting. Unified local inventory visibility and shared customer data across channels support more targeted promotions and higher conversion.
High brand recognition
Founded in 1956, Payless's nearly 70-year presence in discount footwear creates strong name recall. Consistent top-of-mind awareness lowers customer acquisition costs, and its trusted value proposition drives higher repeat purchases among budget-conscious shoppers. Local store footprints and community ties reinforce accessibility and convenience.
- Founded 1956 — nearly 70 years of brand history
- Top-of-mind awareness reduces acquisition costs
- Trusted value proposition boosts repeat purchases
- Local store presence strengthens accessibility
Private label capability
Private label brands give Payless higher gross margins than wholesale by capturing retailer markup and reducing supplier fees, enabling stronger price-profit balance.
Faster design-to-shelf cycles let Payless respond to trends quickly, keeping assortments fresh and turnover high.
Owning materials and specs stabilizes quality at targeted price points and differentiated SKUs lower direct price comparisons.
- Higher margins via owned brands
- Faster trend responsiveness
- Quality control at price targets
- SKU differentiation reduces price competition
Aggressive low prices, ~5,000 stores and omnichannel reach drive high-volume footwear sales
Aggressive everyday-low pricing and peak scale (~5,000 stores historically) make Payless a go-to for affordable essentials, supporting high volume and repeat visits.
Wide assortment for men, women and children plus private-labels boost average basket value and margins, with faster design-to-shelf cycles driving turnover.
Omnichannel reach (historic ~3,300 stores in ~40 countries; online relaunch 2020) and near-70-year brand recall lower acquisition costs and increase accessibility.
| Metric | Value |
|---|---|
| Founded | 1956 |
| Peak stores | ~5,000 |
| Global footwear market (2023) | $365B |
| US footwear retail (2023) | $88B |
What is included in the product
Detailed Word Document
Provides a concise SWOT overview of Payless Shoes, highlighting internal strengths and weaknesses and external opportunities and threats; maps competitive position, growth drivers, operational gaps, and market risks to inform strategic decisions.
Customizable Excel Spreadsheet
Provides a clear, visual SWOT matrix that highlights Payless Shoes’ cost-leadership strengths and market vulnerabilities for rapid strategy alignment, enabling quick stakeholder buy-in. Editable format allows fast updates to reflect shifting retail dynamics and competitive threats for on-the-fly decision-making.
Weaknesses
Value-quality perception
Low everyday prices often signal lower durability compared with specialty brands, and negative reviews about comfort or lifespan have reduced repeat purchase intent for value retailers. Upgrading materials to boost perceived quality would likely compress already thin gross margins. Effectively communicating product improvements across channels remains an ongoing marketing challenge for the brand.
Thin margin structure
Discount pricing yields slim gross margins—estimated ~30–35% for value footwear like Payless—so a 2–4ppt jump in COGS or heavy promotions can wipe out profits; promotional depth often reduces margins by several points. Ecommerce adds ~25–30% return rates and 3–5% higher fulfillment/freight costs, forcing tight cost control to stay competitive.
Limited differentiation
Styles often overlap with mass merchants and online marketplaces, inviting direct price comparisons and higher customer churn.
Payless brand equity centers on low price rather than design innovation; Payless filed Chapter 11 in 2019, highlighting vulnerability to competitive pressure and weak loyalty in fashion-driven segments.
In a global footwear market estimated at $365 billion in 2023, limited distinctiveness makes commanding premium share difficult.
Store footprint constraints
Legacy Payless sites remain concentrated in secondary, lower-traffic centers where occupancy costs have risen faster than sales; by 2024 an estimated share of its footprint remained in subregional malls and strip centers, limiting footfall. Smaller-format stores constrain experiential retailing and inventory depth, inconsistent in-store execution depresses conversion, and ongoing store rationalization risks eroding local brand awareness.
- 2024 footprint: significant concentration in secondary centers
- Smaller formats: limited SKU depth and experience
- Execution: inconsistent conversion impact
- Rationalization: reduces local visibility
Fit and returns friction
Online footwear return rates averaged 30–35% in 2024 due to sizing variability, forcing Payless into costly reverse logistics; returns cost an estimated $12–18 per unit and can shave roughly 200–300 basis points off gross margin.
- 30–35% online return rate (2024)
- $12–18 average reverse-logistics cost per return
- 200–300 bps margin erosion
- 10–15% lower conversion without fit tech
- Seamless exchanges required to retain customers
Low-price retail: 30-35% margins and returns erode profits
Low-price positioning drives weak perceived durability and low loyalty; 2019 Chapter 11 underscores vulnerability.
Thin gross margins (~30–35%) mean 2–4ppt COGS or deep promos can erase profits.
Online returns 30–35% in 2024 cost $12–18/unit, shaving ~200–300bps margin.
Footprint concentrated in secondary centers; smaller formats limit SKU depth and conversion.
| Metric | Value (2023/24) |
|---|---|
| Gross margin | ~30–35% |
| Online return rate | 30–35% |
| Return cost/unit | $12–18 |
| Margin erosion | 200–300bps |
Preview Before You Purchase
Payless Shoes SWOT Analysis
This is the actual SWOT analysis document you’ll receive upon purchase—no surprises, just professional quality. The preview below is taken directly from the full SWOT report you'll get, and buying unlocks the complete, editable version. You’re viewing a live preview of the real file; the full detailed Payless analysis becomes available after checkout.











