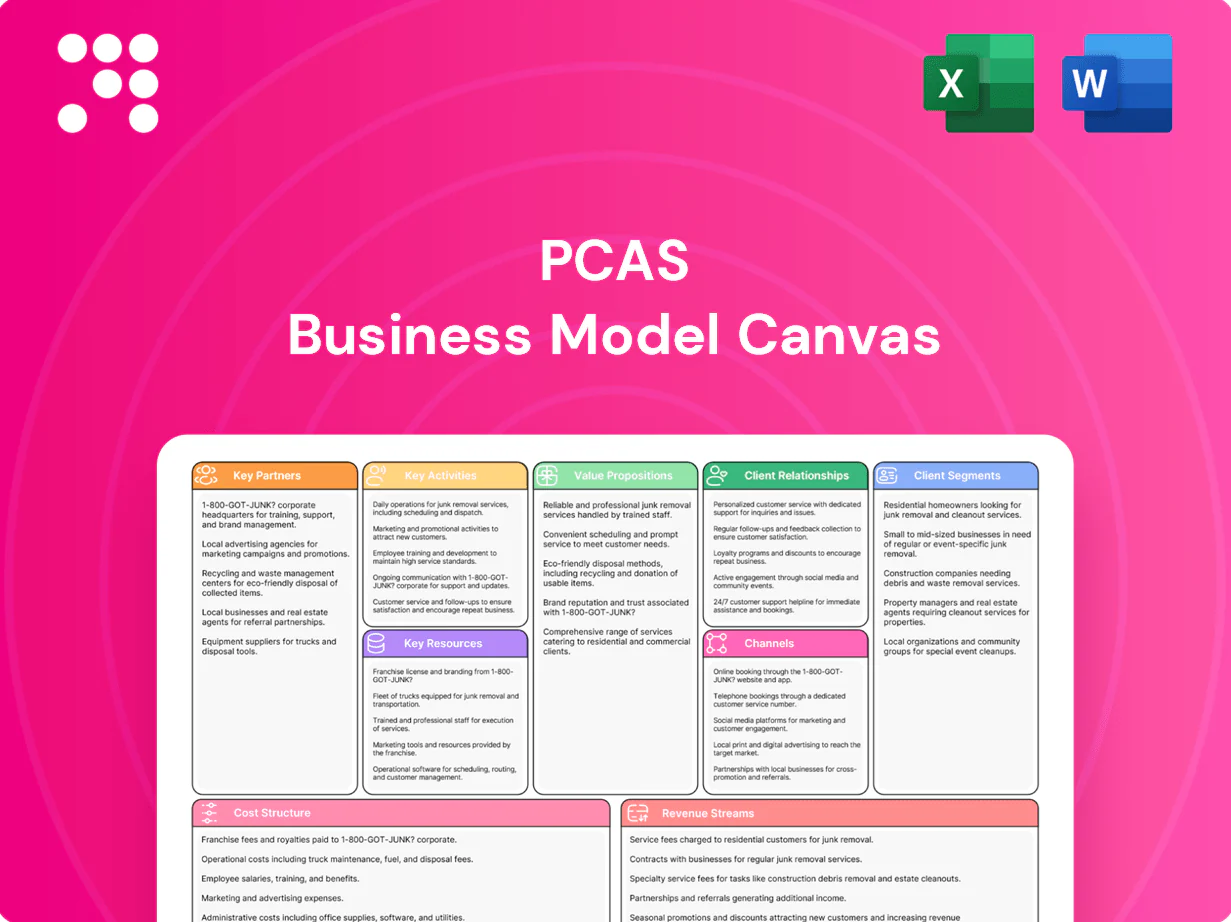
PCAS Business Model Canvas

Unlock the strategic blueprint: concise Business Model Canvas for investors and strategists
Unlock the full strategic blueprint behind PCAS's business model. Our concise Business Model Canvas uncovers how PCAS creates value, scales revenue, and outmaneuvers competitors. Ideal for investors and strategists—download the complete, editable Word and Excel canvas to benchmark, adapt, and accelerate your decisions.
Partnerships

Pharma & biotech sponsors
Partnerships with originator pharma and biotech supply PCAS with project pipelines spanning discovery to commercial, with 3–7 year MSAs commonly used to stabilize volumes and revenue (2024 CDMO market ~170 billion USD). Sponsors co-define specs, timelines and tech-transfer plans to align CMC milestones and reduce scale-up risk. Multi-year agreements enable joint CMC risk management and capacity planning. Co-development deals often include shared IP or negotiated exclusivity terms.
Raw material suppliers
Qualified suppliers ensure continuity of advanced reagents, solvents, and catalysts; dual-sourcing and long-term contracts mitigate price and supply volatility and have been shown in industry studies to lower stockout risk materially. Vendor-managed inventory can reduce lead times by up to 30%, while joint quality audits align specifications and change-control to cut nonconformances and speed approvals.

Equipment & tech vendors
OEMs such as Sartorius, Cytiva, Pall and Eppendorf supply reactors, flow systems, PAT and containment that enable scalable, GMP-compliant processes; the single-use bioreactor market was about USD 3.4 billion in 2024. Service agreements ensure preventive maintenance, calibration per FDA 21 CFR Part 11 and maximize uptime. Early OEM access to new tech improves safety and yield, while co-validation shortens GMP adoption timelines.

CROs & academic labs
CROs and academic labs augment screening, analytics and route scouting, accelerating SAR/SPR cycles and process innovation; industry reports in 2024 cite collaborations cutting lead optimization timelines by up to 40% and lowering scale-up failure rates for complex chemistries. Access to niche methodologies de-risks scale-up and generates publications/case studies that boost credibility in advanced synthesis.
- Faster SAR/SPR: up to 40% reduction (2024)
- Lower scale-up failures for complex routes
- Cost-efficient access to specialized analytics
- Publications/case studies enhance reputation
Logistics & compliance partners
Specialized logistics firms handle temperature-controlled, hazardous and international shipments; the global cold chain market was estimated at $276 billion in 2024, highlighting scale and specialist demand. Regulatory consultants support filings and inspections across jurisdictions; waste partners manage compliant disposal, while insurers and certification bodies underpin risk and quality frameworks.
- cold_chain:$276B_2024
- regs:ISO13485/9001
- waste:compliant_disposal
- risk:insurance_certification
MSAs (3–7y) align CMC risk and shared cost in USD 170B CDMO
Long-term MSAs (3–7 years) with pharma/biotech supply PCAS pipelines and predictable revenue in a ~USD 170B CDMO market (2024), aligning CMC milestones and shared risk. OEMs (Sartorius, Cytiva) provide GMP equipment; single-use bioreactor market ~USD 3.4B (2024) improving scale-up and uptime. Logistics, regs and waste partners secure cold-chain ($276B 2024), compliance and insured transport.
| Partner | Role | 2024 metric |
|---|---|---|
| Sponsors | Pipeline, co-dev | MSAs 3–7y |
| OEMs | Equipment, maintenance | SUR market $3.4B |
| Logistics | Cold chain, hazardous | $276B |
What is included in the product
 Detailed Word Document
A comprehensive, pre-written Business Model Canvas for PCAS that details customer segments, channels, value propositions and revenue streams across the 9 classic BMC blocks, with competitive analysis, SWOT-linked insights and investor-ready presentation design.

 Customizable Excel Spreadsheet
PCAS Business Model Canvas streamlines mapping of strategy and operations into editable, shareable cells so teams rapidly align without tedious formatting. It saves hours, clarifies pain points for quick decisions, and makes comparing models or iterating on insights effortless.
Activities

Process R&D & route design
Designing robust, scalable synthetic routes for APIs and intermediates is core, using DoE, kinetics studies and impurity mapping to ensure reproducible yields. Pilot scale work typically spans 10s–1,000s kg with commercial targets at tonnes/year. Focus remains on cost control, safety, sustainability and IP defensibility, with outputs driving tech transfer to pilot and commercial plants.
GMP manufacturing
Clinical and commercial batch production under cGMP (FDA/EMA standards) ensures consistent quality and regulatory compliance for batches ranging from milligrams to multiple kilograms. Activities span weighing through packaging with fully validated SOPs; in-process controls and release testing (typically 3–10 day turnaround) are integral and consume roughly 15–25% of manufacturing time. Campaign planning routinely drives asset utilization above 85% and shortens timelines across clinical to commercial scale.

Analytical development
Method development, validation and stability studies form the CMC backbone, with stability programs commonly sampling 3–6 timepoints over 12 months per ICH Q1A and validation acceptance criteria often requiring r2 > 0.99 for linearity. Techniques span HPLC/UPLC, LC-MS/MS, NMR and ICP-MS elemental assays. Analytical life-cycle management governs method changes through product life, reducing out-of-spec events and release delays. Integrated data integrity systems ensure traceability and regulatory compliance.

Scale-up & tech transfer
- HAZOP, calorimetry, PAT mandated for scale
- 2024 pilot capex 0.5–5M; plant 5–50M
- Cross-functional teams for doc & training
- CI: cycle time -15–30%, cost -10–25%
Quality & regulatory support
Quality & regulatory support at PCAS maintains QMS, conducts audits and inspection readiness to safeguard compliance; industry context: global pharma market ~1.6 trillion USD in 2024, driving higher regulatory scrutiny. Dossiers, CoAs and CMC sections support IND/IMPD/NDA filings; change control and deviation management preserve product integrity. Client-facing QA provides transparent, SLA-driven communication.
cGMP API scale-up: CI cuts cycle 15–30%, cost 10–25%
Design, scale-up and cGMP manufacturing of APIs/intermediates (mg→tonnes) with DoE, PAT, HAZOP and stability programs; asset utilization >85% and CI reduces cycle time 15–30% and unit cost 10–25% (2024). QMS, audits, CMC dossiers and validated analytics (HPLC/LC-MS/NMR) enable regulatory filings; 2024 pharma market ≈1.6T USD.
| Metric | 2024 Value |
|---|---|
| Pilot capex | 0.5–5M USD |
| Plant capex | 5–50M USD |
| Asset utilization | >85% |
Delivered as Displayed
Business Model Canvas
The PCAS Business Model Canvas you’re previewing is the actual deliverable, not a mockup or sample; it’s a direct snapshot of the complete file you’ll receive after purchase. When you buy, you’ll instantly download this same professionally formatted document ready to edit, present, and apply in Word and Excel.

Unlock the strategic blueprint: concise Business Model Canvas for investors and strategists
Unlock the full strategic blueprint behind PCAS's business model. Our concise Business Model Canvas uncovers how PCAS creates value, scales revenue, and outmaneuvers competitors. Ideal for investors and strategists—download the complete, editable Word and Excel canvas to benchmark, adapt, and accelerate your decisions.
Partnerships
Pharma & biotech sponsors
Partnerships with originator pharma and biotech supply PCAS with project pipelines spanning discovery to commercial, with 3–7 year MSAs commonly used to stabilize volumes and revenue (2024 CDMO market ~170 billion USD). Sponsors co-define specs, timelines and tech-transfer plans to align CMC milestones and reduce scale-up risk. Multi-year agreements enable joint CMC risk management and capacity planning. Co-development deals often include shared IP or negotiated exclusivity terms.
Raw material suppliers
Qualified suppliers ensure continuity of advanced reagents, solvents, and catalysts; dual-sourcing and long-term contracts mitigate price and supply volatility and have been shown in industry studies to lower stockout risk materially. Vendor-managed inventory can reduce lead times by up to 30%, while joint quality audits align specifications and change-control to cut nonconformances and speed approvals.
Equipment & tech vendors
OEMs such as Sartorius, Cytiva, Pall and Eppendorf supply reactors, flow systems, PAT and containment that enable scalable, GMP-compliant processes; the single-use bioreactor market was about USD 3.4 billion in 2024. Service agreements ensure preventive maintenance, calibration per FDA 21 CFR Part 11 and maximize uptime. Early OEM access to new tech improves safety and yield, while co-validation shortens GMP adoption timelines.
CROs & academic labs
CROs and academic labs augment screening, analytics and route scouting, accelerating SAR/SPR cycles and process innovation; industry reports in 2024 cite collaborations cutting lead optimization timelines by up to 40% and lowering scale-up failure rates for complex chemistries. Access to niche methodologies de-risks scale-up and generates publications/case studies that boost credibility in advanced synthesis.
- Faster SAR/SPR: up to 40% reduction (2024)
- Lower scale-up failures for complex routes
- Cost-efficient access to specialized analytics
- Publications/case studies enhance reputation
Logistics & compliance partners
Specialized logistics firms handle temperature-controlled, hazardous and international shipments; the global cold chain market was estimated at $276 billion in 2024, highlighting scale and specialist demand. Regulatory consultants support filings and inspections across jurisdictions; waste partners manage compliant disposal, while insurers and certification bodies underpin risk and quality frameworks.
- cold_chain:$276B_2024
- regs:ISO13485/9001
- waste:compliant_disposal
- risk:insurance_certification
MSAs (3–7y) align CMC risk and shared cost in USD 170B CDMO
Long-term MSAs (3–7 years) with pharma/biotech supply PCAS pipelines and predictable revenue in a ~USD 170B CDMO market (2024), aligning CMC milestones and shared risk. OEMs (Sartorius, Cytiva) provide GMP equipment; single-use bioreactor market ~USD 3.4B (2024) improving scale-up and uptime. Logistics, regs and waste partners secure cold-chain ($276B 2024), compliance and insured transport.
| Partner | Role | 2024 metric |
|---|---|---|
| Sponsors | Pipeline, co-dev | MSAs 3–7y |
| OEMs | Equipment, maintenance | SUR market $3.4B |
| Logistics | Cold chain, hazardous | $276B |
What is included in the product
Detailed Word Document
A comprehensive, pre-written Business Model Canvas for PCAS that details customer segments, channels, value propositions and revenue streams across the 9 classic BMC blocks, with competitive analysis, SWOT-linked insights and investor-ready presentation design.
Customizable Excel Spreadsheet
PCAS Business Model Canvas streamlines mapping of strategy and operations into editable, shareable cells so teams rapidly align without tedious formatting. It saves hours, clarifies pain points for quick decisions, and makes comparing models or iterating on insights effortless.
Activities
Process R&D & route design
Designing robust, scalable synthetic routes for APIs and intermediates is core, using DoE, kinetics studies and impurity mapping to ensure reproducible yields. Pilot scale work typically spans 10s–1,000s kg with commercial targets at tonnes/year. Focus remains on cost control, safety, sustainability and IP defensibility, with outputs driving tech transfer to pilot and commercial plants.
GMP manufacturing
Clinical and commercial batch production under cGMP (FDA/EMA standards) ensures consistent quality and regulatory compliance for batches ranging from milligrams to multiple kilograms. Activities span weighing through packaging with fully validated SOPs; in-process controls and release testing (typically 3–10 day turnaround) are integral and consume roughly 15–25% of manufacturing time. Campaign planning routinely drives asset utilization above 85% and shortens timelines across clinical to commercial scale.
Analytical development
Method development, validation and stability studies form the CMC backbone, with stability programs commonly sampling 3–6 timepoints over 12 months per ICH Q1A and validation acceptance criteria often requiring r2 > 0.99 for linearity. Techniques span HPLC/UPLC, LC-MS/MS, NMR and ICP-MS elemental assays. Analytical life-cycle management governs method changes through product life, reducing out-of-spec events and release delays. Integrated data integrity systems ensure traceability and regulatory compliance.
Scale-up & tech transfer
- HAZOP, calorimetry, PAT mandated for scale
- 2024 pilot capex 0.5–5M; plant 5–50M
- Cross-functional teams for doc & training
- CI: cycle time -15–30%, cost -10–25%
Quality & regulatory support
Quality & regulatory support at PCAS maintains QMS, conducts audits and inspection readiness to safeguard compliance; industry context: global pharma market ~1.6 trillion USD in 2024, driving higher regulatory scrutiny. Dossiers, CoAs and CMC sections support IND/IMPD/NDA filings; change control and deviation management preserve product integrity. Client-facing QA provides transparent, SLA-driven communication.
cGMP API scale-up: CI cuts cycle 15–30%, cost 10–25%
Design, scale-up and cGMP manufacturing of APIs/intermediates (mg→tonnes) with DoE, PAT, HAZOP and stability programs; asset utilization >85% and CI reduces cycle time 15–30% and unit cost 10–25% (2024). QMS, audits, CMC dossiers and validated analytics (HPLC/LC-MS/NMR) enable regulatory filings; 2024 pharma market ≈1.6T USD.
| Metric | 2024 Value |
|---|---|
| Pilot capex | 0.5–5M USD |
| Plant capex | 5–50M USD |
| Asset utilization | >85% |
Delivered as Displayed
Business Model Canvas
The PCAS Business Model Canvas you’re previewing is the actual deliverable, not a mockup or sample; it’s a direct snapshot of the complete file you’ll receive after purchase. When you buy, you’ll instantly download this same professionally formatted document ready to edit, present, and apply in Word and Excel.
Description
Unlock the strategic blueprint: concise Business Model Canvas for investors and strategists
Unlock the full strategic blueprint behind PCAS's business model. Our concise Business Model Canvas uncovers how PCAS creates value, scales revenue, and outmaneuvers competitors. Ideal for investors and strategists—download the complete, editable Word and Excel canvas to benchmark, adapt, and accelerate your decisions.
Partnerships
Pharma & biotech sponsors
Partnerships with originator pharma and biotech supply PCAS with project pipelines spanning discovery to commercial, with 3–7 year MSAs commonly used to stabilize volumes and revenue (2024 CDMO market ~170 billion USD). Sponsors co-define specs, timelines and tech-transfer plans to align CMC milestones and reduce scale-up risk. Multi-year agreements enable joint CMC risk management and capacity planning. Co-development deals often include shared IP or negotiated exclusivity terms.
Raw material suppliers
Qualified suppliers ensure continuity of advanced reagents, solvents, and catalysts; dual-sourcing and long-term contracts mitigate price and supply volatility and have been shown in industry studies to lower stockout risk materially. Vendor-managed inventory can reduce lead times by up to 30%, while joint quality audits align specifications and change-control to cut nonconformances and speed approvals.
Equipment & tech vendors
OEMs such as Sartorius, Cytiva, Pall and Eppendorf supply reactors, flow systems, PAT and containment that enable scalable, GMP-compliant processes; the single-use bioreactor market was about USD 3.4 billion in 2024. Service agreements ensure preventive maintenance, calibration per FDA 21 CFR Part 11 and maximize uptime. Early OEM access to new tech improves safety and yield, while co-validation shortens GMP adoption timelines.
CROs & academic labs
CROs and academic labs augment screening, analytics and route scouting, accelerating SAR/SPR cycles and process innovation; industry reports in 2024 cite collaborations cutting lead optimization timelines by up to 40% and lowering scale-up failure rates for complex chemistries. Access to niche methodologies de-risks scale-up and generates publications/case studies that boost credibility in advanced synthesis.
- Faster SAR/SPR: up to 40% reduction (2024)
- Lower scale-up failures for complex routes
- Cost-efficient access to specialized analytics
- Publications/case studies enhance reputation
Logistics & compliance partners
Specialized logistics firms handle temperature-controlled, hazardous and international shipments; the global cold chain market was estimated at $276 billion in 2024, highlighting scale and specialist demand. Regulatory consultants support filings and inspections across jurisdictions; waste partners manage compliant disposal, while insurers and certification bodies underpin risk and quality frameworks.
- cold_chain:$276B_2024
- regs:ISO13485/9001
- waste:compliant_disposal
- risk:insurance_certification
MSAs (3–7y) align CMC risk and shared cost in USD 170B CDMO
Long-term MSAs (3–7 years) with pharma/biotech supply PCAS pipelines and predictable revenue in a ~USD 170B CDMO market (2024), aligning CMC milestones and shared risk. OEMs (Sartorius, Cytiva) provide GMP equipment; single-use bioreactor market ~USD 3.4B (2024) improving scale-up and uptime. Logistics, regs and waste partners secure cold-chain ($276B 2024), compliance and insured transport.
| Partner | Role | 2024 metric |
|---|---|---|
| Sponsors | Pipeline, co-dev | MSAs 3–7y |
| OEMs | Equipment, maintenance | SUR market $3.4B |
| Logistics | Cold chain, hazardous | $276B |
What is included in the product
Detailed Word Document
A comprehensive, pre-written Business Model Canvas for PCAS that details customer segments, channels, value propositions and revenue streams across the 9 classic BMC blocks, with competitive analysis, SWOT-linked insights and investor-ready presentation design.
Customizable Excel Spreadsheet
PCAS Business Model Canvas streamlines mapping of strategy and operations into editable, shareable cells so teams rapidly align without tedious formatting. It saves hours, clarifies pain points for quick decisions, and makes comparing models or iterating on insights effortless.
Activities
Process R&D & route design
Designing robust, scalable synthetic routes for APIs and intermediates is core, using DoE, kinetics studies and impurity mapping to ensure reproducible yields. Pilot scale work typically spans 10s–1,000s kg with commercial targets at tonnes/year. Focus remains on cost control, safety, sustainability and IP defensibility, with outputs driving tech transfer to pilot and commercial plants.
GMP manufacturing
Clinical and commercial batch production under cGMP (FDA/EMA standards) ensures consistent quality and regulatory compliance for batches ranging from milligrams to multiple kilograms. Activities span weighing through packaging with fully validated SOPs; in-process controls and release testing (typically 3–10 day turnaround) are integral and consume roughly 15–25% of manufacturing time. Campaign planning routinely drives asset utilization above 85% and shortens timelines across clinical to commercial scale.
Analytical development
Method development, validation and stability studies form the CMC backbone, with stability programs commonly sampling 3–6 timepoints over 12 months per ICH Q1A and validation acceptance criteria often requiring r2 > 0.99 for linearity. Techniques span HPLC/UPLC, LC-MS/MS, NMR and ICP-MS elemental assays. Analytical life-cycle management governs method changes through product life, reducing out-of-spec events and release delays. Integrated data integrity systems ensure traceability and regulatory compliance.
Scale-up & tech transfer
- HAZOP, calorimetry, PAT mandated for scale
- 2024 pilot capex 0.5–5M; plant 5–50M
- Cross-functional teams for doc & training
- CI: cycle time -15–30%, cost -10–25%
Quality & regulatory support
Quality & regulatory support at PCAS maintains QMS, conducts audits and inspection readiness to safeguard compliance; industry context: global pharma market ~1.6 trillion USD in 2024, driving higher regulatory scrutiny. Dossiers, CoAs and CMC sections support IND/IMPD/NDA filings; change control and deviation management preserve product integrity. Client-facing QA provides transparent, SLA-driven communication.
cGMP API scale-up: CI cuts cycle 15–30%, cost 10–25%
Design, scale-up and cGMP manufacturing of APIs/intermediates (mg→tonnes) with DoE, PAT, HAZOP and stability programs; asset utilization >85% and CI reduces cycle time 15–30% and unit cost 10–25% (2024). QMS, audits, CMC dossiers and validated analytics (HPLC/LC-MS/NMR) enable regulatory filings; 2024 pharma market ≈1.6T USD.
| Metric | 2024 Value |
|---|---|
| Pilot capex | 0.5–5M USD |
| Plant capex | 5–50M USD |
| Asset utilization | >85% |
Delivered as Displayed
Business Model Canvas
The PCAS Business Model Canvas you’re previewing is the actual deliverable, not a mockup or sample; it’s a direct snapshot of the complete file you’ll receive after purchase. When you buy, you’ll instantly download this same professionally formatted document ready to edit, present, and apply in Word and Excel.











