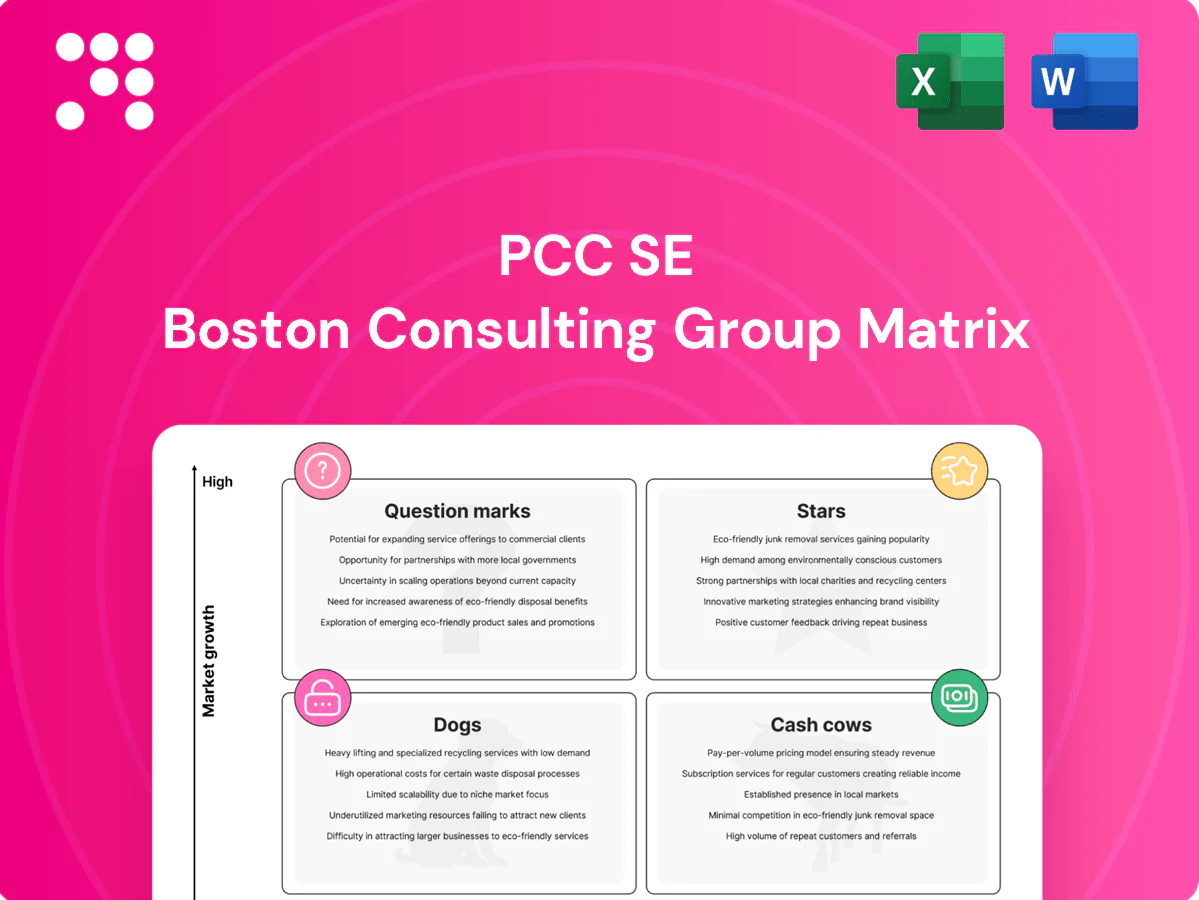
PCC SE Boston Consulting Group Matrix

Visual. Strategic. Downloadable.
PCC SE’s BCG Matrix preview shows early signals—who’s leading, who’s bleeding cash, and where questions linger—now imagine the full picture. Buy the complete BCG Matrix for quadrant-by-quadrant placements, clear strategic moves, and an editable Word + Excel pack you can use in minutes. Skip the guesswork; get the data-driven plan that tells you where to invest, divest, or double down.
Stars

Renewable power projects
PCC’s wind, hydro and solar builds benefit from strong 2024 policy tailwinds and rising industrial PPAs, locking multi-decade (10–20 year) offtakes that underpin long-term revenue visibility. They soak up capex today but, with continued investment, convert into predictable cash engines over 10–15 years. Execution and grid access remain the immediate choke points to secure timely commissioning and contractual revenue.
Silicon metal for solar & electronics
High-purity silicon for solar and electronics tracks 2024's sustained record solar buildout and broader electrification, keeping demand well ahead of legacy capacity additions. Scale, lower energy cost per tonne and advanced customer qualification position PCC SE to claim leadership. Prioritize tight supply contracts and continuous purity upgrades to defend and extend that wedge.

Specialty polyols for insulation & mobility
PU insulation, EV seating and lightweighting keep specialty polyols in a clear growth lane as OEM electrification lifted global EV share to about 14% of new-car sales in 2024, sustaining demand for higher-performance polymers. Higher-spec polyols attract stickier customers and typically command margins 3–6 percentage points above commodity blends. Marketing and application technical support remain decisive to win and retain specs; hold share now and you bank tomorrow’s cow.

Integrated chlor-alkali in growth geographies
Integrated chlor-alkali in growth geographies behaves like a star where 2024 Asia-Pacific PVC and water-treatment demand rose over 3% YoY and alumina-led aluminium output expanded, giving strong off-take for caustic soda and chlorine; downstream linkage plus captive energy and logistics make such units hard to dislodge. Capex is heavy, but utilization-driven margins ramp quickly once plants hit >85% utilization; keep debottlenecking and secure long-term offtake agreements.
- Market tailwinds: Asia-Pacific PVC/water-treatment demand +3%+ YoY in 2024
- Structural moat: captive energy + downstream integration
- Operational focus: target >85% utilization, continuous debottlenecking
- Commercial: lock multi-year buyers to stabilize cashflows
Battery-adjacent silicon derivatives
Battery-adjacent silicon derivatives are Stars: demand for silicon inputs for anodes and advanced chemistries surged with the battery boom, with industry reports citing silicon use in next-gen anodes reaching roughly 5% of new cell capacity in 2024 and expected CAGR >30% into the late 2020s; volumes remain small but specs are tight and supplier price power is real, and technical wins secure multi-year ramps.
- High growth: silicon anode adoption ~5% of new cell capacity in 2024
- Price power: tight specs driving premium pricing and long-term contracts
- Volume risk: current volumes small but multi-year ramps from technical wins
- Strategic stance: lean in while category standards are set
Renewables to battery silicon: capex now, predictable cash at >85% utilization
PCC SE Stars (wind/solar/hydro, high-purity silicon, specialty polyols, chlor-alkali, battery silicon) enjoy 2024 tailwinds: multi-decade PPAs (10–20y), Asia-Pacific PVC/water +3% YoY, EV share ~14% and silicon-anode ~5% of new cell capacity; capex-heavy now, convert to predictable cash with >85% utilization and long-term offtakes.
| Segment | 2024 metric | Margin uplift | Priority |
|---|---|---|---|
| Wind/Hydro/Solar | PPAs 10–20y | +— | Secure grid access |
| High‑purity silicon | Solar buildout strong | +3–6ppt | Scale & purity |
| Polyols | EV share 14% | +3–6ppt | Technical support |
| Chlor‑alkali | APAC PVC +3% YoY | High once >85% util | Debottleneck & offtakes |
| Battery silicon | Anode ~5% new cell cap | Premium pricing | Lean in |
What is included in the product
 Detailed Word Document
Concise BCG Matrix of PCC SE: evaluates each unit as Star, Cash Cow, Question Mark or Dog with investment and divestment guidance.

 Customizable Excel Spreadsheet
One-page PCC SE BCG Matrix that maps business units into quadrants, export-ready for C-level decks and printable A4/PDF.
Cash Cows

Core chlor-alkali (mature EU markets)
Core chlor-alkali in mature EU markets remains a cash cow: steady PVC chains and municipal water treatment demand—about 4 million tonnes PVC consumption in the EU (2023)—keep plants near 88% utilization. Process know-how and logistics protect share; disciplined capex and uptime plus energy hedging sustain margins. Milk cash, invest in efficiency gains, avoid vanity expansions.
Standard polyols for established applications
Commodity and semi-specialty polyols for established applications deliver steady, high-visibility EBITDA thanks to entrenched customers and recurring orders.

Industrial logistics services
Rail, tank and bulk handling for captive and third-party flows generate steady cash, with logistics EBITDA margins around 10% in 2024. Utilization and route density are primary levers—raising fill rates by 5-10% can lift unit margins materially. Tech-lite optimization (route planning, telematics) boosts margins without heavy capex. Maintain high service levels and charge a premium for reliability to protect cash generation.

Established silicon for aluminum alloys
Established silicon for aluminum alloys
Auto and construction keep demand predictable; PCC’s long-standing OEM and foundry qualifications and consistent quality make customers sticky. Not a rocket ship, but a dependable cash cow delivering steady margins in 2024. Maintain cost position and harvest free cash flow.- Demand: auto + construction = core base
- Stickiness: qualified OEM/foundry supply
- Strategy: cost leadership, harvest cash
Power offtakes from legacy PPAs
Power offtakes from legacy PPAs provide predictable, low-effort cashflows—long-term tenors (often 10+ years) sustain high visibility and limited growth, so maintenance over expansion is the operating focus. In 2024 these contracts continue to underpin free cash, which PCC SE can recycle to fund the next investment wave rather than chase volume growth.
- Cash profile: stable, contract-backed receipts
- Growth: limited, low upside
- Effort: maintenance-focused
- Use of proceeds: fund next-wave investments
Harvest cash: chlor-alkali 88% util; logistics EBITDA 10%; capex selective
Core chlor-alkali (EU PVC ~4.0 Mt 2023) at ~88% utilization, polyols and established silicon deliver steady EBITDA; logistics EBITDA ~10% (2024) and PPAs (10+ yr) provide predictable cash. Focus: harvest cash, selective efficiency capex, avoid volume-driven expansions.
| Segment | 2023-24 Metric | Margin | Strategy |
|---|---|---|---|
| Chlor-alkali | EU PVC 4.0 Mt; util ~88% | High | Harvest/efficiency |
| Polyols/Silicon | Entrenched demand | Stable | Maintain |
| Logistics/PPAs | EBITDA ~10%; PPAs 10+ yr | Predictable | Maintain |
What You’re Viewing Is Included
PCC SE BCG Matrix
The file you're previewing is the exact PCC SE BCG Matrix report you'll get after purchase. No watermarks, no demo text—just the fully formatted, analysis-ready document crafted for strategic clarity. It arrives instantly to your inbox and is ready to edit, print, or present to stakeholders. No surprises, no revisions needed.

Visual. Strategic. Downloadable.
PCC SE’s BCG Matrix preview shows early signals—who’s leading, who’s bleeding cash, and where questions linger—now imagine the full picture. Buy the complete BCG Matrix for quadrant-by-quadrant placements, clear strategic moves, and an editable Word + Excel pack you can use in minutes. Skip the guesswork; get the data-driven plan that tells you where to invest, divest, or double down.
Stars
Renewable power projects
PCC’s wind, hydro and solar builds benefit from strong 2024 policy tailwinds and rising industrial PPAs, locking multi-decade (10–20 year) offtakes that underpin long-term revenue visibility. They soak up capex today but, with continued investment, convert into predictable cash engines over 10–15 years. Execution and grid access remain the immediate choke points to secure timely commissioning and contractual revenue.
Silicon metal for solar & electronics
High-purity silicon for solar and electronics tracks 2024's sustained record solar buildout and broader electrification, keeping demand well ahead of legacy capacity additions. Scale, lower energy cost per tonne and advanced customer qualification position PCC SE to claim leadership. Prioritize tight supply contracts and continuous purity upgrades to defend and extend that wedge.
Specialty polyols for insulation & mobility
PU insulation, EV seating and lightweighting keep specialty polyols in a clear growth lane as OEM electrification lifted global EV share to about 14% of new-car sales in 2024, sustaining demand for higher-performance polymers. Higher-spec polyols attract stickier customers and typically command margins 3–6 percentage points above commodity blends. Marketing and application technical support remain decisive to win and retain specs; hold share now and you bank tomorrow’s cow.
Integrated chlor-alkali in growth geographies
Integrated chlor-alkali in growth geographies behaves like a star where 2024 Asia-Pacific PVC and water-treatment demand rose over 3% YoY and alumina-led aluminium output expanded, giving strong off-take for caustic soda and chlorine; downstream linkage plus captive energy and logistics make such units hard to dislodge. Capex is heavy, but utilization-driven margins ramp quickly once plants hit >85% utilization; keep debottlenecking and secure long-term offtake agreements.
- Market tailwinds: Asia-Pacific PVC/water-treatment demand +3%+ YoY in 2024
- Structural moat: captive energy + downstream integration
- Operational focus: target >85% utilization, continuous debottlenecking
- Commercial: lock multi-year buyers to stabilize cashflows
Battery-adjacent silicon derivatives
Battery-adjacent silicon derivatives are Stars: demand for silicon inputs for anodes and advanced chemistries surged with the battery boom, with industry reports citing silicon use in next-gen anodes reaching roughly 5% of new cell capacity in 2024 and expected CAGR >30% into the late 2020s; volumes remain small but specs are tight and supplier price power is real, and technical wins secure multi-year ramps.
- High growth: silicon anode adoption ~5% of new cell capacity in 2024
- Price power: tight specs driving premium pricing and long-term contracts
- Volume risk: current volumes small but multi-year ramps from technical wins
- Strategic stance: lean in while category standards are set
Renewables to battery silicon: capex now, predictable cash at >85% utilization
PCC SE Stars (wind/solar/hydro, high-purity silicon, specialty polyols, chlor-alkali, battery silicon) enjoy 2024 tailwinds: multi-decade PPAs (10–20y), Asia-Pacific PVC/water +3% YoY, EV share ~14% and silicon-anode ~5% of new cell capacity; capex-heavy now, convert to predictable cash with >85% utilization and long-term offtakes.
| Segment | 2024 metric | Margin uplift | Priority |
|---|---|---|---|
| Wind/Hydro/Solar | PPAs 10–20y | +— | Secure grid access |
| High‑purity silicon | Solar buildout strong | +3–6ppt | Scale & purity |
| Polyols | EV share 14% | +3–6ppt | Technical support |
| Chlor‑alkali | APAC PVC +3% YoY | High once >85% util | Debottleneck & offtakes |
| Battery silicon | Anode ~5% new cell cap | Premium pricing | Lean in |
What is included in the product
Detailed Word Document
Concise BCG Matrix of PCC SE: evaluates each unit as Star, Cash Cow, Question Mark or Dog with investment and divestment guidance.
Customizable Excel Spreadsheet
One-page PCC SE BCG Matrix that maps business units into quadrants, export-ready for C-level decks and printable A4/PDF.
Cash Cows
Core chlor-alkali (mature EU markets)
Core chlor-alkali in mature EU markets remains a cash cow: steady PVC chains and municipal water treatment demand—about 4 million tonnes PVC consumption in the EU (2023)—keep plants near 88% utilization. Process know-how and logistics protect share; disciplined capex and uptime plus energy hedging sustain margins. Milk cash, invest in efficiency gains, avoid vanity expansions.
Standard polyols for established applications
Commodity and semi-specialty polyols for established applications deliver steady, high-visibility EBITDA thanks to entrenched customers and recurring orders.
Industrial logistics services
Rail, tank and bulk handling for captive and third-party flows generate steady cash, with logistics EBITDA margins around 10% in 2024. Utilization and route density are primary levers—raising fill rates by 5-10% can lift unit margins materially. Tech-lite optimization (route planning, telematics) boosts margins without heavy capex. Maintain high service levels and charge a premium for reliability to protect cash generation.
Established silicon for aluminum alloys
Established silicon for aluminum alloys
Auto and construction keep demand predictable; PCC’s long-standing OEM and foundry qualifications and consistent quality make customers sticky. Not a rocket ship, but a dependable cash cow delivering steady margins in 2024. Maintain cost position and harvest free cash flow.- Demand: auto + construction = core base
- Stickiness: qualified OEM/foundry supply
- Strategy: cost leadership, harvest cash
Power offtakes from legacy PPAs
Power offtakes from legacy PPAs provide predictable, low-effort cashflows—long-term tenors (often 10+ years) sustain high visibility and limited growth, so maintenance over expansion is the operating focus. In 2024 these contracts continue to underpin free cash, which PCC SE can recycle to fund the next investment wave rather than chase volume growth.
- Cash profile: stable, contract-backed receipts
- Growth: limited, low upside
- Effort: maintenance-focused
- Use of proceeds: fund next-wave investments
Harvest cash: chlor-alkali 88% util; logistics EBITDA 10%; capex selective
Core chlor-alkali (EU PVC ~4.0 Mt 2023) at ~88% utilization, polyols and established silicon deliver steady EBITDA; logistics EBITDA ~10% (2024) and PPAs (10+ yr) provide predictable cash. Focus: harvest cash, selective efficiency capex, avoid volume-driven expansions.
| Segment | 2023-24 Metric | Margin | Strategy |
|---|---|---|---|
| Chlor-alkali | EU PVC 4.0 Mt; util ~88% | High | Harvest/efficiency |
| Polyols/Silicon | Entrenched demand | Stable | Maintain |
| Logistics/PPAs | EBITDA ~10%; PPAs 10+ yr | Predictable | Maintain |
What You’re Viewing Is Included
PCC SE BCG Matrix
The file you're previewing is the exact PCC SE BCG Matrix report you'll get after purchase. No watermarks, no demo text—just the fully formatted, analysis-ready document crafted for strategic clarity. It arrives instantly to your inbox and is ready to edit, print, or present to stakeholders. No surprises, no revisions needed.
Description
Visual. Strategic. Downloadable.
PCC SE’s BCG Matrix preview shows early signals—who’s leading, who’s bleeding cash, and where questions linger—now imagine the full picture. Buy the complete BCG Matrix for quadrant-by-quadrant placements, clear strategic moves, and an editable Word + Excel pack you can use in minutes. Skip the guesswork; get the data-driven plan that tells you where to invest, divest, or double down.
Stars
Renewable power projects
PCC’s wind, hydro and solar builds benefit from strong 2024 policy tailwinds and rising industrial PPAs, locking multi-decade (10–20 year) offtakes that underpin long-term revenue visibility. They soak up capex today but, with continued investment, convert into predictable cash engines over 10–15 years. Execution and grid access remain the immediate choke points to secure timely commissioning and contractual revenue.
Silicon metal for solar & electronics
High-purity silicon for solar and electronics tracks 2024's sustained record solar buildout and broader electrification, keeping demand well ahead of legacy capacity additions. Scale, lower energy cost per tonne and advanced customer qualification position PCC SE to claim leadership. Prioritize tight supply contracts and continuous purity upgrades to defend and extend that wedge.
Specialty polyols for insulation & mobility
PU insulation, EV seating and lightweighting keep specialty polyols in a clear growth lane as OEM electrification lifted global EV share to about 14% of new-car sales in 2024, sustaining demand for higher-performance polymers. Higher-spec polyols attract stickier customers and typically command margins 3–6 percentage points above commodity blends. Marketing and application technical support remain decisive to win and retain specs; hold share now and you bank tomorrow’s cow.
Integrated chlor-alkali in growth geographies
Integrated chlor-alkali in growth geographies behaves like a star where 2024 Asia-Pacific PVC and water-treatment demand rose over 3% YoY and alumina-led aluminium output expanded, giving strong off-take for caustic soda and chlorine; downstream linkage plus captive energy and logistics make such units hard to dislodge. Capex is heavy, but utilization-driven margins ramp quickly once plants hit >85% utilization; keep debottlenecking and secure long-term offtake agreements.
- Market tailwinds: Asia-Pacific PVC/water-treatment demand +3%+ YoY in 2024
- Structural moat: captive energy + downstream integration
- Operational focus: target >85% utilization, continuous debottlenecking
- Commercial: lock multi-year buyers to stabilize cashflows
Battery-adjacent silicon derivatives
Battery-adjacent silicon derivatives are Stars: demand for silicon inputs for anodes and advanced chemistries surged with the battery boom, with industry reports citing silicon use in next-gen anodes reaching roughly 5% of new cell capacity in 2024 and expected CAGR >30% into the late 2020s; volumes remain small but specs are tight and supplier price power is real, and technical wins secure multi-year ramps.
- High growth: silicon anode adoption ~5% of new cell capacity in 2024
- Price power: tight specs driving premium pricing and long-term contracts
- Volume risk: current volumes small but multi-year ramps from technical wins
- Strategic stance: lean in while category standards are set
Renewables to battery silicon: capex now, predictable cash at >85% utilization
PCC SE Stars (wind/solar/hydro, high-purity silicon, specialty polyols, chlor-alkali, battery silicon) enjoy 2024 tailwinds: multi-decade PPAs (10–20y), Asia-Pacific PVC/water +3% YoY, EV share ~14% and silicon-anode ~5% of new cell capacity; capex-heavy now, convert to predictable cash with >85% utilization and long-term offtakes.
| Segment | 2024 metric | Margin uplift | Priority |
|---|---|---|---|
| Wind/Hydro/Solar | PPAs 10–20y | +— | Secure grid access |
| High‑purity silicon | Solar buildout strong | +3–6ppt | Scale & purity |
| Polyols | EV share 14% | +3–6ppt | Technical support |
| Chlor‑alkali | APAC PVC +3% YoY | High once >85% util | Debottleneck & offtakes |
| Battery silicon | Anode ~5% new cell cap | Premium pricing | Lean in |
What is included in the product
Detailed Word Document
Concise BCG Matrix of PCC SE: evaluates each unit as Star, Cash Cow, Question Mark or Dog with investment and divestment guidance.
Customizable Excel Spreadsheet
One-page PCC SE BCG Matrix that maps business units into quadrants, export-ready for C-level decks and printable A4/PDF.
Cash Cows
Core chlor-alkali (mature EU markets)
Core chlor-alkali in mature EU markets remains a cash cow: steady PVC chains and municipal water treatment demand—about 4 million tonnes PVC consumption in the EU (2023)—keep plants near 88% utilization. Process know-how and logistics protect share; disciplined capex and uptime plus energy hedging sustain margins. Milk cash, invest in efficiency gains, avoid vanity expansions.
Standard polyols for established applications
Commodity and semi-specialty polyols for established applications deliver steady, high-visibility EBITDA thanks to entrenched customers and recurring orders.
Industrial logistics services
Rail, tank and bulk handling for captive and third-party flows generate steady cash, with logistics EBITDA margins around 10% in 2024. Utilization and route density are primary levers—raising fill rates by 5-10% can lift unit margins materially. Tech-lite optimization (route planning, telematics) boosts margins without heavy capex. Maintain high service levels and charge a premium for reliability to protect cash generation.
Established silicon for aluminum alloys
Established silicon for aluminum alloys
Auto and construction keep demand predictable; PCC’s long-standing OEM and foundry qualifications and consistent quality make customers sticky. Not a rocket ship, but a dependable cash cow delivering steady margins in 2024. Maintain cost position and harvest free cash flow.- Demand: auto + construction = core base
- Stickiness: qualified OEM/foundry supply
- Strategy: cost leadership, harvest cash
Power offtakes from legacy PPAs
Power offtakes from legacy PPAs provide predictable, low-effort cashflows—long-term tenors (often 10+ years) sustain high visibility and limited growth, so maintenance over expansion is the operating focus. In 2024 these contracts continue to underpin free cash, which PCC SE can recycle to fund the next investment wave rather than chase volume growth.
- Cash profile: stable, contract-backed receipts
- Growth: limited, low upside
- Effort: maintenance-focused
- Use of proceeds: fund next-wave investments
Harvest cash: chlor-alkali 88% util; logistics EBITDA 10%; capex selective
Core chlor-alkali (EU PVC ~4.0 Mt 2023) at ~88% utilization, polyols and established silicon deliver steady EBITDA; logistics EBITDA ~10% (2024) and PPAs (10+ yr) provide predictable cash. Focus: harvest cash, selective efficiency capex, avoid volume-driven expansions.
| Segment | 2023-24 Metric | Margin | Strategy |
|---|---|---|---|
| Chlor-alkali | EU PVC 4.0 Mt; util ~88% | High | Harvest/efficiency |
| Polyols/Silicon | Entrenched demand | Stable | Maintain |
| Logistics/PPAs | EBITDA ~10%; PPAs 10+ yr | Predictable | Maintain |
What You’re Viewing Is Included
PCC SE BCG Matrix
The file you're previewing is the exact PCC SE BCG Matrix report you'll get after purchase. No watermarks, no demo text—just the fully formatted, analysis-ready document crafted for strategic clarity. It arrives instantly to your inbox and is ready to edit, print, or present to stakeholders. No surprises, no revisions needed.











