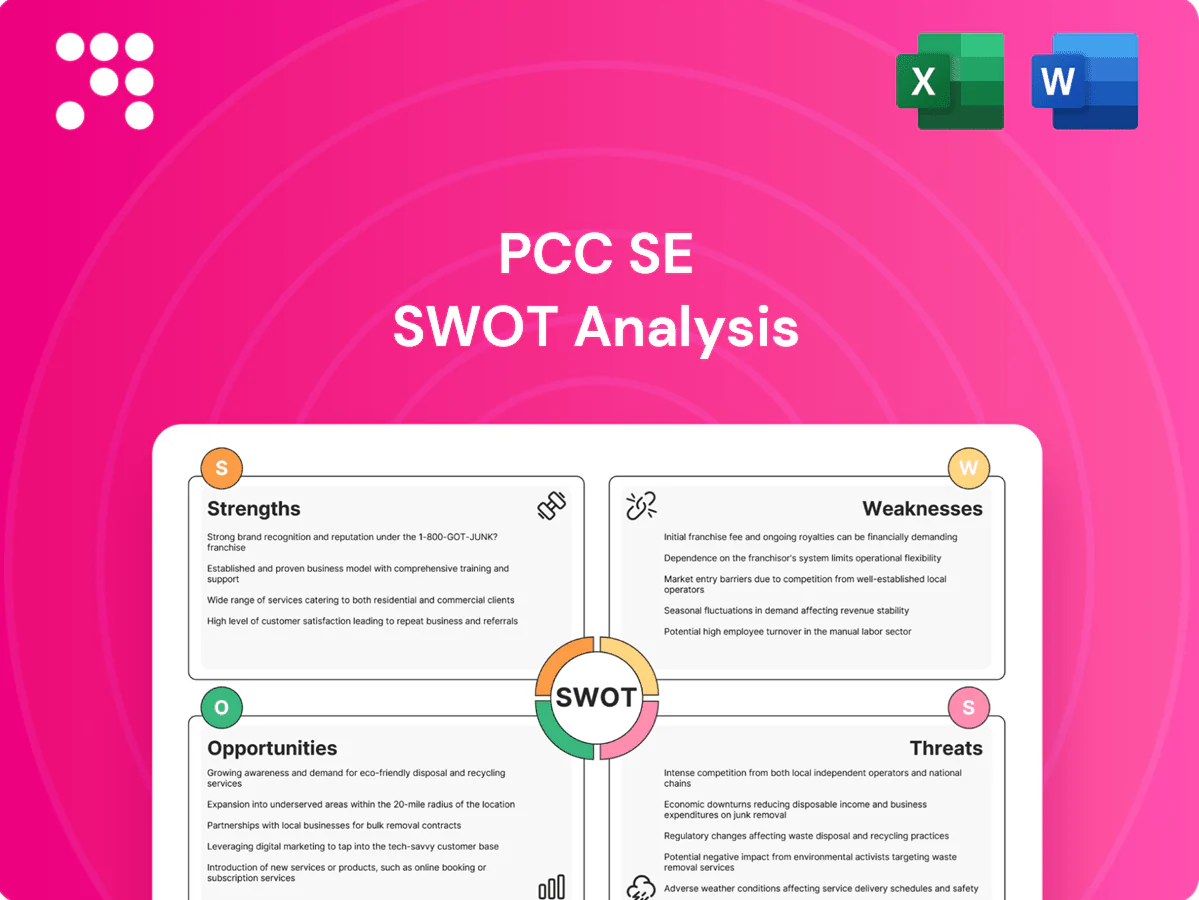
PCC SE SWOT Analysis

Dive Deeper Into the Company’s Strategic Blueprint
PCC SE’s diversified chemicals and logistics platform shows clear operational strengths but faces market cyclicality and regulatory pressures; our full SWOT unpacks competitive advantages, key risks, and growth levers with actionable recommendations. Purchase the complete, editable report to plan, pitch, or invest with confidence.
Strengths

Diversified industrial portfolio
Operating across three core sectors — chemicals, energy and logistics — reduces cyclicality and revenue volatility for PCC SE. With over 30 years of group experience (founded 1993) segment diversification creates multiple earnings levers and cross-hedges commodity exposures. It enables capital reallocation to higher-return niches over the cycle. This breadth supports resilience and long-term value creation.
Deep chemicals manufacturing footprint
Scale and know-how in chlor-alkali, polyols and silicon metal give PCC SE structural cost advantages and raise technical barriers to entry through optimized electrolysis and synthesis routes. Vertical integration and process expertise drive higher yields and consistent product quality across sites. Longstanding industrial customer relationships secure recurring demand and anchor stable cash flows for the group.

Integrated value chain synergies
Ownership of logistics gives PCC SE tighter supply reliability, enabling service levels that industry studies show can reduce stockouts by up to 30% and logistics costs by roughly 12–15% versus non-integrated peers. Coordinating production, storage and distribution lowers working capital needs—vertical players typically cut WC by ~10%—and smooths bottlenecks across chemical outputs. Internal logistics data also sharpens pricing and contract terms, strengthening competitive positioning versus standalone competitors.

Energy capabilities including renewables
Participation in energy generation gives PCC SE a partial hedge against industrial power price volatility by enabling self-generation and long-term PPAs that typically lock prices for 10–15 years; aligning with Germany’s 80% electricity-from-renewables target for 2030 strengthens market positioning.
- Hedge vs spot price swings
- Scope 2 reductions via on-site renewables
- Supply security from self-gen and PPAs
- Supports operational decarbonization
Long-term, active investment approach
PCC SEs long-term, active investment approach as a holding company enables disciplined capital allocation into high-ROI projects across chemicals, energy and logistics, while active ownership drives operational improvements and portfolio pruning. A long-duration orientation matches industrial asset life cycles and supports compounding of value via reinvestment and strategic exits.
- holding-company model
- active ownership
- long-duration alignment
- value compounding
Chemicals, energy & logistics platform: scale-driven cost edge, lower stockouts and WC
Diversified across chemicals, energy and logistics (founded 1993; 30+ years) reducing cyclicality and enabling capital rotation to higher-return niches. Technical scale in chlor-alkali, polyols and silicon metal drives cost advantages and recurring customer demand. Vertical logistics cuts stockouts by up to 30% and logistics costs ~12–15%; verticality typically lowers WC ~10%. Self-generation/PPAs (10–15y) hedge power volatility.
| Metric | Fact |
|---|---|
| Founded | 1993 |
| Logistics impact | Stockouts -30% / Costs -12–15% |
| Working capital | -~10% vs peers |
| PPAs | 10–15 years |
What is included in the product
 Detailed Word Document
Provides a concise SWOT analysis of PCC SE, outlining its core strengths and internal weaknesses while identifying external opportunities and market threats that shape its strategic position and growth prospects.

 Customizable Excel Spreadsheet
Provides a concise, visual SWOT matrix for PCC SE to align strategy quickly and relieve analysis bottlenecks. Editable format enables fast updates for presentations and stakeholder reviews.
Weaknesses

Exposure to commodity price swings
PCC SE's chlor-alkali, silicon metal and energy businesses are tied to cyclical commodity markets, exposing revenues to volatile price swings. Margin compression can occur when feedstock or energy costs rise faster than selling prices; hedging programs only partially mitigate volatility. Earnings are often lumpy, making short-term forecasting challenging.
Capital intensity and maintenance burden
Chemical plants and energy assets within PCC SE demand heavy upfront capex and continuous maintenance, driving high fixed costs that amplify operating leverage in downturns. Scheduled turnarounds and mandatory regulatory upgrades regularly interrupt production and raise short-term cash needs. These capital and timing stresses constrain the group's financial flexibility during weak market cycles.

Regulatory and environmental liabilities
Chemicals and energy operations expose PCC SE to stringent safety, REACH and Industrial Emissions Directive obligations; EU carbon pricing around €90/t in 2024–25 raises operating costs and can delay projects through permitting. Compliance spending and remediation liabilities create direct cash outflows and potential fines, while environmental incidents would damage reputation and EBITDA. Rising ESG expectations—global sustainable debt >€1.5tn by 2024—may force additional capex.

Complexity of multi-subsidiary oversight
Complexity of multi-subsidiary oversight: PCC SEs broad portfolio raises coordination demands and information asymmetry, making consistent KPIs, risk controls and culture across units difficult to enforce. Management bandwidth can be stretched when multiple initiatives run concurrently, increasing operational risk. This layer of complexity may also mask underperformance in individual pockets until issues amplify.
- Coordination demands
- Information asymmetry
- Inconsistent KPIs/controls
- Stretched management bandwidth
- Hidden underperformance
Customer concentration in industrial end-markets
Customer concentration in construction, automotive and electronics ties PCC SE revenues to cyclical end-markets, so demand shocks rapidly depress volumes and force margin pressure; weak markets can lead to unfavorable contract repricing and shorter order horizons; even a broad customer base may leave sectoral concentration risk intact.
- End-market clustering
- Rapid transmission to volumes/pricing
- Repricing risk in downturns
- Sectoral concentration persists
Commodity cycles, heavy capex and EU carbon €90/t compress margins
PCC SE is exposed to cyclical commodity swings, high fixed capex and regulatory costs that compress margins and make earnings lumpy; EU carbon pricing (~€90/t in 2024–25) and rising ESG expectations (global sustainable debt >€1.5tn by 2024) heighten cash demands while multi-subsidiary complexity and end-market concentration increase operational and demand risks.
| Metric | Value |
|---|---|
| EU carbon price (2024–25) | ~€90/t |
What You See Is What You Get
PCC SE SWOT Analysis
This is the actual PCC SE SWOT analysis document you’re previewing—no sample, no surprises, just professional quality. The excerpt below is pulled directly from the full report you'll receive after purchase. Buy now to unlock the complete, editable SWOT file with full detail and structured insights ready for use.

Dive Deeper Into the Company’s Strategic Blueprint
PCC SE’s diversified chemicals and logistics platform shows clear operational strengths but faces market cyclicality and regulatory pressures; our full SWOT unpacks competitive advantages, key risks, and growth levers with actionable recommendations. Purchase the complete, editable report to plan, pitch, or invest with confidence.
Strengths
Diversified industrial portfolio
Operating across three core sectors — chemicals, energy and logistics — reduces cyclicality and revenue volatility for PCC SE. With over 30 years of group experience (founded 1993) segment diversification creates multiple earnings levers and cross-hedges commodity exposures. It enables capital reallocation to higher-return niches over the cycle. This breadth supports resilience and long-term value creation.
Deep chemicals manufacturing footprint
Scale and know-how in chlor-alkali, polyols and silicon metal give PCC SE structural cost advantages and raise technical barriers to entry through optimized electrolysis and synthesis routes. Vertical integration and process expertise drive higher yields and consistent product quality across sites. Longstanding industrial customer relationships secure recurring demand and anchor stable cash flows for the group.
Integrated value chain synergies
Ownership of logistics gives PCC SE tighter supply reliability, enabling service levels that industry studies show can reduce stockouts by up to 30% and logistics costs by roughly 12–15% versus non-integrated peers. Coordinating production, storage and distribution lowers working capital needs—vertical players typically cut WC by ~10%—and smooths bottlenecks across chemical outputs. Internal logistics data also sharpens pricing and contract terms, strengthening competitive positioning versus standalone competitors.
Energy capabilities including renewables
Participation in energy generation gives PCC SE a partial hedge against industrial power price volatility by enabling self-generation and long-term PPAs that typically lock prices for 10–15 years; aligning with Germany’s 80% electricity-from-renewables target for 2030 strengthens market positioning.
- Hedge vs spot price swings
- Scope 2 reductions via on-site renewables
- Supply security from self-gen and PPAs
- Supports operational decarbonization
Long-term, active investment approach
PCC SEs long-term, active investment approach as a holding company enables disciplined capital allocation into high-ROI projects across chemicals, energy and logistics, while active ownership drives operational improvements and portfolio pruning. A long-duration orientation matches industrial asset life cycles and supports compounding of value via reinvestment and strategic exits.
- holding-company model
- active ownership
- long-duration alignment
- value compounding
Chemicals, energy & logistics platform: scale-driven cost edge, lower stockouts and WC
Diversified across chemicals, energy and logistics (founded 1993; 30+ years) reducing cyclicality and enabling capital rotation to higher-return niches. Technical scale in chlor-alkali, polyols and silicon metal drives cost advantages and recurring customer demand. Vertical logistics cuts stockouts by up to 30% and logistics costs ~12–15%; verticality typically lowers WC ~10%. Self-generation/PPAs (10–15y) hedge power volatility.
| Metric | Fact |
|---|---|
| Founded | 1993 |
| Logistics impact | Stockouts -30% / Costs -12–15% |
| Working capital | -~10% vs peers |
| PPAs | 10–15 years |
What is included in the product
Detailed Word Document
Provides a concise SWOT analysis of PCC SE, outlining its core strengths and internal weaknesses while identifying external opportunities and market threats that shape its strategic position and growth prospects.
Customizable Excel Spreadsheet
Provides a concise, visual SWOT matrix for PCC SE to align strategy quickly and relieve analysis bottlenecks. Editable format enables fast updates for presentations and stakeholder reviews.
Weaknesses
Exposure to commodity price swings
PCC SE's chlor-alkali, silicon metal and energy businesses are tied to cyclical commodity markets, exposing revenues to volatile price swings. Margin compression can occur when feedstock or energy costs rise faster than selling prices; hedging programs only partially mitigate volatility. Earnings are often lumpy, making short-term forecasting challenging.
Capital intensity and maintenance burden
Chemical plants and energy assets within PCC SE demand heavy upfront capex and continuous maintenance, driving high fixed costs that amplify operating leverage in downturns. Scheduled turnarounds and mandatory regulatory upgrades regularly interrupt production and raise short-term cash needs. These capital and timing stresses constrain the group's financial flexibility during weak market cycles.
Regulatory and environmental liabilities
Chemicals and energy operations expose PCC SE to stringent safety, REACH and Industrial Emissions Directive obligations; EU carbon pricing around €90/t in 2024–25 raises operating costs and can delay projects through permitting. Compliance spending and remediation liabilities create direct cash outflows and potential fines, while environmental incidents would damage reputation and EBITDA. Rising ESG expectations—global sustainable debt >€1.5tn by 2024—may force additional capex.
Complexity of multi-subsidiary oversight
Complexity of multi-subsidiary oversight: PCC SEs broad portfolio raises coordination demands and information asymmetry, making consistent KPIs, risk controls and culture across units difficult to enforce. Management bandwidth can be stretched when multiple initiatives run concurrently, increasing operational risk. This layer of complexity may also mask underperformance in individual pockets until issues amplify.
- Coordination demands
- Information asymmetry
- Inconsistent KPIs/controls
- Stretched management bandwidth
- Hidden underperformance
Customer concentration in industrial end-markets
Customer concentration in construction, automotive and electronics ties PCC SE revenues to cyclical end-markets, so demand shocks rapidly depress volumes and force margin pressure; weak markets can lead to unfavorable contract repricing and shorter order horizons; even a broad customer base may leave sectoral concentration risk intact.
- End-market clustering
- Rapid transmission to volumes/pricing
- Repricing risk in downturns
- Sectoral concentration persists
Commodity cycles, heavy capex and EU carbon €90/t compress margins
PCC SE is exposed to cyclical commodity swings, high fixed capex and regulatory costs that compress margins and make earnings lumpy; EU carbon pricing (~€90/t in 2024–25) and rising ESG expectations (global sustainable debt >€1.5tn by 2024) heighten cash demands while multi-subsidiary complexity and end-market concentration increase operational and demand risks.
| Metric | Value |
|---|---|
| EU carbon price (2024–25) | ~€90/t |
What You See Is What You Get
PCC SE SWOT Analysis
This is the actual PCC SE SWOT analysis document you’re previewing—no sample, no surprises, just professional quality. The excerpt below is pulled directly from the full report you'll receive after purchase. Buy now to unlock the complete, editable SWOT file with full detail and structured insights ready for use.
Description
Dive Deeper Into the Company’s Strategic Blueprint
PCC SE’s diversified chemicals and logistics platform shows clear operational strengths but faces market cyclicality and regulatory pressures; our full SWOT unpacks competitive advantages, key risks, and growth levers with actionable recommendations. Purchase the complete, editable report to plan, pitch, or invest with confidence.
Strengths
Diversified industrial portfolio
Operating across three core sectors — chemicals, energy and logistics — reduces cyclicality and revenue volatility for PCC SE. With over 30 years of group experience (founded 1993) segment diversification creates multiple earnings levers and cross-hedges commodity exposures. It enables capital reallocation to higher-return niches over the cycle. This breadth supports resilience and long-term value creation.
Deep chemicals manufacturing footprint
Scale and know-how in chlor-alkali, polyols and silicon metal give PCC SE structural cost advantages and raise technical barriers to entry through optimized electrolysis and synthesis routes. Vertical integration and process expertise drive higher yields and consistent product quality across sites. Longstanding industrial customer relationships secure recurring demand and anchor stable cash flows for the group.
Integrated value chain synergies
Ownership of logistics gives PCC SE tighter supply reliability, enabling service levels that industry studies show can reduce stockouts by up to 30% and logistics costs by roughly 12–15% versus non-integrated peers. Coordinating production, storage and distribution lowers working capital needs—vertical players typically cut WC by ~10%—and smooths bottlenecks across chemical outputs. Internal logistics data also sharpens pricing and contract terms, strengthening competitive positioning versus standalone competitors.
Energy capabilities including renewables
Participation in energy generation gives PCC SE a partial hedge against industrial power price volatility by enabling self-generation and long-term PPAs that typically lock prices for 10–15 years; aligning with Germany’s 80% electricity-from-renewables target for 2030 strengthens market positioning.
- Hedge vs spot price swings
- Scope 2 reductions via on-site renewables
- Supply security from self-gen and PPAs
- Supports operational decarbonization
Long-term, active investment approach
PCC SEs long-term, active investment approach as a holding company enables disciplined capital allocation into high-ROI projects across chemicals, energy and logistics, while active ownership drives operational improvements and portfolio pruning. A long-duration orientation matches industrial asset life cycles and supports compounding of value via reinvestment and strategic exits.
- holding-company model
- active ownership
- long-duration alignment
- value compounding
Chemicals, energy & logistics platform: scale-driven cost edge, lower stockouts and WC
Diversified across chemicals, energy and logistics (founded 1993; 30+ years) reducing cyclicality and enabling capital rotation to higher-return niches. Technical scale in chlor-alkali, polyols and silicon metal drives cost advantages and recurring customer demand. Vertical logistics cuts stockouts by up to 30% and logistics costs ~12–15%; verticality typically lowers WC ~10%. Self-generation/PPAs (10–15y) hedge power volatility.
| Metric | Fact |
|---|---|
| Founded | 1993 |
| Logistics impact | Stockouts -30% / Costs -12–15% |
| Working capital | -~10% vs peers |
| PPAs | 10–15 years |
What is included in the product
Detailed Word Document
Provides a concise SWOT analysis of PCC SE, outlining its core strengths and internal weaknesses while identifying external opportunities and market threats that shape its strategic position and growth prospects.
Customizable Excel Spreadsheet
Provides a concise, visual SWOT matrix for PCC SE to align strategy quickly and relieve analysis bottlenecks. Editable format enables fast updates for presentations and stakeholder reviews.
Weaknesses
Exposure to commodity price swings
PCC SE's chlor-alkali, silicon metal and energy businesses are tied to cyclical commodity markets, exposing revenues to volatile price swings. Margin compression can occur when feedstock or energy costs rise faster than selling prices; hedging programs only partially mitigate volatility. Earnings are often lumpy, making short-term forecasting challenging.
Capital intensity and maintenance burden
Chemical plants and energy assets within PCC SE demand heavy upfront capex and continuous maintenance, driving high fixed costs that amplify operating leverage in downturns. Scheduled turnarounds and mandatory regulatory upgrades regularly interrupt production and raise short-term cash needs. These capital and timing stresses constrain the group's financial flexibility during weak market cycles.
Regulatory and environmental liabilities
Chemicals and energy operations expose PCC SE to stringent safety, REACH and Industrial Emissions Directive obligations; EU carbon pricing around €90/t in 2024–25 raises operating costs and can delay projects through permitting. Compliance spending and remediation liabilities create direct cash outflows and potential fines, while environmental incidents would damage reputation and EBITDA. Rising ESG expectations—global sustainable debt >€1.5tn by 2024—may force additional capex.
Complexity of multi-subsidiary oversight
Complexity of multi-subsidiary oversight: PCC SEs broad portfolio raises coordination demands and information asymmetry, making consistent KPIs, risk controls and culture across units difficult to enforce. Management bandwidth can be stretched when multiple initiatives run concurrently, increasing operational risk. This layer of complexity may also mask underperformance in individual pockets until issues amplify.
- Coordination demands
- Information asymmetry
- Inconsistent KPIs/controls
- Stretched management bandwidth
- Hidden underperformance
Customer concentration in industrial end-markets
Customer concentration in construction, automotive and electronics ties PCC SE revenues to cyclical end-markets, so demand shocks rapidly depress volumes and force margin pressure; weak markets can lead to unfavorable contract repricing and shorter order horizons; even a broad customer base may leave sectoral concentration risk intact.
- End-market clustering
- Rapid transmission to volumes/pricing
- Repricing risk in downturns
- Sectoral concentration persists
Commodity cycles, heavy capex and EU carbon €90/t compress margins
PCC SE is exposed to cyclical commodity swings, high fixed capex and regulatory costs that compress margins and make earnings lumpy; EU carbon pricing (~€90/t in 2024–25) and rising ESG expectations (global sustainable debt >€1.5tn by 2024) heighten cash demands while multi-subsidiary complexity and end-market concentration increase operational and demand risks.
| Metric | Value |
|---|---|
| EU carbon price (2024–25) | ~€90/t |
What You See Is What You Get
PCC SE SWOT Analysis
This is the actual PCC SE SWOT analysis document you’re previewing—no sample, no surprises, just professional quality. The excerpt below is pulled directly from the full report you'll receive after purchase. Buy now to unlock the complete, editable SWOT file with full detail and structured insights ready for use.











