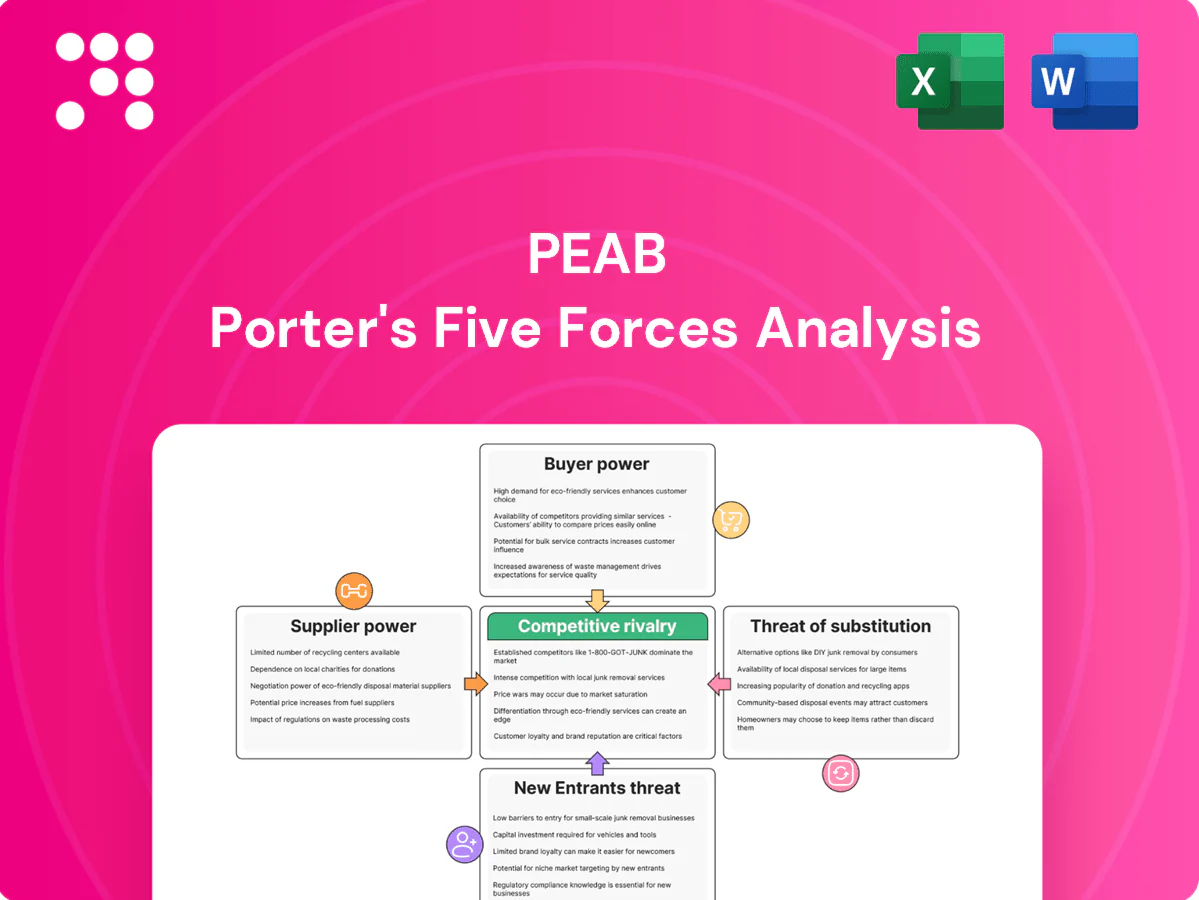
Peab Porter's Five Forces Analysis

From Overview to Strategy Blueprint
Peab's Porter’s Five Forces analysis highlights moderate buyer power, strong supplier fragmentation, intense rivalry in construction and civil engineering, and manageable substitute threats amid rising regulatory risk. This snapshot teases strategic levers and vulnerabilities. Unlock the full Porter’s Five Forces Analysis to access force-by-force ratings, visuals, and actionable implications tailored to Peab.
Suppliers Bargaining Power

Vertical integration dampens
Peab’s in-house asphalt, aggregates and concrete production—supporting operations alongside a reported 2024 net sales of about 66 billion SEK—reduces reliance on external suppliers, improving price certainty and input availability. Forward integration strengthens Peab’s negotiating leverage with third-party vendors, though energy and speciality chemicals remain externally sourced and expose margins to market volatility.
Commodity volatility passes through
Input cost swings in cement, steel, bitumen and energy squeeze Peab margins, with energy prices averaging about 86 USD/barrel for Brent in 2024 increasing operational fuel and asphalt costs.
Peab partially passes costs via index-linked contracts, but timing gaps between supplier spikes and contract adjustments create margin risk.
Suppliers gain leverage during price spikes or tight capacity; hedging and framework agreements reduce volatility exposure but do not eliminate it.

Specialized trades scarce
Skilled subcontractors for MEP, tunneling and complex civil works are scarce in the Nordics, giving specialist firms strong leverage over Peab. Scarcity elevates rates and tightens delivery windows, while stringent quality and safety standards further narrow the eligible pool. Long-term, multi-year partnerships are used to lock capacity and predictable terms, mitigating supplier bargaining power and schedule risk.

Regulatory and ESG constraints
Regulatory and ESG constraints narrow Peab’s eligible supplier pool as origin tracing and strict environmental standards remove non-compliant vendors; buildings and construction account for about 38% of global energy‑related CO2 emissions. Certified low‑carbon materials and compliant waste handlers command premiums, while suppliers meeting Nordic labor and ESG rules gain leverage; EU ETS carbon pricing (~€95/t in mid‑2024) raises input costs.
- Smaller supplier base
- Premiums for low‑carbon inputs
- Stronger supplier leverage
- Long‑term ESG sourcing reduces dependency
Logistics and local proximity
Construction is local and transport can add up to 10% of material costs, making nearby quarries and plants critical; in remote regions regional supplier concentration sharply increases supplier bargaining power. Peab’s Scandinavian logistics network reduces exposure but site-specific access and capacity limits keep local suppliers influential. Early procurement and formal local alliances have reduced localized price spikes for Peab in 2024.
- Local sourcing importance: transport ≈10% of material cost
- Mitigation: Peab logistics network + early procurement
Higher inputs: Brent ~86 USD, EU ETS ~€95
Peab’s 2024 net sales ~66 billion SEK and in‑house asphalt, aggregates and concrete cut supplier dependence, but Brent ~86 USD/bbl and EU ETS ~€95/t (mid‑2024) raise input costs; scarce Nordic specialist subcontractors increase supplier leverage; mitigations include long‑term contracts, hedging and local logistics to cap transport (~10% of material cost).
| Metric | 2024 |
|---|---|
| Net sales | ~66 bn SEK |
| Brent | ~86 USD/bbl |
| EU ETS price | ~€95/t |
| Transport share | ≈10% material cost |
What is included in the product
 Detailed Word Document
Uncovers key drivers of competition, customer influence, and market entry risks tailored to Peab, detailing each competitive force with industry data, supplier/buyer power, substitutes, and barriers protecting incumbents; editable Word format for use in investor materials, strategy decks, or academic projects.

 Customizable Excel Spreadsheet
One-sheet Peab Porter's Five Forces summary that turns complex competitive dynamics into instant decisions, with customizable pressure levels and a ready-made spider chart for clear strategic direction. Easy to adapt, export, and drop into pitch decks—no technical skills required.
Customers Bargaining Power

Public clients dominate
States, municipalities and agencies run competitive tenders with strict technical and sustainability criteria; public procurement represented about 14% of EU GDP in 2021 (European Commission), amplifying buyer leverage. High transparency and standardized rules plus widespread use of framework agreements enforce pricing discipline and performance KPIs. Payment terms and risk allocation frequently favor the public buyer, squeezing supplier margins.
Price-sensitive private developers
Private residential and commercial clients frequently switch among large contractors; in 2024 many buyers used buyer's market dynamics to extract discounts and incentives often reported in the range of 10–15% from list tender prices. Design‑build and guaranteed maximum price contracts in 2024 continued shifting cost risk to contractors, compressing margins. Peab and peers can command modest premiums of roughly 2–5% for strong reputation and delivery certainty.

Project size concentrates power
Large infrastructure packages (often >€500m–€1bn) concentrate purchasing power into a few buyers, shifting leverage away from contractors. A single award can represent over 30% of a regional order book, magnifying buyer influence on pricing and scheduling. Buyers routinely bundle scopes to secure discounts and more favorable payment terms, while mandatory JV rules dilute contractor negotiating strength further.

Specification and standardization
Nordic specification and standardization create apples-to-apples bids that intensify price competition and limit Peab’s ability to differentiate beyond operational excellence. Detailed specs constrain design-led margins and make buyers more likely to substitute materials or methods to lower cost. Early contractor involvement, when used, has potential to reduce adversarial claims and align incentives.
- Public procurement scale ~14% of EU GDP — increases buyer leverage
- Standardized specs = higher price pressure
- Substitution risk (materials/methods) lowers margins
- Early contractor involvement reduces disputes
Performance-based penalties
Performance-based penalties such as LDs, bonus-malus schemes and strict availability KPIs (commonly targeting 98–99.5% uptime in port O&M contracts) transfer schedule and performance risk onto contractors and give buyers measurable financial remedies.
Buyers increasingly enforce tight schedules and quality thresholds with financial teeth—liquidated damages are frequently structured as daily rates with caps often seen in industry practice around 5–10% of contract value—boosting buyer leverage and making robust risk management essential to protect margins.
- LDs: daily rates with typical industry caps ~5–10% of contract value
- Availability KPIs: targets ~98–99.5% uptime
- Bonus-malus: adjustments commonly move total payments by up to ±10%
- Result: increased buyer leverage; require strict contractor risk controls
Public procurement power: 10-15% tender discounts, KPIs shift risk to contractors
States and agencies run competitive tenders with public procurement ~14% of EU GDP (2021), giving buyers strong leverage via framework agreements and standardized specs. Buyers extracted typical tender discounts of 10–15% in 2024 while Peab can command 2–5% premium; large packages (>€500m–€1bn) may represent >30% of regional order books. LDs and KPIs (availability 98–99.5%, LD caps ~5–10% of contract value) transfer risk to contractors.
Full Version Awaits
Peab Porter's Five Forces Analysis
This Peab Porter's Five Forces Analysis preview is the exact document you'll receive after purchase, with no placeholders or mockups. It offers a full, professionally formatted assessment of competitive dynamics for immediate use. Upon payment you'll get instant access to this same file, ready to download and share. No surprises—what you see is what you get.

From Overview to Strategy Blueprint
Peab's Porter’s Five Forces analysis highlights moderate buyer power, strong supplier fragmentation, intense rivalry in construction and civil engineering, and manageable substitute threats amid rising regulatory risk. This snapshot teases strategic levers and vulnerabilities. Unlock the full Porter’s Five Forces Analysis to access force-by-force ratings, visuals, and actionable implications tailored to Peab.
Suppliers Bargaining Power
Vertical integration dampens
Peab’s in-house asphalt, aggregates and concrete production—supporting operations alongside a reported 2024 net sales of about 66 billion SEK—reduces reliance on external suppliers, improving price certainty and input availability. Forward integration strengthens Peab’s negotiating leverage with third-party vendors, though energy and speciality chemicals remain externally sourced and expose margins to market volatility.
Commodity volatility passes through
Input cost swings in cement, steel, bitumen and energy squeeze Peab margins, with energy prices averaging about 86 USD/barrel for Brent in 2024 increasing operational fuel and asphalt costs.
Peab partially passes costs via index-linked contracts, but timing gaps between supplier spikes and contract adjustments create margin risk.
Suppliers gain leverage during price spikes or tight capacity; hedging and framework agreements reduce volatility exposure but do not eliminate it.
Specialized trades scarce
Skilled subcontractors for MEP, tunneling and complex civil works are scarce in the Nordics, giving specialist firms strong leverage over Peab. Scarcity elevates rates and tightens delivery windows, while stringent quality and safety standards further narrow the eligible pool. Long-term, multi-year partnerships are used to lock capacity and predictable terms, mitigating supplier bargaining power and schedule risk.
Regulatory and ESG constraints
Regulatory and ESG constraints narrow Peab’s eligible supplier pool as origin tracing and strict environmental standards remove non-compliant vendors; buildings and construction account for about 38% of global energy‑related CO2 emissions. Certified low‑carbon materials and compliant waste handlers command premiums, while suppliers meeting Nordic labor and ESG rules gain leverage; EU ETS carbon pricing (~€95/t in mid‑2024) raises input costs.
- Smaller supplier base
- Premiums for low‑carbon inputs
- Stronger supplier leverage
- Long‑term ESG sourcing reduces dependency
Logistics and local proximity
Construction is local and transport can add up to 10% of material costs, making nearby quarries and plants critical; in remote regions regional supplier concentration sharply increases supplier bargaining power. Peab’s Scandinavian logistics network reduces exposure but site-specific access and capacity limits keep local suppliers influential. Early procurement and formal local alliances have reduced localized price spikes for Peab in 2024.
- Local sourcing importance: transport ≈10% of material cost
- Mitigation: Peab logistics network + early procurement
Higher inputs: Brent ~86 USD, EU ETS ~€95
Peab’s 2024 net sales ~66 billion SEK and in‑house asphalt, aggregates and concrete cut supplier dependence, but Brent ~86 USD/bbl and EU ETS ~€95/t (mid‑2024) raise input costs; scarce Nordic specialist subcontractors increase supplier leverage; mitigations include long‑term contracts, hedging and local logistics to cap transport (~10% of material cost).
| Metric | 2024 |
|---|---|
| Net sales | ~66 bn SEK |
| Brent | ~86 USD/bbl |
| EU ETS price | ~€95/t |
| Transport share | ≈10% material cost |
What is included in the product
Detailed Word Document
Uncovers key drivers of competition, customer influence, and market entry risks tailored to Peab, detailing each competitive force with industry data, supplier/buyer power, substitutes, and barriers protecting incumbents; editable Word format for use in investor materials, strategy decks, or academic projects.
Customizable Excel Spreadsheet
One-sheet Peab Porter's Five Forces summary that turns complex competitive dynamics into instant decisions, with customizable pressure levels and a ready-made spider chart for clear strategic direction. Easy to adapt, export, and drop into pitch decks—no technical skills required.
Customers Bargaining Power
Public clients dominate
States, municipalities and agencies run competitive tenders with strict technical and sustainability criteria; public procurement represented about 14% of EU GDP in 2021 (European Commission), amplifying buyer leverage. High transparency and standardized rules plus widespread use of framework agreements enforce pricing discipline and performance KPIs. Payment terms and risk allocation frequently favor the public buyer, squeezing supplier margins.
Price-sensitive private developers
Private residential and commercial clients frequently switch among large contractors; in 2024 many buyers used buyer's market dynamics to extract discounts and incentives often reported in the range of 10–15% from list tender prices. Design‑build and guaranteed maximum price contracts in 2024 continued shifting cost risk to contractors, compressing margins. Peab and peers can command modest premiums of roughly 2–5% for strong reputation and delivery certainty.
Project size concentrates power
Large infrastructure packages (often >€500m–€1bn) concentrate purchasing power into a few buyers, shifting leverage away from contractors. A single award can represent over 30% of a regional order book, magnifying buyer influence on pricing and scheduling. Buyers routinely bundle scopes to secure discounts and more favorable payment terms, while mandatory JV rules dilute contractor negotiating strength further.
Specification and standardization
Nordic specification and standardization create apples-to-apples bids that intensify price competition and limit Peab’s ability to differentiate beyond operational excellence. Detailed specs constrain design-led margins and make buyers more likely to substitute materials or methods to lower cost. Early contractor involvement, when used, has potential to reduce adversarial claims and align incentives.
- Public procurement scale ~14% of EU GDP — increases buyer leverage
- Standardized specs = higher price pressure
- Substitution risk (materials/methods) lowers margins
- Early contractor involvement reduces disputes
Performance-based penalties
Performance-based penalties such as LDs, bonus-malus schemes and strict availability KPIs (commonly targeting 98–99.5% uptime in port O&M contracts) transfer schedule and performance risk onto contractors and give buyers measurable financial remedies.
Buyers increasingly enforce tight schedules and quality thresholds with financial teeth—liquidated damages are frequently structured as daily rates with caps often seen in industry practice around 5–10% of contract value—boosting buyer leverage and making robust risk management essential to protect margins.
- LDs: daily rates with typical industry caps ~5–10% of contract value
- Availability KPIs: targets ~98–99.5% uptime
- Bonus-malus: adjustments commonly move total payments by up to ±10%
- Result: increased buyer leverage; require strict contractor risk controls
Public procurement power: 10-15% tender discounts, KPIs shift risk to contractors
States and agencies run competitive tenders with public procurement ~14% of EU GDP (2021), giving buyers strong leverage via framework agreements and standardized specs. Buyers extracted typical tender discounts of 10–15% in 2024 while Peab can command 2–5% premium; large packages (>€500m–€1bn) may represent >30% of regional order books. LDs and KPIs (availability 98–99.5%, LD caps ~5–10% of contract value) transfer risk to contractors.
Full Version Awaits
Peab Porter's Five Forces Analysis
This Peab Porter's Five Forces Analysis preview is the exact document you'll receive after purchase, with no placeholders or mockups. It offers a full, professionally formatted assessment of competitive dynamics for immediate use. Upon payment you'll get instant access to this same file, ready to download and share. No surprises—what you see is what you get.
Original: $10.00
-65%$10.00
$3.50Description
From Overview to Strategy Blueprint
Peab's Porter’s Five Forces analysis highlights moderate buyer power, strong supplier fragmentation, intense rivalry in construction and civil engineering, and manageable substitute threats amid rising regulatory risk. This snapshot teases strategic levers and vulnerabilities. Unlock the full Porter’s Five Forces Analysis to access force-by-force ratings, visuals, and actionable implications tailored to Peab.
Suppliers Bargaining Power
Vertical integration dampens
Peab’s in-house asphalt, aggregates and concrete production—supporting operations alongside a reported 2024 net sales of about 66 billion SEK—reduces reliance on external suppliers, improving price certainty and input availability. Forward integration strengthens Peab’s negotiating leverage with third-party vendors, though energy and speciality chemicals remain externally sourced and expose margins to market volatility.
Commodity volatility passes through
Input cost swings in cement, steel, bitumen and energy squeeze Peab margins, with energy prices averaging about 86 USD/barrel for Brent in 2024 increasing operational fuel and asphalt costs.
Peab partially passes costs via index-linked contracts, but timing gaps between supplier spikes and contract adjustments create margin risk.
Suppliers gain leverage during price spikes or tight capacity; hedging and framework agreements reduce volatility exposure but do not eliminate it.
Specialized trades scarce
Skilled subcontractors for MEP, tunneling and complex civil works are scarce in the Nordics, giving specialist firms strong leverage over Peab. Scarcity elevates rates and tightens delivery windows, while stringent quality and safety standards further narrow the eligible pool. Long-term, multi-year partnerships are used to lock capacity and predictable terms, mitigating supplier bargaining power and schedule risk.
Regulatory and ESG constraints
Regulatory and ESG constraints narrow Peab’s eligible supplier pool as origin tracing and strict environmental standards remove non-compliant vendors; buildings and construction account for about 38% of global energy‑related CO2 emissions. Certified low‑carbon materials and compliant waste handlers command premiums, while suppliers meeting Nordic labor and ESG rules gain leverage; EU ETS carbon pricing (~€95/t in mid‑2024) raises input costs.
- Smaller supplier base
- Premiums for low‑carbon inputs
- Stronger supplier leverage
- Long‑term ESG sourcing reduces dependency
Logistics and local proximity
Construction is local and transport can add up to 10% of material costs, making nearby quarries and plants critical; in remote regions regional supplier concentration sharply increases supplier bargaining power. Peab’s Scandinavian logistics network reduces exposure but site-specific access and capacity limits keep local suppliers influential. Early procurement and formal local alliances have reduced localized price spikes for Peab in 2024.
- Local sourcing importance: transport ≈10% of material cost
- Mitigation: Peab logistics network + early procurement
Higher inputs: Brent ~86 USD, EU ETS ~€95
Peab’s 2024 net sales ~66 billion SEK and in‑house asphalt, aggregates and concrete cut supplier dependence, but Brent ~86 USD/bbl and EU ETS ~€95/t (mid‑2024) raise input costs; scarce Nordic specialist subcontractors increase supplier leverage; mitigations include long‑term contracts, hedging and local logistics to cap transport (~10% of material cost).
| Metric | 2024 |
|---|---|
| Net sales | ~66 bn SEK |
| Brent | ~86 USD/bbl |
| EU ETS price | ~€95/t |
| Transport share | ≈10% material cost |
What is included in the product
Detailed Word Document
Uncovers key drivers of competition, customer influence, and market entry risks tailored to Peab, detailing each competitive force with industry data, supplier/buyer power, substitutes, and barriers protecting incumbents; editable Word format for use in investor materials, strategy decks, or academic projects.
Customizable Excel Spreadsheet
One-sheet Peab Porter's Five Forces summary that turns complex competitive dynamics into instant decisions, with customizable pressure levels and a ready-made spider chart for clear strategic direction. Easy to adapt, export, and drop into pitch decks—no technical skills required.
Customers Bargaining Power
Public clients dominate
States, municipalities and agencies run competitive tenders with strict technical and sustainability criteria; public procurement represented about 14% of EU GDP in 2021 (European Commission), amplifying buyer leverage. High transparency and standardized rules plus widespread use of framework agreements enforce pricing discipline and performance KPIs. Payment terms and risk allocation frequently favor the public buyer, squeezing supplier margins.
Price-sensitive private developers
Private residential and commercial clients frequently switch among large contractors; in 2024 many buyers used buyer's market dynamics to extract discounts and incentives often reported in the range of 10–15% from list tender prices. Design‑build and guaranteed maximum price contracts in 2024 continued shifting cost risk to contractors, compressing margins. Peab and peers can command modest premiums of roughly 2–5% for strong reputation and delivery certainty.
Project size concentrates power
Large infrastructure packages (often >€500m–€1bn) concentrate purchasing power into a few buyers, shifting leverage away from contractors. A single award can represent over 30% of a regional order book, magnifying buyer influence on pricing and scheduling. Buyers routinely bundle scopes to secure discounts and more favorable payment terms, while mandatory JV rules dilute contractor negotiating strength further.
Specification and standardization
Nordic specification and standardization create apples-to-apples bids that intensify price competition and limit Peab’s ability to differentiate beyond operational excellence. Detailed specs constrain design-led margins and make buyers more likely to substitute materials or methods to lower cost. Early contractor involvement, when used, has potential to reduce adversarial claims and align incentives.
- Public procurement scale ~14% of EU GDP — increases buyer leverage
- Standardized specs = higher price pressure
- Substitution risk (materials/methods) lowers margins
- Early contractor involvement reduces disputes
Performance-based penalties
Performance-based penalties such as LDs, bonus-malus schemes and strict availability KPIs (commonly targeting 98–99.5% uptime in port O&M contracts) transfer schedule and performance risk onto contractors and give buyers measurable financial remedies.
Buyers increasingly enforce tight schedules and quality thresholds with financial teeth—liquidated damages are frequently structured as daily rates with caps often seen in industry practice around 5–10% of contract value—boosting buyer leverage and making robust risk management essential to protect margins.
- LDs: daily rates with typical industry caps ~5–10% of contract value
- Availability KPIs: targets ~98–99.5% uptime
- Bonus-malus: adjustments commonly move total payments by up to ±10%
- Result: increased buyer leverage; require strict contractor risk controls
Public procurement power: 10-15% tender discounts, KPIs shift risk to contractors
States and agencies run competitive tenders with public procurement ~14% of EU GDP (2021), giving buyers strong leverage via framework agreements and standardized specs. Buyers extracted typical tender discounts of 10–15% in 2024 while Peab can command 2–5% premium; large packages (>€500m–€1bn) may represent >30% of regional order books. LDs and KPIs (availability 98–99.5%, LD caps ~5–10% of contract value) transfer risk to contractors.
Full Version Awaits
Peab Porter's Five Forces Analysis
This Peab Porter's Five Forces Analysis preview is the exact document you'll receive after purchase, with no placeholders or mockups. It offers a full, professionally formatted assessment of competitive dynamics for immediate use. Upon payment you'll get instant access to this same file, ready to download and share. No surprises—what you see is what you get.











